BNL-68068
Centrality Dependence of Charged Particle Multiplicity
in Au-Au Collisions at GeV
Abstract
We present results for the charged-particle multiplicity distribution at midrapidity in Au - Au collisions at GeV measured with the PHENIX detector at RHIC. For the 5% most central collisions we find . The results, analyzed as a function of centrality, show a steady rise of the particle density per participating nucleon with centrality.
pacs:
PACS numbers: 25.75.DwThe Relativistic Heavy-Ion Collider (RHIC) at Brookhaven National Laboratory started regular operation in June 2000, opening new frontiers in the study of hadronic matter under unprecedented conditions of temperature and energy density. The research is focused on the phase transition associated with quark deconfinement and chiral symmetry restoration expected to take place under those conditions.
In this letter, we report results for the charged-particle multiplicity distribution at midrapidity in Au - Au collisions at GeV, as measured with the PHENIX detector. These are the first RHIC results to span a broad impact parameter range.
Particle density at midrapidity is an essential global variable for the characterization of high energy nuclear collisions, providing information about the initial conditions, such as energy density. The results presented here should help to constrain the wide range of theoretical predictions [2] available at RHIC energies and to discriminate among various mechanisms of entropy and particle production. In particular, we analyze the particle density as a function of centrality, expressed by the number of participating nucleons. Such an analysis may shed light on the relative importance of soft versus hard processes of particle production and test the assumption of gluon saturation expected at RHIC energies [3, 4]. Our results are compared to different models, to similar studies obtained in Pb-Pb collisions at the CERN SPS [5, 6, 7] and to a recent measurement performed at RHIC by PHOBOS [8].
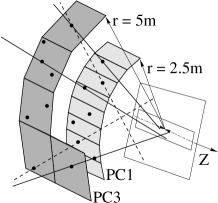
The PHENIX detector is decribed in ref. [9]. The present analysis relies primarily on three PHENIX subsystems: two layers of Pad Chambers (PC), called PC1 and PC3, used to determine the charged particle multiplicity, the Zero Degree Calorimeters (ZDC) and the Beam-Beam Counters (BBC), used to derive the trigger and the off-line event selection. The PC provide three-dimensional coordinates along the charged-particle trajectories [10]. The two layers are mounted at radial distances of 2.49 m and 4.98 m, respectively, from the interaction region. Each layer has 8 wire chambers with cathode pad readout (see Fig. 1) and covers 90o in azimuth () and units of pseudorapidity (). The ZDC are small transverse-area hadron calorimeters that measure neutron energy within a 2 mrad () cone around the beam direction and are located at 18.25m from the center of the interaction region [11]. The BBC comprise two arrays of 64 photomultiplier tubes each equipped with quartz Cherenkov radiators. The BBC are located around the beam direction at 1.44m from the center of the interaction region covering the full 2 azimuth and the range (3.0 - 3.9) [12].
The primary interaction trigger is generated by a coincidence between the two BBC with at least two photomultipliers fired in each of them and a requirement on the collision vertex position, usually cm. Based on detailed simulations of the BBC, this trigger reflects []% of the nuclear interaction cross section of 7.2 barns [13]. Another trigger is generated by a coincidence between the two ZDC, each one with an energy signal larger than 10 GeV. This trigger reflects the nuclear interaction plus the mutual Coulomb dissociation cross sections. Most BBC triggers (97.8%) also satisfy the ZDC trigger requirement. The small percentage of exclusive BBC triggers is due to inefficiencies of the ZDC trigger and background interactions. These two sources are difficult to distinguish and we estimate a background event contamination of []% of the total event sample.
This analysis is based on a sample of 137,784 events taken without magnetic field, satisfying the BBC trigger and with a reconstructed vertex position cm.
The number of primary charged particles per event is determined on a statistical basis by correlating hits in PC1 and PC3. The analysis procedure was developed and corroborated by extensive simulations using the GEANT [14] response of the PHENIX detector to events generated with HIJING [15]. The vertex is reconstructed using the following algorithm: all hits in PC3 are combined with all hits in PC1 and the resulting lines are projected onto a plane through the beam line, perpendicular to the symmetry axis of the chambers (see Fig. 1). For events with more than 5 tracks, the distribution of these projections along the Z axis produces a distinct peak which defines the vertex position. For low-multiplicity events the vertex is reconstructed from the time difference between the two BBC.
Once the vertex is known, all hits in PC3 are again combined with all hits in PC1 and the resulting tracks are projected onto the plane previously defined. The distribution of the distance R of the intersection points to the vertex position, is shown in Fig. 2. This distribution contains real tracks and tracks from the obvious combinatorial background inherent to the adopted procedure of combining all hits in PC3 with all hits in PC1. The latter can be determined by a mixed event technique; in the present analysis, each sector in PC1 was exchanged with its neighbor and the resulting combinatorial background is shown in Fig. 2 by the dotted line. The yield of this background increases quadratically with R (leading to a linear dependence in the differential dN/dR vs. R presentation of Fig. 2).
The R distribution of real tracks obtained by subtracting the background (NB) from the total number of tracks is shown in Fig. 2 by the dashed line. The sharp peak at small R is due to tracks from primary particles originating at the vertex and the long tail is due to decay products of primary particles decaying in flight. In practice, the track counting is performed up to a given R value. The fraction of counted tracks as a function of R is obtained from the integral of the dashed curve normalized to the total integral up to . The tail at large R values is very well described by an exponential function and therefore the extrapolation of the dashed curve to is straightforward. The larger the value of R, the smaller is the correction for the fraction of uncounted tracks but the larger the background to be subtracted. Since the background can be reliably subtracted we performed the track counting up to R=25cm, thus including 95.9% of all tracks.
After subtracting the background, a raw multiplicity distribution is obtained to which we apply several corrections to obtain the corrected distribution of primary charged particles:
(i) A correction of 15.3% accounts for inactive gaps between the chambers, inactive electronic readout cards and dead pads in the PC1 and PC3 detectors.
(ii) Using cosmic rays, the pad chamber hit efficiency was measured to be 99.4% for isolated single hits in agreement with an analytical study of the chamber performance [16].
(iii) The track losses due to the finite double hit resolution of the chambers depend on the event multiplicity. The losses occur in the direct counting of tracks and in the combinatorial background subtraction. The two effects were studied in great detail with Monte Carlo techniques. For the first one, the correction amounts to 13.3% for the 5% most central collisions, whereas it is only 4.9% for the 20-25% bin. The second effect is a reduction of the combinatorial background which leads to an increase in the track multiplicity by .
(iv) Finally there is a correction due to uncounted charged tracks. Two sources contribute here. First, there is a correction of 4.3% from tracks missed because the analysis is limited to R=25cm. The second source has two components. On the one hand there are primary charged particles (mainly ) which decay in flight. A large fraction of these decays is accounted for since, as discussed above, they produce the tail of the R distribution in Fig. 2. However, there is still a small number of decays which miss altogether PC1 and/or PC3 and those have to be added. On the other hand, there is feed-down from neutral particle decays (mainly and ) which lead to valid tracks. Those have to be subtracted. Both components depend on particle composition and momentum distribution. Lacking precise information about them, we performed Monte Carlo simulations, applying to the GEANT response of the pad chambers the same analysis procedure as to real data and comparing the resulting multiplicity to the original HIJING input. The result is a net correction of only 2.8%. This correction is quite robust against changes in the input. For example, a uniform 20% increase in momentum of all pions reduces the net correction to 1%.
The systematic error in the multiplicity due to corrections (i) and (ii) is estimated at less than 2%. To these we have to add the errors associated with the background subtraction, double hit resolution (which are multiplicity dependent) and particle decays (which is multiplicity independent). We estimate the first two uncertainties to be 4.6% at the highest multiplicities, based on Monte Carlo guidance and a comparison with an identical analysis in which we imposed a 50% larger double hit resolution in PC1 and PC3. For the particle decay correction, we assign an error of 4% based on the effect of varying the momentum distribution and the particle composition in the simulations and a comparison with the results obtained with another data set measured while the detectors were retracted by 44 cm from the nominal position. Adding these errors in quadrature results in a total systematic error of 6.5% at the highest multiplicities. An additional error in , which enters in the analysis of the multiplicity versus centrality presented below, is the uncertainty in the total number of events due to the BBC trigger () and the event contamination ().
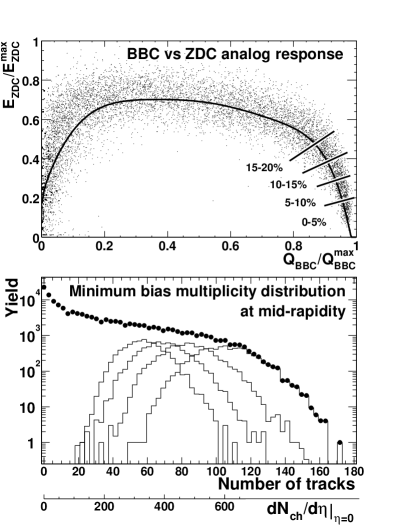
After applying the appropriate corrections we obtain in the lower panel of Fig. 3 the minimum-bias charged-particle multiplicity distribution, in the track acceptance 0.35, = 88.4o. A factor of 5.82 thus converts the observed number of tracks to in one unit of pseudorapidity and full azimuth, yielding the lower horizontal scale in Fig. 3.
Figure 3 also shows the multiplicity distributions for the four most central bins, 0-5% to 15-20%. The bins were defined by cuts in the space of BBC versus ZDC analog response (see Fig. 3 - upper panel) and refer to percentiles of the total interaction cross section of 7.2 barns. In order to avoid the ambiguities inherent in the BBC vs. ZDC distribution, we selected events with increasing centrality based upon the monotonic response of another PHENIX detector. The centroids of these events projected onto the ZDC-BBC space determine the centrality contour indicated by the solid line. The cuts are made perpendicular to this contour. Simulations of the BBC and ZDC response were used to account for the effect of physics and detector fluctuations in the definition of these event classes and to relate them via a Glauber model [13] to the number of participating nucleons and of binary collisions . The average charged particle density scaled up to one unit of rapidity and the corresponding numbers and are tabulated in Table 1 for various centrality bins.
The PHOBOS experiment has recently reported an average for the 6% most central collisions [8]. For the same centrality bin, we find . From the preliminary results reported by NA49 in Pb-Pb collisions at GeV [7], we derive a particle density . Our result, for the same centrality bin (0-5%), represents an increase of after scaling it by 1.2 to account for the transformation from to .
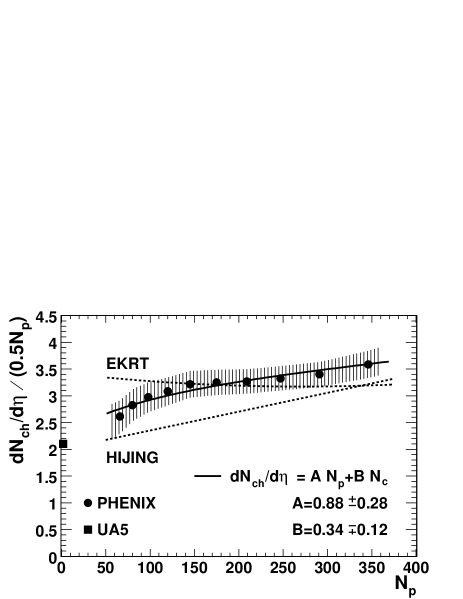
It has recently been emphasized [3] that the centrality dependence of allows one to discriminate between various models of particle production. We show in Fig. 4 our results for per participant pair as a function of the number of participants . Fig. 4 also shows the value at the same taken from the UA5 analysis [17]. It is interesting to note that the extrapolation of our data points to low multiplicities approaches the value.
Models such as HIJING predict that there is a component of particle production from soft interactions that scales linearly with and a second component from hard processes (pQCD jets) that scales with Nc. Following that, we fit the data of Fig. 4 with the function using the values of Nc and Np tabulated in Table 1. The results of the fit are shown in Fig. 4. Note that the errors in A and B are anticorrelated. In such models, the values of A and B imply a large contribution of hard processes to particle production, which increases with centrality from at =68 to for central collisions. HIJING predicts the same trend although the calculated values are lower than the data by 15%. However, this is not a unique interpretation. At Alternating Gradient Synchrotron (AGS) energies, where hard processes do not occur, the particle production per participant was also observed to increase with centrality [18]. At the CERN SPS energy of GeV, a similar behavior was observed. Using a different parametrization, , WA98 finds a best fit value of [5]. Experiment WA97 quotes a value , consistent with the result of WA98 but also compatible with their assumption of proportionality between multiplicity and participants [6]. A good fit to our data can also be obtained with this functional form with a higher value of . One should note that the CERN results are in the lab frame whereas our are in the center of mass system.
Other models such as the EKRT [4] predict that at RHIC energies, the large production of semi-hard gluons in a small volume may saturate the gluon density. The resulting gluon fusion limits the total entropy production and thus lowers the final particle production per participant. The predictions of the EKRT model are also shown in Fig. 4. We observe no such saturation effect within our errors for Au + Au collisions at GeV, but instead see a steady rise in the particle production per participant pair.
We thank the staff of the RHIC project, Collider-Accelerator, and Physics Departments at BNL and the staff of PHENIX participating institutions for their vital contributions. We acknowledge support from the Department of Energy and NSF (U.S.A.), Monbu-sho and STA (Japan), RAS, RMAE, and RMS (Russia), BMBF and DAAD (Germany), FRN, NFR, and the Wallenberg Foundation (Sweden), MIST and NSERC (Canada), CNPq and FAPESP (Brazil), IN2P3/CNRS (France), DAE (India), KRF and KOSEF (Korea), and the US-Israel Binational Science Foundation.
REFERENCES
- [1] Deceased
- [2] S.A. Bass et al., Nucl. Phys. A661, 205c (1999).
- [3] X.N. Wang and M. Gyulassy, Phys. Rev. Lett. 86, 3496 (2001) and nucl-th/0008014.
- [4] K.J. Eskola et al. Nucl. Phys. B570, 379 (2000) and hep-ph/0009246.
- [5] M.M. Aggarwal et al., Eur. Phys. J. C18, 651 (2001) and nucl-ex/0008004.
- [6] F. Antinori et al., Preprint CERN-EP-2000-002.
- [7] J. Bächler et al., Nucl. Phys. A661, 45c (1999).
- [8] B.B. Back et al., Phys. Rev. Lett. 85, 3100 (2000).
- [9] D.P. Morrison, Nucl. Phys. A638, 565c (1998); ibid N. Saito, p. 575c.
- [10] P. Nilsson et al., Nucl. Phys. A661, 665c (1999).
- [11] C. Adler et al., nucl-ex/0008005.
- [12] K. Ikematsu et al., Nucl. Instrum. Meth. A411, 238 (1998).
- [13] We used the Woods-Saxon nuclear density distribution, Au nucleus radius R=6.650.3fm, diffuseness a=0.540.01fm and nucleon-nucleon cross section =405mb.
- [14] GEANT 3.2.1, CERN program library.
- [15] X.N. Wang and M. Gyulassy, Phys. Rev. D44, 3501 (1991). We used version 1.35 with default parameters.
- [16] A. Milov et al., PHENIX technical note 379.
- [17] G.J. Alner et al., Z. Phys. C33, 1 (1986).
- [18] L. Ahle et al., Phys. Rev. C59, 2173 (1999).

| Centrality bin | |||
|---|---|---|---|
| 0 - 5 | 622 41 | 347 10 | 946 146 |
| 5 - 10 | 498 31 | 293 9 | 749 116 |
| 10 - 15 | 413 25 | 248 8 | 596 93 |
| 15 - 20 | 344 21 | 211 7 | 478 75 |
| 20 - 25 | 287 18 | 177 7 | 377 61 |
| 25 - 30 | 235 16 | 146 6 | 290 47 |
| 30 - 35 | 188 14 | 122 5 | 226 38 |
| 35 - 40 | 147 12 | 99 5 | 170 30 |
| 40 - 45 | 115 11 | 82 5 | 130 24 |
| 45 - 50 | 89 9 | 68 4 | 101 19 |