Proton-deuteron elastic scattering at low energies
Abstract
We present measurements of differential cross sections and the analyzing powers , , , , and at keV. In addition, an excitation function of for keV is presented. These data are compared to calculations employing realistic nucleon-nucleon interactions, both with and without three-nucleon forces. Excellent agreement with the tensor analyzing powers and cross section is found, while the and data are found to be underpredicted by the calculations.
pacs:
13.75.Cs,21.45.+v,24.70.+s,25.40.-hI Introduction
The three-nucleon continuum is an excellent testing ground for nuclear interactions, since both precise experiments and theoretical calculations are possible [1]. Comparisons between measured three-nucleon observables and theoretical calculations provide stringent tests of the underlying nucleon-nucleon (NN) and three-nucleon (3N) interactions. Proton-deuteron elastic scattering at low energies offers two particular advantages: highly accurate experiments can be performed for a large number of observables, and theoretical calculations are simplified due to the energy being below the deuteron breakup threshold and the relatively low number of partial waves required.
Past experimental studies have focussed on the differential cross section and analyzing powers for p-d scattering at MeV, just below the deuteron breakup threshold [2, 3]. Theoretical calculations of these p-d scattering observables using realistic NN and 3N interactions are now routinely possible [4, 5]. The calculations are found to reproduce the differential cross section and tensor analyzing powers (TAPs) , , and quite well, while the vector analyzing powers (VAPs) and are underpredicted by . The available 3N forces are found to have little influence, except for the partial wave [5, 6]. The situation in neutron-deuteron scattering is similar [6, 7, 8], although only the cross section and have been measured to date at low energies. By far the most glaring difference between theory and experiment is in the VAPs, a discrepancy which has come to be known as the “ puzzle” [8]. This puzzle has been in existence for about ten years now, and the resolution is still unclear. It has been suggested that the discrepancy arises from inadequacies in the NN potential in the waves [9, 10]. Other workers have considered the role of 3N force effects [6, 8, 11]. So far, no conclusive solution to the problem has been found, although most recent attention has been focussed on the role of the 3N interaction [12, 13, 14].
It is desirable to determine these observables at energies below MeV, as the influence of higher partial waves is strongly reduced, allowing the dominant - and -waves to be investigated with greater clarity. Also, when faced with disagreement between theory and experiment, it is interesting to study the energy dependence of the discrepancy, since this may provide clues as to its origin. New data will place strong constraints on any proposed solution. There is also considerable interest in obtaining low-energy data for the determination of the p-d scattering lengths [15].
In this paper we present measurements of the differential cross section and analyzing powers , , , and . for p-d scattering at keV. These data are the first complete set of observables measured at such a low energy; previously only cross section [15, 16] and data [16] have been obtained in this energy range. We also present an energy excitation function of from keV up to 2000 keV. Some of the data presented here have appeared previously in brief publications [11, 17, 18].
II Experimental procedures
Measurements of the differential cross section and the analyzing powers , , , , and were carried out at the Triangle Universities Nuclear Laboratory (TUNL). The analyzing power was deduced from measurements of and . Achieving a center-of-mass energy of 431.3 keV requires either a 650-keV proton beam incident on a deuteron target, or a 1300-keV deuteron beam incident on a proton target (the small corrections for energy loss in the target will be discussed later). The beams, targets, and detection methods are discussed below.
A Low-energy proton beam
Beams of 650-keV protons were used for measurements of differential cross sections and . Polarized or unpolarized beams of 72-keV ions were produced by the TUNL atomic beam polarized ion source [19]. These ions were then accelerated to 450 keV by the minitandem accelerator [20]. The final energy of 650 keV for the now positive ions was achieved by the -kV bias on the 107-cm-diameter scattering chamber [21] where the measurements were performed.
Unpolarized proton beams were produced by bleeding hydrogen gas into the ionizer of the ion source. When polarized proton beams were used, a Wien filter downstream from the ion source was utilized to set the spin-quantization axis vertical in the laboratory. Two spin states were used, with polarizations . The desired hyperfine states of atomic hydrogen were cycled approximately every second. This technique minimizes the effects of slow changes in beam position, target thickness, or amplifier gain on the measured analyzing powers. Proton beam polarization was determined using the reaction in a polarimeter [22] located at the rear of the scattering chamber. The polarization was measured several times throughout the measurements at an incident proton energy of 450 keV by lowering the chamber bias voltage. The proton polarization was found to be constant within throughout the measurements; the systematic error in the proton polarization is estimated to be .
The energy calibration of the proton beam produced by the minitandem and high-voltage chamber system has been established to keV, using the 240.0- and 340.5-keV resonances in and the 405.4- and 445.8-keV resonances in . The resonance energies were taken from Ref. [23].
B Deuteron beam
Polarized beams of 72-keV ions were produced using the same atomic-beam polarized ion source [19] used for protons. The beam was injected into the TUNL FN tandem accelerator, magnetically analyzed, and then delivered to a 62-cm diameter scattering chamber.
The same Wien filter mentioned previously was used to control the spin-quantization axis on target. The spin axis was longitudinal for the measurements, normal to the reaction plane for and , and offset from longitudinal in the reaction plane for . Three deuteron beam polarization states were produced with the atomic beam polarized ion source: a maximum positive, a maximum negative, and an unpolarized state. The TAP data were obtained with and , while beams with and were used for the measurements. The spin states were also cycled approximately once every second. The beam polarization for the TAP data was determined using the reaction in an online polarimeter located behind the scattering chamber [24]. Deuteron beam vector polarization was determined online via the reaction in a different polarimeter located behind the scattering chamber. The effective for this reaction at MeV has been calibrated relative to the polarimeter at MeV. More information on the use of the reaction for deuteron vector polarimetry is available in Ref. [25]. For the measurements the polarization was very stable over time, and was monitored periodically with the polarimeter at MeV. The absolute uncertainty in all of the deuteron beam polarizations is estimated to . The unpolarized deuteron and proton beams used for the cross section measurements were produced by a direct extraction negative ion source.
C Targets
The measurements were performed by bombarding thin hydrogenated or deuterated carbon foils. The targets used for analyzing power measurements consisted of approximately and hydrogen isotope and carbon atoms/cm2, respectively. The targets used for the relative and absolute cross section measurements consisted of approximately and hydrogen isotope and carbon atoms/cm2, respectively. In order to calculate the energy loss in the targets it is necessary to know their carbon and hydrogen isotope thickness and the stopping power. The carbon content was determined by comparison with carbon foils of known thickness while the hydrogen thickness was determined either from the d-p elastic scattering cross section, or from the p-p elastic scattering cross section. For the analyzing power measurements the beam-energy loss in the targets is keV, while for the cross section measurements, the beam-energy loss was keV. In all cases the incident energy was adjusted so that the mean energy in the center of the target corresponded to keV. Here the quoted error includes the uncertainties in the incident energy and also the energy loss in the target. It should be noted that the use of thin targets is very important at low energies for minimizing energy loss and straggling effects. The differential cross section is particularly sensitive to the energy, a point which will be discussed quantitatively later in this paper.
D Detection methods
The reaction products were detected using 100-m-thick Si surface barrier detectors. Left-right symmetric detector configurations were utilized for all of the measurements. Count rates in the detectors were controlled by varying the solid angle (0.2-5 msr) and beam current (10-150 nA). In some cases, thin mylar foils (2-5 m) were placed over the detectors to either (1) increase the energy separation between proton and deuteron peaks or (2) stop heavy recoils resulting from , , or reactions. Measurements at far forward angles in the laboratory are limited by the high flux of elastic-scattered particles from carbon. For the proton-beam measurements in the high-voltage scattering chamber, detector signals were sent to ground potential via fiber-optic connections.
For the cross section, , , and measurements the elastic scattering yields were determined from the energy spectra. Sample energy spectra are shown in Figs. 1-3. It should be noted that the low-energy heavy recoils seen in Figs. 2 and 3 can be eliminated if necessary by using the aforementioned mylar foils. The primary background under the p-d elastic scattering peaks at all angles is the low-energy tail from carbon elastic scattering. Pulsers were inserted into the detector electronics to facilitate dead-time corrections, which were typically less than 5% but always less than 10%. Peak yields were extracted using linear least-squares fits to the background on either side of the peak. For the analyzing power measurements, the background subtraction and dead-time corrections were performed separately for each spin state.
A different technique was used for the VAPs and since the magnitudes of these observables are roughly a factor of 10 smaller than for the TAPs. The scattered deuterons and protons were detected in coincidence using two pairs of silicon surface barrier detectors placed at symmetric angles on either side of the incident beam. The angles of the detectors were set to observe either protons or deuterons in the more forward detectors in coincidence with deuterons or protons detected in the more backward detector on the opposite side of the beam. A major benefit of this method is that data can be acquired at a much higher rate because the events resulting from carbon elastic scattering are essentially completely eliminated. Note that a factor of 10 reduction in magnitude of the analyzing power requires a factor of 100 increase in the number of counts if the same relative statistical accuracy is desired. An additional advantage of the technique is that the background under the peak of interest is much reduced, lowering the possibility of false asymmetries resulting from the asymmetry in the background. Histograms of the time difference between the fast timing signals from each coincident pair of detectors were stored for each spin state. The time resolution for the coincident proton-deuteron peaks was ns, with backgrounds . A sample time spectrum is shown in Fig. 4. Dead-time corrections () were determined by sending test pulses to the detector preamplifiers with time delays adjusted to give distinct peaks in the time spectra. Peak yields for each spin state were extracted using linear least-squares fits to the background on either side of the peak, and were corrected for dead time. The possible influence of channel (time) dependent dead-time corrections was calculated and found to be negligible.
E Measurements
The incident beam energy was adjusted to yield keV in center of the target, except for the measurements where the incident deuteron energy varied over MeV. The beams were collimated to produce a 2 mm (horizontal) 4 mm (vertical) beamspot on the center of the target. The position for each detector was determined by measuring the elastic scattering from carbon on either side of the beam for angles near . The systematic uncertainty in the angular positioning is estimated to be . The number of incident particles was determined by beam current integration. For the analyzing power data and relative cross section data the targets were replaced approximately every 12 hours, or when the hydrogen isotope content decreased by %.
Relative cross sections were determined with a proton beam in the high-voltage scattering chamber. The measurements were performed using a movable pair of left-right symmetric detectors, and a fixed pair located out of the plane of the other detectors at . The yield of protons and deuterons from p-d elastic scattering in the fixed pair was used to normalize the yields in the movable pair.
Absolute p-d cross sections were determined relative to the proton-proton elastic scattering cross section at a nominal proton beam energy of 2600 keV. Detector pairs were placed at and where both cross sections vary smoothly with angle. These angles give d-p elastic scattering measurements at , , and . A direct extraction negative ion source was used to inject beam into the tandem accelerator for these measurements. The beam could be switched between 1300-keV deuterons to 2600-keV protons in about one minute by only adjusting two parameters: (1) the magnetic field in the bending magnet between the source and the accelerator, and (2) changing the accelerator terminal voltage. Note that the magnetic field in the analyzing magnet, which defines the beam energy, is unchanged throughout this procedure. The deuteron and proton beams were switched several times for each target, using an integrated charge of C per measurement. For these measurements accurate relative beam current integration is essential. Current was integrated from the target rod (biased to V) and a plate at the rear of the chamber (suppressed by a shroud at V). As a test of the technique, we also measured using the same procedure and elastic scattering at , where the cross sections are described to a very high accuracy by the Rutherford formula. A target consisting of Au atoms/cm2 was utilized for these measurements. The results agreed within 0.8% with the ratio expected for Rutherford scattering ( corrections due to electron screening [28] were taken into account).
III Data Analysis and Results
A Cross section measurements
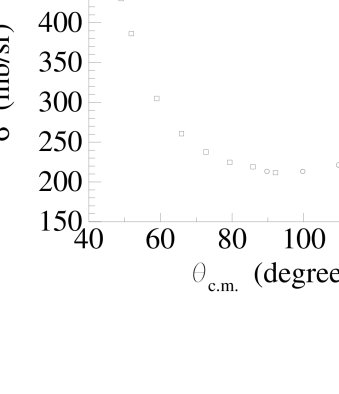
The relative cross section data as a function of center-of-mass angle are shown in Fig. 5. These data have been normalized to the absolute cross section measurements.
Absolute p-d cross sections were determined at and relative to the p-p scattering measurements at a nominal proton beam energy of 2600 keV. The p-p cross section for these energies and angles appears to be well understood. Our procedure is to utilize the Nijmegen energy-dependent partial-wave analysis [29, 30] to generate cross sections for our energy and angles. A thorough discussion of the data upon which this analysis is based is given in Ref. [31]. The p-p cross section data for MeV which are included in the Nijmegen analysis generally have absolute uncertainties and are reproduced by the fit within this error. In addition there are the p-p cross section data of Knecht, Dahl, and Messelt [32] which include measurements at keV, very close to the energy of the present experiment. The quoted experimental uncertainties vary in the range 0.1-0.3%. Although not used in the Nijmegen analysis, the Nijmegen energy-dependent fit agrees with the results of Ref. [32] at 2425 keV within 0.4% for the angles of our interest. The systematic uncertainty in the absolute p-d cross sections is estimated to be ; the contributions to this uncertainty are summarized in Table I. The assumed p-p cross sections and the p-d cross sections derived from them are given in Table II.
B Analyzing power measurements
Analyzing powers were determined from the particle yields measured for each spin state. The yields for each spin state were corrected for background and dead time, and were normalized by the number of incident particles. Tests for false asymmetries using tensor-polarized deuteron beams were carried out by measuring 197Au(d,d) scattering at under identical conditions as the p-d TAP measurements. For MeV, all of analyzing powers for 197Au(d,d) are expected to be [33]. The results were consistent with zero at the level of , the statistical uncertainty of the measurement.
For each pair of left-right symmetric detectors, the analyzing powers were determined as follows. We first define the following ratios
| (1) | |||||
| (2) |
where and are the particle yields in the left and right detector, respectively, while denotes the spin state. Then
| (3) | |||||
| (4) | |||||
| (5) | |||||
| (6) | |||||
| (7) |
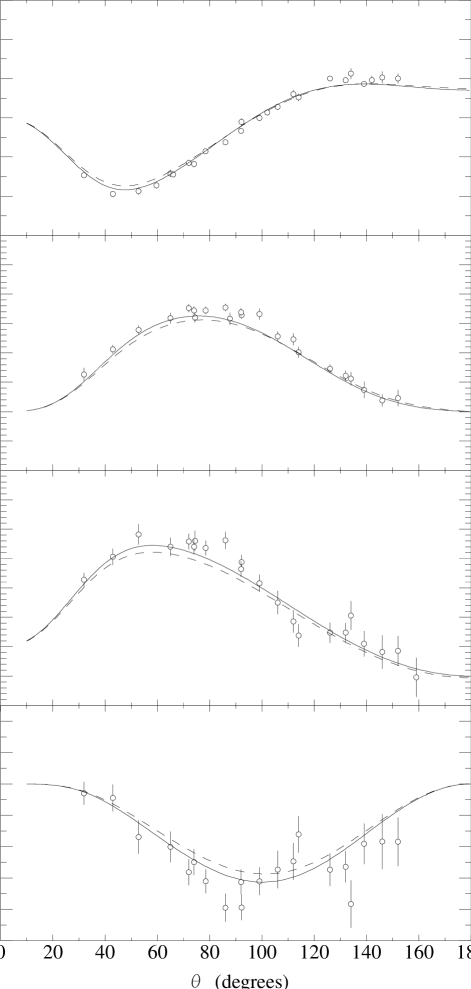
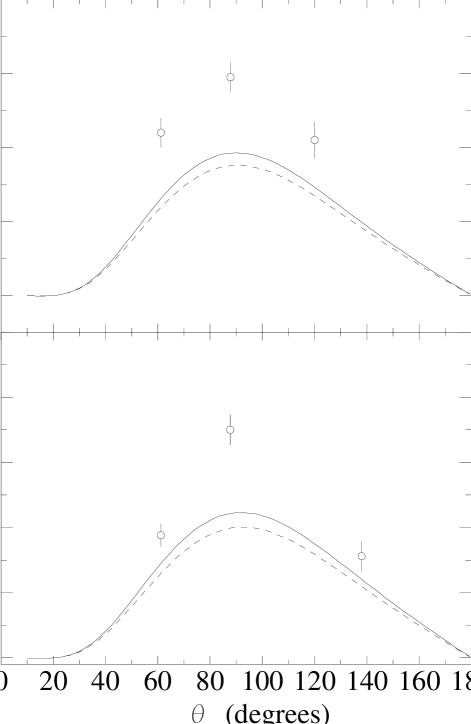
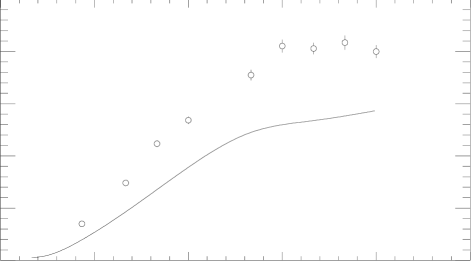
where and are the vector and tensor polarizations for spin state . It should be noted that Eqs. (5) and (6) are approximate; for the analyzing powers and polarizations encountered in this experiment the corrections are negligible. Values for the TAP were derived from and using . The analyzing power data are shown in Figs. 6 and 7. The measured excitation function is shown in Fig. 8.
IV Discussion
These experimental results are compared to calculations utilizing the Pair-Correlated Hyperspherical Harmonic basis [34] to construct the scattering wave function, and the Kohn variational principle to determine the scattering matrix elements [4]. The calculations were performed using the AV18 NN potential [35] and with AV18 plus the 3N interaction of Urbana (UR-IX) [36], and are shown in Figs. 6, 7, and 9. All of the cross sections in Fig. 9 have been divided by the cross section calculated using the AV18+UR-IX potential, so that the small differences are more apparent. The cross section measurements are seen to be in excellent agreement with the calculations using the AV18+UR-IX potential. The calculation using the AV18 potential alone differs from the measurements by 3-4%, a small but statistically-significant amount. As shown in Fig. 6, the TAP data are in reasonably good agreement with calculations using either AV18 or AV18+UR-IX. It is, however, significant to note that the AV18+UR-IX potential gives slightly better agreement for all of the TAPs.
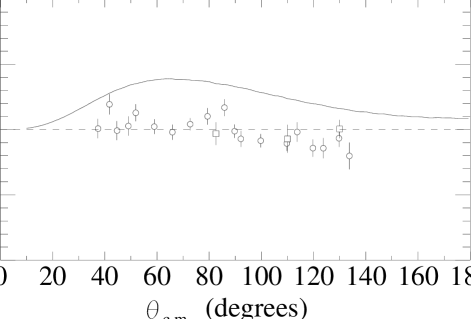
The VAP results are shown Fig. 7. As we have previously reported [11], the calculations using both the AV18 and AV18+UR-IX potentials underpredict the data by %. This discrepancy has now been observed for a wide range of energies for both and scattering. The origin of this “ puzzle” is not clear. Specific efforts to study this problem have been undertaken recently by employing new forms of 3N forces [13, 14]. Moreover in Ref. [37] a new NN interaction constructed from chiral perturbation theory has been shown to give a better description of the VAPs at low energy.
The measured energy dependence of , shown in Fig. 8, will have to be explained by any proposed solution to the puzzle. It is seen that the AV18+UR-IX potential consistently underpredicts for all energies below the deuteron breakup threshold. Although not shown, the AV18 potential calculation lies % lower than for AV18+UR-IX at these energies as well. We also note the the present measurements at and 2.00 MeV are in excellent agreement with previous data [2, 3].
The comparison between the present data and theoretical calculations at keV can be made more quantitative through the use of the parameter. For the data points the AV18 calculation yields , while the AV18+UR-IX calculation yields . The result that is much greater than one even for the AV18+UR-IX calculation is expected since there are large discrepancies for the VAPs as well as smaller but statistically-significant differences in the other observables. A more detailed discussion of comparisons and also phase-shift analysis by minimization will be the subject of another publication. Here we comment on two systematic uncertainties in the experimental data and how they affect the calculated . Considerable attention was given to the determination of the energy of the experiment, keV. In Fig. 10 we show the sizable effect on of varying the energy of the theoretical calculations with the AV18+UR-IX interaction. It is clearly important for the experimental energy to be determined as precisely as possible. We have also investigated the importance of the absolute normalization of the experimental cross sections. In Fig. 11 we show the effect on of varying the normalization of the cross section. Here is calculated for the 22 cross section points. Again very significant effects are observed.
V Conclusions
We have measured differential cross sections and the analyzing powers , , , , and at keV, as well as an excitation function of for keV. The 431.3-keV data comprise the lowest-energy complete set of cross section and analyzing power observables for nucleon-deuteron scattering. The cross section and TAPs are found to be in good agreement with calculations using the AV18 NN interaction and the Urbana-IX 3N interaction. The VAPs and are found to be underpredicted by %. At this time it is not clear whether these discrepancies result from inadequacies in the assumed NN interaction, the 3N interaction, or some other source. In this context, the very low energy data presented here represent a very stringent constraint for any new theoretical model of the nuclear interaction.
Acknowledgments
The authors would like to thank B. J. Crowe and B. M. Fisher for their assistance in the data collection process, and M.C.M. Rentmeester for supplying the Nijmegen p-p scattering predictions. This work was supported in part by the U.S. Department of Energy, Office of High Energy and Nuclear Physics, under grant No. DE-FG02-97ER41041.
REFERENCES
- [1] W. Glöckle, H. Witała, D. Hüber, H. Kamada, and J. Golak, Phys. Rep. 274, 107 (1996).
- [2] L. D. Knutson, L. O. Lamm, and J. E. McAninch, Phys. Rev. Lett. 71, 3762 (1993).
- [3] S. Shimizu, K. Sagara, H. Nakamura, K. Maeda, T. Miwa, N. Nishimori, S. Ueno, T. Nakashima, and S. Morinobu, Phys. Rev. C 52, 1193 (1995).
- [4] A. Kievsky, M. Viviani and S. Rosati, Nucl. Phys. A577, 511 (1994).
- [5] A. Kievsky, M. Viviani and S. Rosati, Phys. Rev. C 52, R15 (1995).
- [6] A. Kievsky, S. Rosati, W. Tornow and M. Viviani, Nucl. Phys. A607, 402 (1996).
- [7] J. E. McAninch, L. O. Lamm, and W. Haeberli, Phys. Rev. C 50, 589 (1994).
- [8] H. Witała, D. Hüber, and W. Glöckle, Phys. Rev. C 49, R14 (1994).
- [9] H. Witała and W. Glöckle, Nucl. Phys. A528, 48 (1991).
- [10] W. Tornow and H. Witała, Nucl. Phys. A637, 280 (1998).
- [11] C. R. Brune, W. H. Geist, H. J. Karwowski, E. J. Ludwig, K. D. Veal, M. H. Wood, A. Kievsky, S. Rosati, and M. Viviani, Phys. Lett. B 428, 13 (1998).
- [12] D. Hüber and J. L. Friar, Phys. Rev. C 58, 674 (1998).
- [13] A. Kievsky, Phys. Rev. C 60, 034001 (1999).
- [14] L. Canton and W. Shadow, nucl-th/0006070.
- [15] T. C. Black, H. J. Karwowski, E. J. Ludwig, A. Kievsky, S. Rosati, and M. Viviani, Phys. Lett. B 471, 103 (1999).
- [16] E. Huttel, W. Arnold, H. Berg, H. H. Krause, J. Ulbricht, and G. Clausnitzer, Nucl. Phys. A406,435 (1983).
- [17] A. Kievsky, M. Viviani and S. Rosati, C. R. Brune, H. J. Karwowski, E. J. Ludwig, and M. H. Wood, Phys. Lett. B 406, 292 (1997).
- [18] H. J. Karwowski, C. R. Brune, W. H. Geist, E. J. Ludwig, K. D. Veal, M. H. Wood, A. Kievsky, S. Rosati, M. Viviani, and T. C. Black, Acta Phys. Pol. B 30, 1479 (1999).
- [19] T. B. Clegg, H. J. Karwowski, S. K. Lemieux, R. W. Sayer, E. R. Crosson, W. M. Hooke, C. R. Howell H. W. Lewis, A. W. Lovette, H. J., Pfutzner, K. A. Sweeton, and W. S. Wilburn, Nucl. Instrum. Methods Phys. Res. Sect. A 357, 200 (1995).
- [20] T. C. Black, B. E. Hendrix, E. R. Crosson, K. A. Fletcher, H. J. Karwowski, and E. J. Ludwig, Nucl. Instrum. Methods Phys. Res. Sect. A 333, 239 (1993).
- [21] E. J. Ludwig, T. C. Black, C. R. Brune, W. H. Geist and H. J. Karwowski, Nucl. Instrum. Methods Phys. Res. Sect. A 388,37 (1997).
- [22] C. R. Brune, H. J. Karwowski, and E. J. Ludwig, Nucl. Instrum. Methods Phys. Res. Sect. A 389, 421 (1997).
- [23] M. Uhrmacher, K. Pampus, F. J. Bergmeister, D. Purschke, and K. P. Lieb, Nucl. Instrum. Methods Phys. Res. Sect. B 9, 234 (1985).
- [24] S. A. Tonsfeldt, T. B. Clegg, E. J. Ludwig, and J. F. Wilkerson, in: Polarization Phenomena in Nuclear Physics, Part 2 (Santa Fe, NM 1980), Eds. G. G. Ohlsen, R. E. Brown, N. Jarmie, W. W. McNaughton, and G. M. Hale (AIP, New York, 1980), p. 961; S. A. Tonsfeldt, Ph.D. thesis, University of North Carolina at Chapel Hill, 1981, available from University Microfilms, Ann Arbor, MI 48106.
- [25] M. H. Wood, Ph.D. thesis, University of North Carolina at Chapel Hill, 2000, available from University Microfilms, Ann Arbor, MI 48106.
- [26] R. E. White, P. H. Barker, and D. M. J. Lovelock, Metrologica 21, 193 (1985).
- [27] J. B. Marion, Rev. Mod. Phys 38, 660 (1966).
- [28] E. Huttel, W. Arnold, H. Baumgart, and G. Clausnitzer, Nucl. Instrum. Methods Phys. Res. Sect. B 12, 193 (1985).
- [29] V. G. J. Stoks, R. A. M. Klomp, M. C. M. Rentmeester, and J. J. de Swart, Phys. Rev. C 48, 792 (1993).
- [30] M. C. M. Rentmeester and J. J. de Swart, preliminary Nijmegen proton-proton PWA97 (private communiation).
- [31] J. R. Bergervoet, P. C. van Campen, W. A. van der Sanden, and J. J. de Swart, Phys. Rev. C 38, 15 (1988).
- [32] D. J. Knecht, P. F. Dahl, and S. Messelt, Phys. Rev. 148, 1031 (1966).
- [33] J. E. Kammeraad and L. D. Knutson, Nucl. Phys. A435, 502 (1985).
- [34] A. Kievsky, M. Viviani and S. Rosati, Nucl. Phys. A551, 241 (1993).
- [35] R. B. Wiringa, V. G. J. Stoks and R. Schiavilla, Phys. Rev. C 51, 38 (1995).
- [36] B. S. Pudliner, V. R. Pandharipande, J. Carlson and R. B. Wiringa, Phys. Rev. Lett. 74, 4396 (1995)
- [37] E. Epelbaum, H. Kamada, A. Nogga, H. Witała, W. Glöckle and U.-G. Meißner, nuclth/0007057.


| source | error |
|---|---|
| p-p cross section | 0.5% |
| target uniformity | 0.5% |
| beam-current integration | 0.8% |
| total | 1.1% |
| p(p,p) | p(d,d) | p(d,p) | |
|---|---|---|---|
| (mb/sr) | (mb/sr) | (mb/sr) | |
| 518.9 | |||
| 493.4 | - |