Meson Production in p+d Reactions
1 Introduction
The deuteron is a loosely bound system with large distance between the two nucleons. It seems therefore a good testing ground for the impulse approximation. In addition, its wave function as well as those of the produced light nuclei are believed to be well known and one can hope that a theoretical treatment in the three nucleon sector might be possible. The theoretical attempts in have not been particular successful although a lot of effort was devoted to this subject over the years [1]. Similarly, the data base is by far not complete and sometimes contradictory. We have, therefore, measured the reactions in the region of the N*(1535) resonance and the reactions and below and in the range of the resonance.
2 Experiments
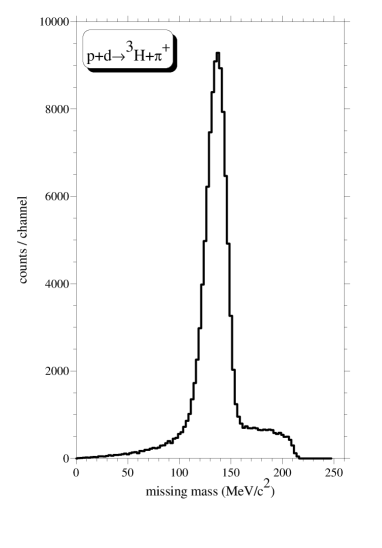
The proton beams were extracted from the cooler– synchrotron COSY in Jülich. Although the beam was not cooled it had typically emittance of in all directions. The detector used is a stack of diodes made from high purity Germanium. The diodes have structures on the front side as well as on the rear side allowing track reconstruction, energy measurement and particle identification. With this detector call Germanium Wall Ref. [2] we measured the heavy recoils. Together with conservation laws the four momentum vectors of the unobserved mesons could be extracted. Recoils being emitted under zero degree in the laboratory were measured with the magnetic spectrograph BIG KARL. Both detector elements together form the GEM detector. In Fig. 2 the missing mass spectrum for charged pions from the reaction at 850 MeV/c is shown. Two things are worth mentioning: the high statistics in the experiment and the small background.
3 Results
3.1 Production
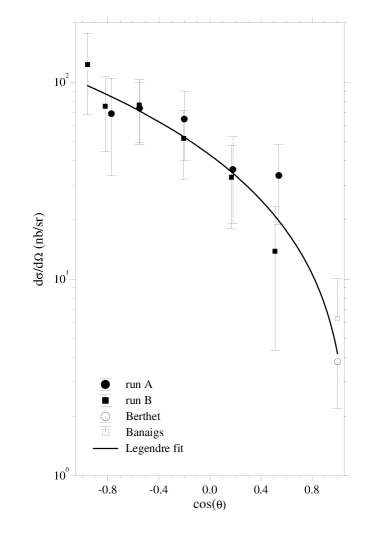
For the -production we obtained an angular distribution [3] which is dominated by p-wave (see Fig. 2) in contrast to near threshold, where the angular distributions are s-wave dominated. A Legendre polynomial of second order was found to account for the data. From this fit a total cross section of was deduced. This result is close to the one obtained by Banaigs et al. [4] at a slightly higher energy. All cross section from threshold up to could be nicely accounted by a simple calculation. This energy region corresponds to the centre of the resonance ( 200 MeV) known to couple strongly to the – channel [6]. One may therefore attempt to describe the cross section by an intermediate (1535) resonance excitation:
| (1) |
with the excitation energy and the matrix element which is calculated as in photoproduction on the proton [7] as Breit–Wigner form with an energy dependent width. All parameters were taken from Ref.’s [7] and [6]. The only free parameter is the strength fitted to the present data point. The trend of the data is reproduced, which may be taken as an indication that production of the (1535) resonance is the dominant reaction mechanism and that the product of kinematics and form factor changes only very little over the present energy range. Deviations occur near threshold which might be an indication of strong final state interactions.
3.2 Production
For the -production the situation for the angular distributions very close to threshold is similar: they are isotropic. For higher beam momenta the angular distribution becomes again backward peaked for the heavy recoil. For a beam of 750 MeV/c it has an almost exponential slope. For higher momenta an isotropic component shows up with increasing importance with increasing beam momentum. As examples the angular distributions for charged pion production at 850 MeV/c and neutral pion production at 1050 MeV/c are shown in Fig.’s 4 and 4, respectively. One point measured at which corresponds to zero degree in the laboratory was measured with the magnetic spectrograph BIG KARL.
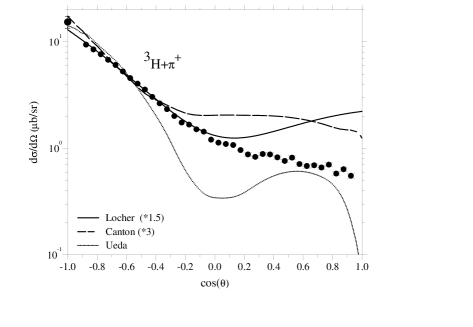
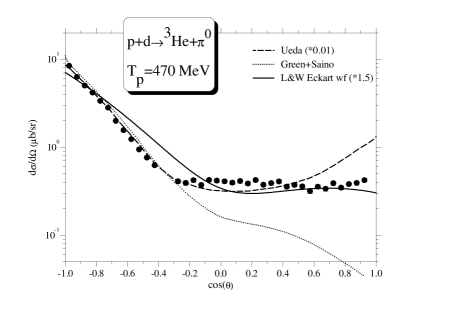
As examples the data are compared with several model calculations also shown in Fig.’s 4 and 4. Here, we restrict ourselves to comparisons with published calculations for beam momenta close to the present ones or perform such calculations in the very transparent Locher–Weber model [8]. The differential cross section in this model is given by
| (2) |
with , a spin factor, a kinematical factor, and , the direct form factor and , the exchange form factor, i.e. an elastic scattering after pion emission from the incident proton. The graph corresponding to is treated by most calculations. The form factors were evaluated with emphasis on the short range–components of the deuteron and the triton. This is achieved by fitting the free parameters in a Hulthén function to the deuteron–charge form factor and similarly for tritium, the parameters for the Eckart function and the 3-pole function to the tritium–charge form factor. Also other functional dependencies taken from the work of Fearing [9] were tried applying the same normalization as in the work of Locher and Weber [8]. All calculations need normalization factors when compared to the data. Best results were obtained for the Eckart wave function and an exponential (see Fig.’s 4 and 4). We also compare the data with calculations from Ueda [10]. The normalization factor is 0.01. For details we refer to the original work. The local minimum at for 850 MeV/c as well as the strong rise at forward angles for 1050 MeV/c is not supported by the data. This range is rarely reproduced by a calculation. Green and Saino [11] even claim their calculations to be unreliable in this range. The large and almost exponential shaped component may be attributed to the direct production graph. Therefore, new physics may be hidden in the small more isotropic component.
References
- [1] L. Canton, G. Cattapan, G. Pisent, W. Schadow, J. P. Svenne, Phys. Rev. C 57 (1998) 1588; L. Canton and W. Schadow, Phys. Rev: C 56 (1997) 1231
- [2] M. Bettigeri et al., Nucl. Instrum. Methods Phys. Res. A421, 447 (1999).
- [3] M. Bettigeri et al., Phys. Lett. B472, 267 (2000).
- [4] J. Banaigs et al., Phys. lett. B45, 394 (1973).
- [5] P. Berthet et al., Nucl. Phys. C443, 589 (1985).
- [6] Particle Data Group: C. Caso etal., The European Phys. J. 3 (1999) 1.
- [7] B. Krusche, Acta Phys. Polonica 27B (1996) 3147.
- [8] M. P. Locher and H. J. Weber, Nucl. Phys. B76, 400 (1974).
- [9] H. W. Fearing, Phys. Rev. C 16 (1977) 313.
- [10] T. Ueda, Nucl. Phys. A505, 610 (1974).
- [11] A. M. Green and M. E. Sainio, Nucl. Phys. A 329 (1979) 477.