Multifragmentation of a very heavy nuclear system (II): bulk properties and spinodal decomposition
Abstract
The properties of fragments and light charged particles emitted in multifragmentation of single sources formed in central 36 A.MeV Gd+U collisions are reviewed. Most of the products are isotropically distributed in the reaction c.m. Fragment kinetic energies reveal the onset of radial collective energy. A bulk effect is experimentally evidenced from the similarity of the charge distribution with that from the lighter 32 A.MeV Xe+Sn system. Spinodal decomposition of finite nuclear matter exhibits the same property in simulated central collisions for the two systems, and appears therefore as a possible mechanism at the origin of multifragmentation in this incident energy domain.
keywords:
NUCLEAR REACTIONS natU(155Gd,X), E=36 A.MeV, natSn(129Xe,X), E= 32 A.MeV; selected central collisions(“fusion” reactions); measured charged products energies, charge and yields with a array; deduced radial expansion energy; system-mass scaling; comparison to stochastic mean-field model., , , , , , , , , , , , , , , , , , , , , , , , , , , , , , , , , , , , , , , , , , , , , , ,
Permanent address: GANIL, B.P. 5027, F-14076 Caen Cedex, France.
E-mail: frankland@ganil.fr. Tel.: 33 231 454628. Fax: 33 231 454665††thanks: present address: DRFC/STEP, CEA/Cadarache, F-13018 Saint-Paul-lez-Durance Cedex, France.
PACS: 25.70.-z, 25.70.Pq, 24.60.Ky
1 Introduction
The decay of highly excited and possibly compressed nuclear systems through multifragmentation (complete disassembly into several lighter nuclei in a short time scale) is, at present time, a subject of great interest in nucleus-nucleus collisions. While this process has been observed for many years, its experimental knowledge was strongly improved only recently with the advent of powerful devices; the major experimental problem comes from the difficulty to unambiguously select and well define the relevant system or subsystem. Part I of the present work fully illustrates this fact when selecting fused systems formed in collisions between very heavy nuclei [1].
Our goal in studying multifragmentation of very heavy systems, which can be considered as well defined pieces of nuclear matter, was to seek out bulk properties which could be compared to models in which bulk or volume instabilities are present.
Many theories have been developed to explain multifragmentation (see for example ref. [2] for a general review of models). In particular one can arrive at the concept of multifragmentation by considering a phase transition of excited nuclear matter. This first phase transition is of liquid-gas type due to the specific form of the nucleon-nucleon interaction, which is characterized by attraction at long and intermediate range and repulsion at short range. It is possible that, during a collision between two nuclei, a wide zone of the nuclear matter phase diagram may be explored, including the liquid-gas phase coexistence region and even more precisely the spinodal region (domain of negative incompressibility and of mechanical instability of uniform matter) where multifragmentation can occur through the growth of density fluctuations [3].
Among the existing models of multifragmentation some are related to statistical approaches based either on multi-body phase space calculations [4, 5, 6, 7] or on fast sequential binary decays [8], whereas others try to describe the dynamic evolution of systems resulting from collisions between two nuclei. In the present case, semi-classical simulations based on the nuclear Boltzmann equation, which describe the time evolution of the one-body density, are appropriate during the early phase of the collisions but become inadequate when instabilities occur. A quantum-mechanical description including N-body correlations is not yet feasible, thus dynamic scenarios taking into account the dynamics of the phase transition are simulated, with different approximations, via molecular dynamics [9, 10, 11, 12, 13] or stochastic mean field approaches [14, 15, 16].
It is this last approach which has been used for a comparison with our experimental observables. In simulations, spinodal decomposition of hot and dilute finite nuclear systems is mimicked through a powerful tool, the Brownian One-Body (BOB) dynamics [17, 18, 19]. The BOB dynamics reintroduces approximately N-body correlation effects (i.e. fluctuations) by means of a brownian force in the mean field. The magnitude of the force is adjusted to produce the same r.m.s. fluctuation amplitude as the full Boltzmann-Langevin theory for the most unstable modes in nuclear matter prepared at the corresponding density and temperature [20].
The paper is organized as follows : the experimental results concerning selected multifragmenting fused events from 36 A.MeV + collisions are presented in section 2; the dynamical properties of fragments and their connection with an eventual expansion energy are discussed in section 3; in section 4 a bulk effect is brought to light by comparison of experimental fragment charge and multiplicity distributions with results from a lighter system. Section 5 is devoted to a presentation of the dynamical simulations and their confrontation with the experimental data. A summary is given in section 6.
2 Characteristics of single-source events
Single-source events, for which very heavy fused systems are formed from the majority of nucleons of a heavy projectile and target, have been isolated among very well measured 36 A.MeV + collisions (see Part I). Multifragmentation of these sources comprising more than 350 nucleons leads to fragments with charges up to 60. For such heavy reaction products recombination effects in solid state detectors (silicon detectors and CsI(Tl) scintillators) are important, and thus a great effort was recently made to obtain more accurate energy calibrations (globally within 6% over the whole detection angular range) and Z identification procedures (see Part I) [21, 22].
Before presenting in detail the characteristics of the isolated fused systems, let us first recall very briefly what we learned in Part I (Section 4). Single-source events are selected by imposing the condition 120 (0.77) for charge completeness, and through a global shape variable, namely the polar angle , calculated from the emission properties of fragments (the detection of at least three fragments with Z5 was required). From the forward-backward symmetry of reaction product Z-distributions observed in these selected events, we can infer that the single-source has nearly the centre of mass velocity. In this section we will first present and discuss observables related to fragments. Then properties of light charged particles (LCP) associated to these events, which do not enter the chosen selection, will be presented and used to derive an estimate of the characteristics (size and excitation energy) of the source.

2.1 Fragment emission properties
Figure 1a) shows, in the reaction centre of mass frame, the angular distribution of emitted fragments. It is isotropic, except at large angles ( ) where detection and identification thresholds come into play. On figures 1b) and c) are displayed the evolution of fragment properties (average Z and average kinetic energy) with respect to their emission angle in the centre of mass; these average values are constant within 15%; The slight increase around 90o probably comes from the selection of events ( - see Part I)).
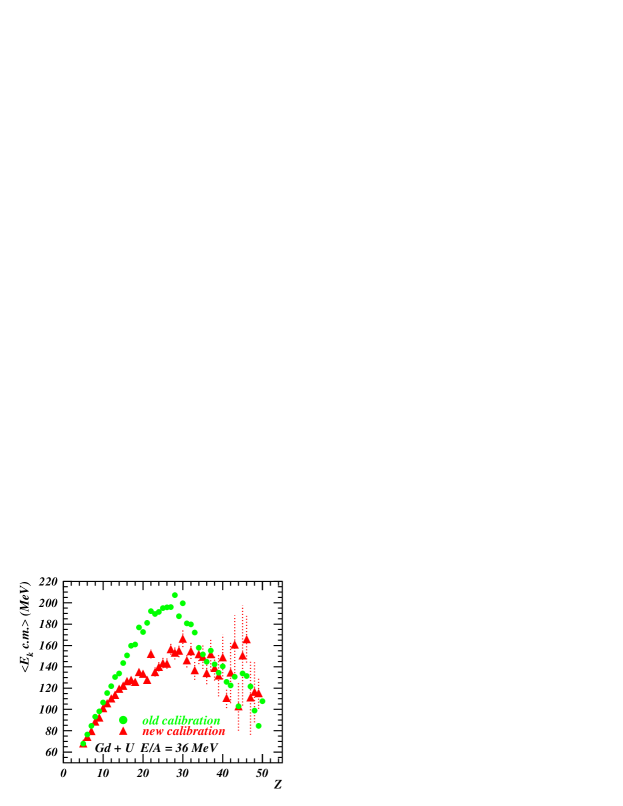
Figure 2 shows the evolution of the average kinetic energy of fragments versus their atomic number. The energy first increases with Z, up to 150 MeV at Z30. Then it levels off, or slightly decreases. In the same figure are also reported previously published data [23] which did not take into account recent improvements in the energy calibration of the backward CsI(Tl) scintillators of INDRA [22]; differences are essentially observed for intermediate charges, Z=15-30. This correlation between kinetic energy and Z of fragments is of particular interest and will be discussed later on in the paper: it can indeed permit the extraction of qualitative information about fragment emission (sequential or simultaneous), and quantitative information related to radial expansion energy (section 3). Consequently it puts strong constraints on theoretical models (section 5).
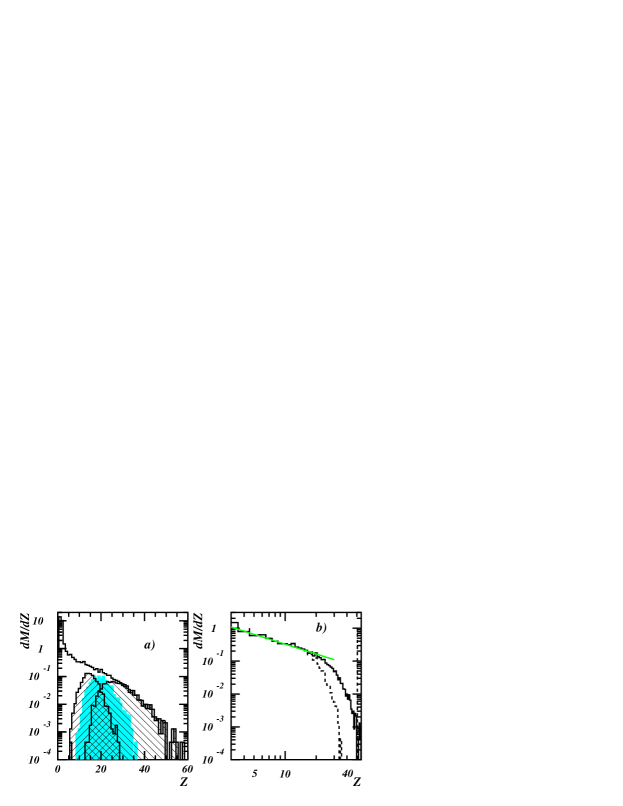
The differential multiplicity as a function of the atomic number of the detected charged reaction products is presented in figure 3a. It extends up to Z55, which corresponds to a third of the total charge of the system. The contributions to the distribution of the three heaviest fragments of each partition are also displayed in the figure, showing that only the heaviest one populates the region Z=35-60. In figure 3b the distribution for fragments is plotted in a double logarithmic scale; a power law dependence in of the differential multiplicity becomes evident in the range Z=5-20, with close to 1.0. Finite size effects break this law for higher charges, and the heaviest fragment is completely excluded from this dependence. Note that such a behaviour is predicted by simulating the explosion of hot drops of classical fluid in the spinodal region, but with a somewhat higher exponent [24].

The distribution of the total charge emitted in fragments (Zbound) is displayed in Figure 4; on average, more than half of the total charge of the system is bound in fragments. Finally Table 1 summarizes some average measured quantities related to fragments emitted by the single source (the different multiplicity distributions associated to single-source events have been presented in Fig. 10 of the accompanying paper).
| 33.2 | 24.5 | 6.3 | 86.5 | 14.2 | 26.9 | 18.8 | 14.0 |
2.2 Coincident LCP and estimates of average size and excitation energy of the source
LCP are emitted at different stages during the collisions. First “direct” pre-equilibrium emission occurs which partially keeps a memory of the entrance channel mass asymmetry [25]. Then particles are emitted before and during the formation of fragments from a source which may be in thermal equilibrium. Finally in the late stages statistical evaporation from hot fragments takes place. Experimentally we measure the sum of all these contributions and, without having recourse to correlation functions [26], only deviations from isotropy in the centre of mass can be used to give complementary information about the source.
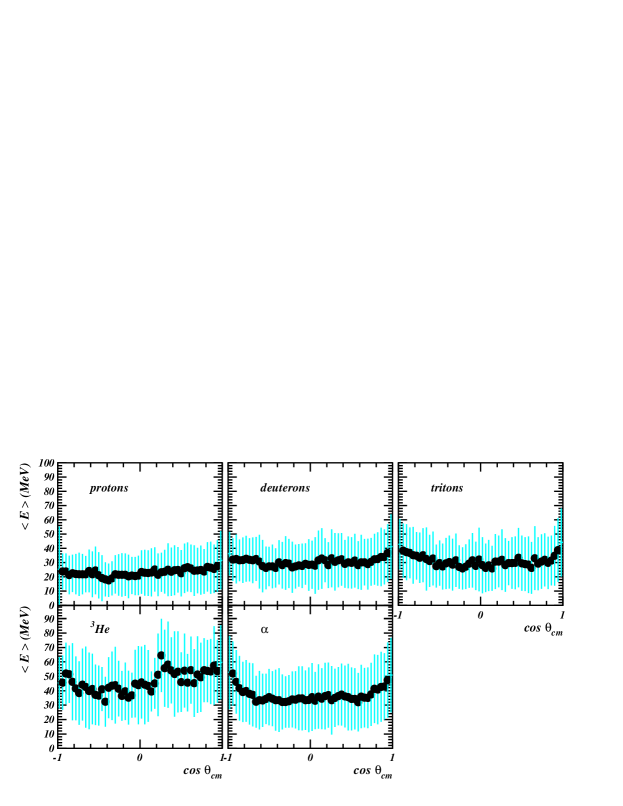
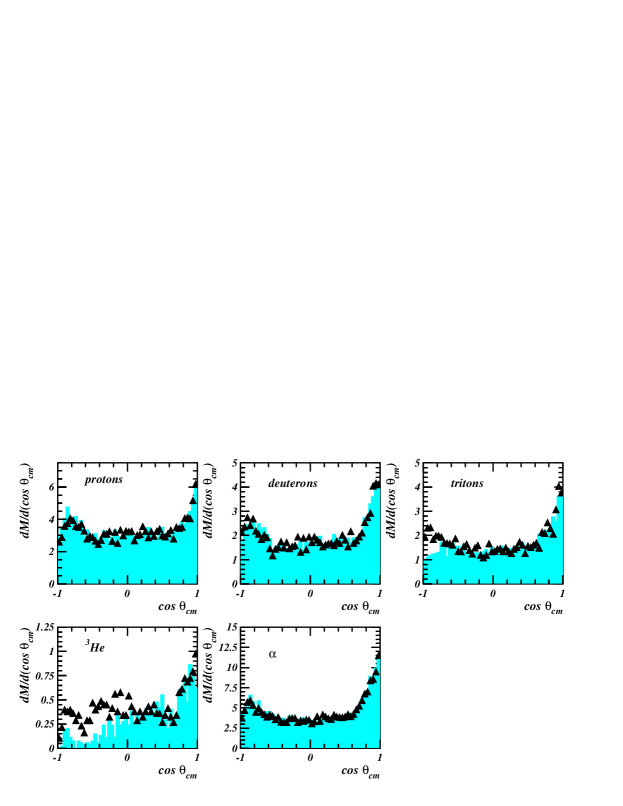
The angular distributions of LCP and their associated average kinetic energy as a function of the centre of mass angle are displayed in figures 5 and 6. Deuterons, tritons and suffer from isotopic identification thresholds; their contributions at low laboratory kinetic energies were estimated from the measured H and He by linearly extrapolating isotope ratios (d/H, t/H, 3He/He) measured as a function of the particle laboratory kinetic energy and angle. Corrected values correspond to triangles in figure 5. The angular distributions for all LCP are very similar, being flat between 60∘ and 120∘, and presenting forward and backward peaks, the latter being lower (even if detection thresholds would be accounted for). Angular momentum effects would lead to angular distributions symmetric with respect to 90∘, and unrealistically large values of spin would be required to explain the measured anisotropy for protons between 0∘ and 90∘ for instance. Other arguments against a very high angular momentum of the emitter will be given in section 3. Consequently we consider that two contributions are superimposed: a forward-backward direct component (the forward-backward asymmetry arising from the asymmetry of the incident nuclei [25]) and an isotropic one which dominates in the angular range 60∘-120∘. A maximum estimate of the isotropic contribution coming from the single-source is obtained by doubling the multiplicities measured in this angular range. Its characteristics are summarised in Table 2. The relative abundances of the heavy hydrogen isotopes are higher than those currently observed for evaporated particles (Mt/M0.1); this indicates that particle emission becomes isotropic rather early in the collision process, and more particularly well before hot and well-separated fragments deexcite through evaporation.
| 6.0 | 3.4 | 2.8 | 0.8 | 7.3 | |
| (MeV) | 22.0 | 29.5 | 29.0 | 46.1 | 34.4 |
| (MeV) | 12.82 | 15.54 | 14.68 | 19.83 | 15.77 |
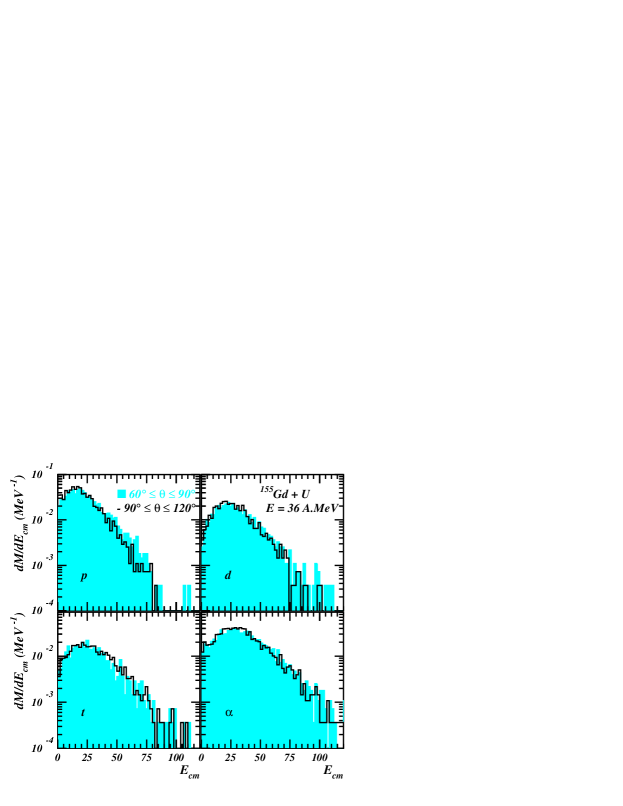
Energy spectra of isotropic LCP emitted in the range 60∘-90∘ and 90∘-120∘ in the centre of mass are presented in Figure 7. These spectra are, as expected, identical for the two defined angular ranges. However they cannot be fitted by any statistical formula (surface or volume emission). This fact suggests again that these spectra result from emissions at different stages of the reaction, preventing us from inferring any information relative to the source temperature. However we can characterize the isotropic emissions by average quantities (multiplicity and kinetic energy) and slope parameters determined from the high-energy exponential fall-off of the spectra (Table 2). The hierarchy of the average lcp energies is a general feature of central collisions between very heavy ions: d and t have equal average energies and slope parameters, much higher than the corresponding proton quantities, and closer to that for ’s; the average energy is in turn spectacularly higher than the energy [27]. The same features are observed in the INDRA Xe+Sn data between 32 and 50 A.MeV, and in the FOPI Au+Au data between 150 and 250 A.MeV [28]. A possible interpretation would be that d,t and mostly arise from the multifragmentation stage, while p and are in addition abundantly evaporated by colder and colder fragments, thus lowering drastically their global average energy.
The characteristics of the direct (anisotropic) emission were estimated by subtracting the isotropic contribution determined above from the total distributions. Average values for multiplicities and energies of direct particles are reported in Table 3; the indicated neutron multiplicity, was deduced by assuming that the anisotropic emission keeps the N/Z of the total system. Neutron energy was derived from proton energy by subtracting a Coulomb barrier.
| 3.16 | 0.60 | 0.64 | 0.68 | - | 2.0 | |
| (MeV) | 23.0 | 37.7 | 39.0 | 38.6 | - | 49.5 |
The detection efficiency of INDRA for LCP being excellent (90% of ), we relied on the LCP rather than on the measured fragments to estimate the single source characteristics: upper limits for the charge, mass and excitation energy of the single source were derived by subtracting the quantities removed by direct particles (without any efficiency correction) (Table 3) from the corresponding values for the total system. The average mass and charge of the source are then , , which corresponds to 96% of the total system. Its average excitation energy is 6.5 MeV per nucleon to be compared with the 7.1 MeV available for the composite system in the centre of mass.
3 Properties of the single-source: sequential decay or simultaneous break-up? Expansion energy
Properties of multifragment systems are frequently derived from comparison with statistical models. The aim is to determine whether thermodynamical equilibrium has been reached at some stage of the collision, through the ensemble of partitions experimentally observed. These models are purely static, in the sense that they describe the system at a freeze-out instant, defined as the time where the nuclear interaction between the fragments vanishes. Fragment kinetic energy only comes from their mutual Coulomb repulsion and thermal motion. Any deviation of the measured kinetic energy from the predicted values is then attributed to some extra collective energy, such as expansion energy, or rotational energy. For instance a self-similar expansion, decoupled from thermal motion, is generally added in order to reproduce the measured kinetic energies. The values of collective energy so derived are however obviously dependent on the Coulomb energy, or in other words on the volume assumed at freeze-out [29, 30]. The Statistical Model for Multifragmentation (SMM [5]), and the Microcanonical Metropolis Monte-Carlo model (MMMC [4]) are widely used, for their correct statistical weighting of partitions. The SIMON event generator [30] is chosen here for two reasons. Firstly its highly simplified algorithm for generating partitions reasonably accounts for the measured charge and multiplicity distributions. Secondly, and above all SIMON has the advantage over the models cited above to permit a rigorous treatment of space-time correlations between all fragments and emitted particles.
In SIMON, the inputs are: the mass, charge and available energy of the system; the number and spatial configuration of the primary fragments and eventually their minimum mass; the radial expansion energy at the rms radius. The hot fragments are then propagated while deexciting (through the transition state formalism in the present case). Statistical deexcitation of a hot “compound” nucleus can also be followed, by setting to 1 the number of primary fragments. An additional physical feature was recently included in this code, namely a variation of the level density with the excitation energy: the level density is indeed expected to vanish at high excitation [31]. This is equivalent to excluding from the primary partitions levels with too short life-times. The formalism adopted here is that proposed in [32], where the level density at energy is expressed as the Fermi gas level density modified by a modulation factor.
| (1) |
This corresponds to having an effective intrinsic nuclear temperature:
| (2) |
Therefore the available thermal energy of the system, after removing Coulomb and collective parts, is shared between kinetic and intrinsic excitation energy of the fragments, following the equation:
| (3) |
being the level density parameter at zero temperature (taken here as =A/10).
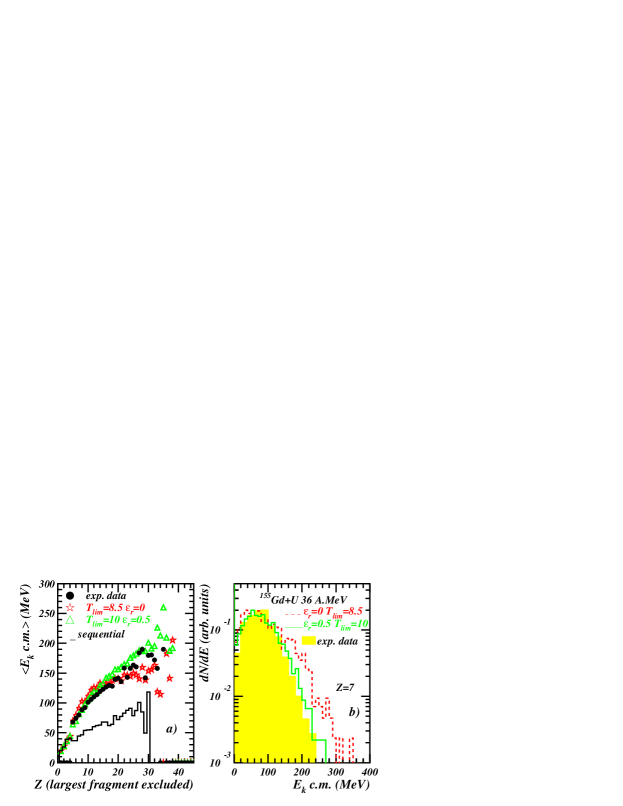
The initial system was chosen as that defined in section 2.2, after removing direct particles. A first simulation was performed to test the assumption of sequential deexcitation of the hot source as the origin of fragment emission. Indeed a modified sequential scenario based on the Expanding Emitting Source model was shown to account for some features of the system considered here [33]. With the SIMON simulation, the calculated charge distribution does not extend to large enough values, and the fragment kinetic energies are largely underestimated, as appears in Fig 8a. In the following simulations, multifragmentation of the initial system in 6 primary fragments, with a minimum mass of 20, was assumed. Indeed, when only looking at kinematic variables, the hypotheses of light fragments and particles being produced in the explosion process itself, or evaporated by very hot and spatially close fragments, are expected to give nearly identical results. No angular momentum was considered as it was found that, for this very heavy system, an initial value of 500 (corresponding to b = 4 fm) would increase by less than 5 MeV the final fragment kinetic energy [34]. In the two simulations shown in Fig 8, it was verified that the calculated multiplicity and charge distributions reasonably account for the experimental ones, without attempting a perfect fit. The temperature and the collective energy were thus determined by adjusting the calculated fragment kinetic energies on the experimental data. may be expected to lie between 5 and 12 MeV: 5 MeV is the temperature obtained from most data based on excited state population ratios, and also from a correlation study between particles and fragments for single sources formed in 50 A.MeV Xe+Sn collisions [26]. 12 MeV is the maximum nuclear temperature predicted for nuclei when considered as liquid drops in equilibrium with their vapor [35]. Without collective energy, the derived value of is equal to 8.5 MeV; in this case the experimental variation of the fragment kinetic energy (including the largest one) with their charge is almost perfectly reproduced, independently of how the fragments are initially sitting in space. As soon as expansion energy comes into play, selected initial spatial configurations must be chosen, with the heaviest fragment close to the centre of gravity, in order to follow the experimental saturation of the kinetic energy at high Z (see Fig 2). The rising part of the curve E(Z) is however independent of the spatial configuration, and a way to avoid a configuration choice is to consider all fragments but the largest, as in Fig 8a. An equally good reproduction of experimental data is obtained with =10 MeV and = 0.5 A.MeV; the initial excitation energy of the fragments in this case is 4.9 A.MeV. The maximum collective energy compatible with the data is 1 A.MeV if is increased to 12 MeV. Fragment spectra were then scrutinized, in order to choose between the hypotheses with 0 or 0.5 A.MeV expansion energy. In Fig 8b is shown the experimental spectrum for Z=7, and the calculated spectra with and without expansion energy. Clearly the hypothesis with expansion energy is the best, the option = 0 leading to a too broad spectrum. Note that the discrimination between the two assumptions can only be made for light fragments (Z10), as for charges Z=12-20 the two calculated spectra are almost superimposable.
In conclusion of this section, the comparison of measured fragment kinetic energies with a simultaneous break-up scenario reveals the need for a radial collective motion at the freeze-out whose energy is = 0.5 0.5 A.MeV. This indicates that expansion energy begins to appear for central collisions between very heavy ions around 30 A.MeV, as also found for a similar system [29]. The origin of this expansion (compression, thermal pressure?) will be discussed in section 5, with the help of dynamical simulations.
4 Experimental evidence for a bulk effect: the fragment charge distribution is independent of the charge of the total system.
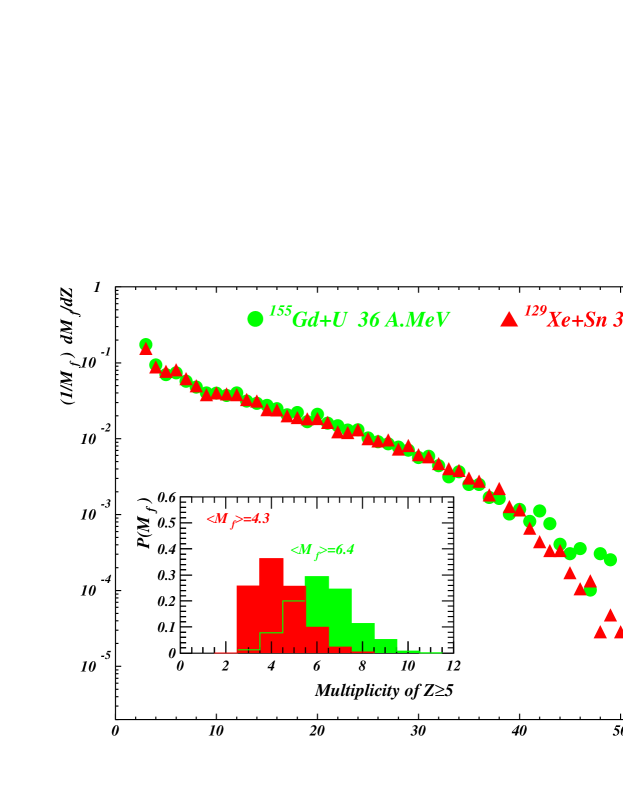
+ reactions between 25 and 50 A.MeV were also studied with the INDRA array [23, 36, 37, 38, 39]. From 32 A.MeV up, compact single source events could be isolated with the same flow angle selection as explained in the accompanying paper. At 32 A.MeV [23], the available excitation energy per nucleon for the total system is the same as for the + system studied in the previous sections. An experimental effect, observed for the first time, stands out for single-source multifragmentation events from these two systems (Fig 9): the charge distributions (normalised by the average multiplicity of Z3) superimpose over 3 orders of magnitude while the average fragment multiplicities are in the ratio 1.49, i.e. almost exactly the ratio of the total charges of the systems 156/104. Such a peculiar behaviour may reveal that bulk effects play a major role in the multifragmentation of these systems. Note that the same Z distribution is also observed in ref. [29] for the 35 A.MeV Au+Au system, which has a total charge close to + .
As shown in section 3, the kinematical properties of single-source events are compatible with the assumption that, at some instant of the collision a freeze-out configuration is reached, i.e. the system can be described as an ensemble of (hot) charged products and neutrons in thermodynamical equilibrium, free from mutual nuclear interaction. This implies that the total system at this instant occupies a much larger volume than would a nucleus with the same mass, or in other words that it has reached a low (though inhomogeneous) density state. Statistical models like MMMC, SMM do predict that two systems with the same thermal energy (temperature) will, on average, break up into a number of fragments proportional to their mass, with the same fragment charge distributions [40]. In these models the charge (mass) of the largest fragment essentially reflects the excitation energy; indeed the measured average charges of these fragments only differ by 7% for the two systems studied in this section, 32 A.MeV + and 36 A.MeV + (Fig 12).
The dilute systems considered in the statistical models have, in the experiments, been produced through violent nuclear collisions, and have lived quite a long history before reaching this stage. How such a low density state is attained should bring information on the role of fundamental properties of nuclear matter such as incompressibility, viscosity …For similar systems of colliding heavy ions, some transport models for instance predict that in central collisions below 50 A.MeV, an irreversible evolution towards low density is obtained after a compression phase if the incompressibility parameter of nuclear matter is close to 220 MeV; conversely for larger K∞ the system is less strongly compressed and returns to normal density [41]. In other calculations however, multifragmentation in central Pb+Au collisions appeared to be driven by neutron/proton asymmetry rather than by the softness or stiffness of the equation of state [42].
Instabilities of different kinds (volume, surface …) which are dynamically generated in the course of the collision may be suspected of causing the break-up of the system [2]. For the heavy systems considered here ( 250 and 400 nucleons), bulk instabilities may particularly be expected.
5 Comparison with a stochastic mean-field model
The family of dynamical simulations of nuclear collisions based on the nuclear Boltzmann equation, the Landau-Vlasov (LV), Boltzmann-Uehling-Uhlenbeck (BUU) or Boltzmann-Nordheim-Vlasov (BNV) codes, were very successful in accounting for a variety of experimental findings [43, 44, 45, 46, 47, 48]. However, as they follow the time evolution of the one-body density, neglecting higher than binary correlations, they ignore fluctuations about the mean trajectory of the system, which becomes a severe drawback if the system happens to explore regions of instability such as the spinodal zone, for instance. Indeed, in the presence of instabilities, local density fluctuations are propagated and amplified by the mean-field leading to a multi-fragment breakup of the system. This is the so-called spinodal decomposition scenario for multifragmentation. The spinodal decomposition described in ref. [18], predicts a “primitive” break-up into fragments with a favoured size, connected to the wave lengths of the most unstable modes in nuclear matter. These wave lengths are roughly constant as long as the systems are large enough. Therefore break-up into equal-sized fragments is expected, with a multiplicity growing with the mass of the system. This very simple picture is in reality blurred by several effects: the beating of different modes, the coalescence of fragments while the nuclear force still acts and the finite size of the system will tend to end-up with a broad, exponentially falling distribution of fragment charges. Therefore it first appeared easier to determine whether spinodal decomposition would predict, for two different systems, the effect described in section 4 rather than to look directly for a trace of spinodal properties in a single system.
Let us now come in more detail to the predictions of stochastic mean-field simulations of nucleus-nucleus collisions, based on the Boltzmann-Langevin (BL) equation, which allows for the treatment of unstable systems. Since the application of the BL theory to 3D nuclear collisions is still too computer demanding for calculating realistic scenarios and for quantitative results, methods allowing to simulate approximately the dynamical path followed by nuclear systems crossing the spinodal region were developed. They consist of a “Boltzmann evolution” starting from an inhomogeneous initial system [18, 49] (Stochastic Initialisation Method: SIM) or complemented by a brownian force [17, 19] (Brownian One-Body Dynamics: BOB). In either case the amplitude of the initial density fluctuations or the magnitude of the stochastic force is chosen to reproduce the dynamics of the most unstable modes for infinite nuclear matter in the spinodal region.
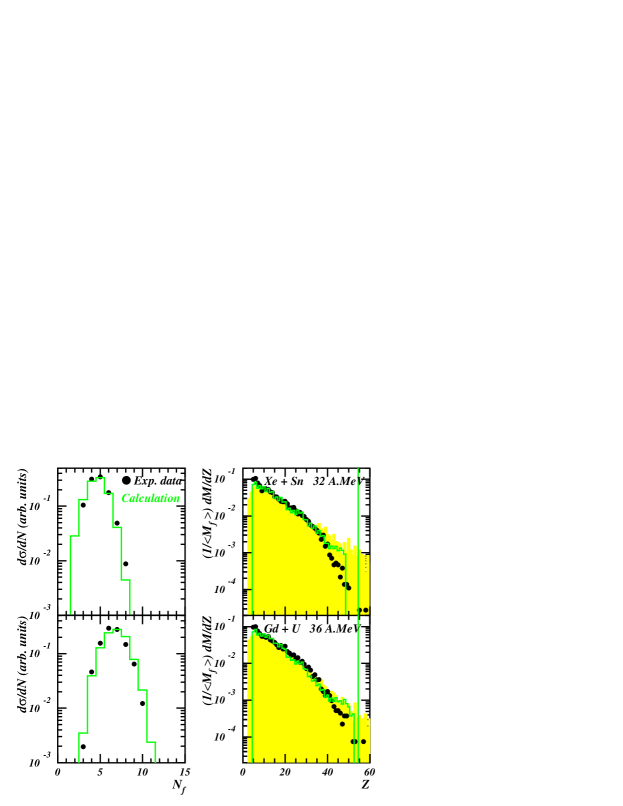
A first comparison between experimental data and calculation was published in reference [23]; it was found that the multiplicity and charge distributions for both systems - and thus the identical fragment charge distributions- were correctly reproduced, but that the calculated fragment kinetic energies were too low. In this previous paper however, the poorest of the two methods for simulating the BL equation proposed was used (SIM): it consisted in initializing the correct (classical) density fluctuations when the system enters the spinodal region, but continuing afterwards a standard one-body calculation, which unfortunately leads to some damping of fluctuations even when the mean field is unstable, because of the lack of a source term. As a result, the fragment formation time was incorrectly increased, leading to smaller final kinetic energies because of the decrease with time of the expansion velocity of the unstable source. The second, and better, simulation method proposed (BOB) will be used for the comparisons presented in the following [34]: the density fluctuations are now continuously created through the addition to the mean field of a stochastic force, and therefore maintained all along the evolution of the unstable system. A second major improvement has been implemented in the simulations: quantal fluctuations connected with collisional memory effects are now taken into account, as calculated in [50], with the determinant result of doubling the overall amplitude of fluctuations for the most unstable modes in our case. The dynamics of head-on 32 A.MeV + and 36A.MeV + collisions was repeated with the improved simulations. The method used to select our experimental data restricts to events which are highly relaxed in form (see Part I), representing only a part of all the multifragmenting single-source events [51, 52]. Therefore only collisions at zero impact parameter were simulated, shape effects are neglected. It should be noticed that although the noise amplitude is computed to match the fluctuation of bulk instabilities, it may trigger any type of instabilities.
In a coherent treatment of the BL theory, fluctuations should be implemented from the beginning of the reaction, though their role only becomes crucial when instabilities appear. Indeed, they then lead to bifurcations and an ensemble of identically-prepared systems will explore a large number of different dynamical trajectories, which produce different multi-fragment partitions. Thus the stochastic mean field calculation has to be performed as many times as the number of events which one wishes to generate, which is very computer time-consuming for large statistics. Moreover the BOB dynamics is only applicable to locally-equilibrated systems and so cannot give a correct description of the very earliest, far off-equilibrium stages of the collision. Compromises therefore have to be made. As the BNV calculation of the reaction without fluctuations gives a unique evolution, it was performed only once and the results used as initial conditions for the BOB dynamics. In order to correctly simulate the growth rate of fragments in the unstable system, the amplitude of density fluctuations must be correct at the time when the spinodal region is reached. Then the BOB calculation has to begin before the onset of instability, because the brownian force cannot set up density fluctuations of the correct amplitude instantaneously, due to the test-particles’ inertia and finite relaxation times. We chose as starting point the moment of maximum compression of the system (t=40 fm/c, see Table 4), when the local equilibrium is established, and we verified that the characteristics of the system at the onset of instability in the BOB calculation were identical to those found from the ‘true’ one-body evolution of the reaction calculated with BNV.
The ingredients of the BNV/BOB simulations are as follows. The self-consistent mean field potential [54] chosen gives a soft equation of state (K∞= 200 MeV) and the finite range of the nuclear interaction is taken into account using a convolution with a gaussian function with a width of 0.9 fm [18]. The addition of a term proportional to in the mean-field potential allows to well-reproduce the surface energy of ground-state nuclei [53]. This is essential in order to correctly describe the expansion dynamics of the composite source. In the collision term a constant value of 41 mb, without in-medium, energy, isospin or angle dependence is used [55]. It should be noticed that, using a stiff parameterization of the equation of state (K∞= 380 MeV), the dynamical evolution of the composite source follows a very different path: density oscillations remain small and the system does not enter the spinodal region. Characteristics of the Gd+U and Xe+Sn systems at two times are shown in Table 4.
| Maximum Compression | Spinodal zone | ||||||||
| (MeV) | (MeV) | ||||||||
| + | 247 | 103 | 1.25 | 8.3(a) | 238 | 100 | 0.41 | 4.0 | .09 |
| + | 389 | 154 | 1.27 | 8.3(a) | 360 | 142 | 0.41 | 4.0 | .10 |
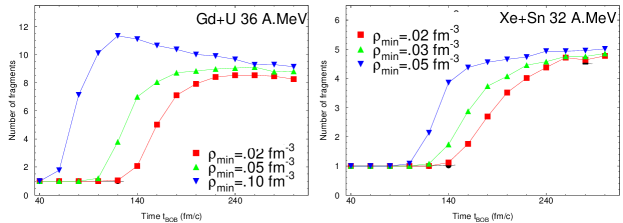
A maximum density 25-30% higher than normal density is reached after 40 fm/c, corresponding to a moderate compression. Then during their expansion phase the two systems enter the spinodal region at around 80 fm/c and attain slightly later thermal equilibrium at low density, with a temperature of 4 MeV. The radial velocity at the surface (0.1c) reveals the gentle expansion of the systems and the density fluctuations have time to develop leading to the formation of fragments. For Gd+U, the charge and mass of the source at 100 fm/c are close to the values determined for the experimental single-source emitting isotropically particles and fragments (end of Sect.2). An algorithm for reconstructing fragments is applied at intervals of 20 fm/c, based on a minimum density cut-off. The calculation is stopped when the fragment multiplicity becomes constant and independent of reasonable variations of the value of the cut-off density, provided it is larger than 0.01 fm-3, as shown in Fig. 10. The chosen density cut-off was 0.02 fm-3 for + ; because of the weaker Coulomb energy and radial flow for + collisions (see table 5), which lead to a different event topology at freeze-out, a higher density cut-off of 0.05 fm-3 was used for this system.
The different characteristics of the fragments so defined can be calculated: mass, charge, linear and angular momentum, kinetic energy and excitation energy. A temperature is deduced from the relation T= using the density dependence of in the framework of the Fermi gas model. The calculated kinetic energy of fragments does not contain the thermal part. This is due to the fact that the amplitude of the BOB term is tuned in order to reproduce the dynamics of the most unstable modes. Hence the fluctuations that are introduced act mostly on the configuration space, leading to fragmentation, but in principle they do not automatically provide a sufficiently good description of fluctuations in momentum space. The approximate solution to this problem used here is to add to each component of the fragment velocity a random part, distributed according to a gaussian of width , where is the mass and the average internal temperature of the fragment considered. This results in an increase of the average kinetic energy of fragments of . The excitation energy of fragments is then reduced by the same quantity, in order to conserve the total energy. Attention is also paid to momentum conservation, event by event.
| (A.MeV) | (A.MeV) | (MeV) | |||||
|---|---|---|---|---|---|---|---|
| + | 194.0 | 76.1 | 5.1 | 13.4 | 3.2 | 0.81 | 175.2 |
| + | 320.0 | 120.8 | 8.1 | 12.6 | 3.3 | 1.54 | 430.0 |
At the end of the dynamical simulation (t 240-260 fm/c) the fragments are well separated, and still bear an average excitation energy of 3 A.MeV, as seen in Table 5. Note that this value is, as expected, smaller than that quoted in section 3 where the simplified assumption that “gas particles” were bound in the hot fragments was made. The mass of the fragments accounts for about 80% of the total system mass; at this stage, the experimental observations reported in section 4 are practically fulfilled: the average charge of fragments for the two systems is the same () and the average multiplicities are in the ratio of 1.6, which corresponds to the ratio of total masses bound in fragments. The average radial energy reported in Table 5 for the + system is larger than the extra collective energy introduced in the SIMON event generator in section 3 in order to account for the average kinetic energies of the fragments. The Coulomb energy is however slightly smaller; this stresses the difficulty to experimentally determine small expansion energies, when their magnitude is similar to the amount of Coulomb energy at the freeze-out.
In a second step of the simulation, the spatial configuration of the primary fragments, with all their characteristics as given by BOB, is taken as input configuration in the SIMON code (see sect. 3): the de-excitation of the hot primary fragments is thus followed while preserving the space-time correlations of all emitted products. The last step consists in filtering the events to take into account the experimental set-up and then selecting events with large flow angles as for the data. It must be noted that the algorithm for fragment reconstruction excludes light products, and thus all light charged particles emitted before the freeze-out are lost. This has two consequences: firstly the selection of complete events is not made on the total detected charge, but on (see section 2); experimental data on Figs. 11-14 use the same selection. Comparisons with the corresponding figures from section 2 show that the two selections give identical results. Secondly, no comparison can be made between calculated and experimental light charged particle properties.
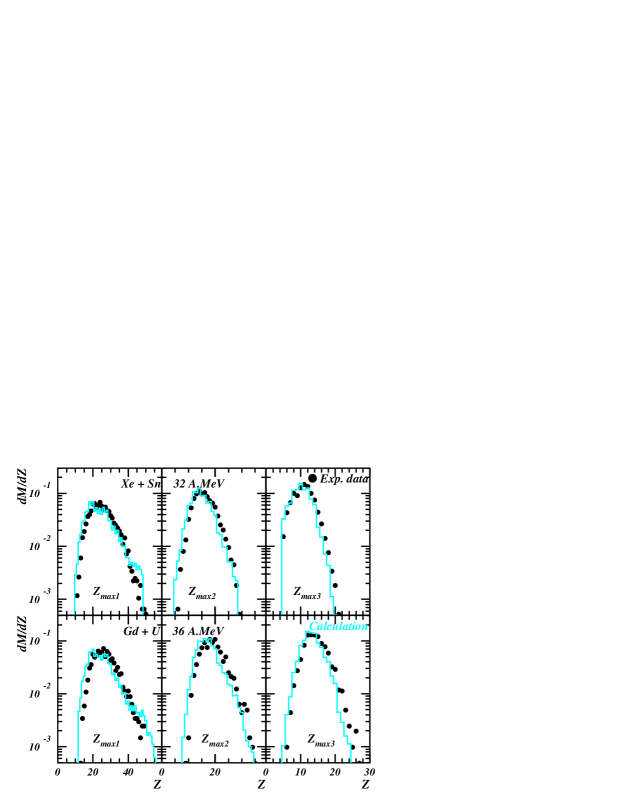
Figure 11 shows that the calculated multiplicity and charge distributions of fragments well match the experimental data. The role of secondary decay in the fragment distribution is negligible, as observed by comparing the grey (primary fragments) and the solid (final fragments) histograms. More detailed comparisons of the charge distributions of the three largest fragments display a good agreement (Fig. 12): the increasing difference between the average charges for the two systems when going from the largest to the second and the third largest fragments is accounted for by the simulation.

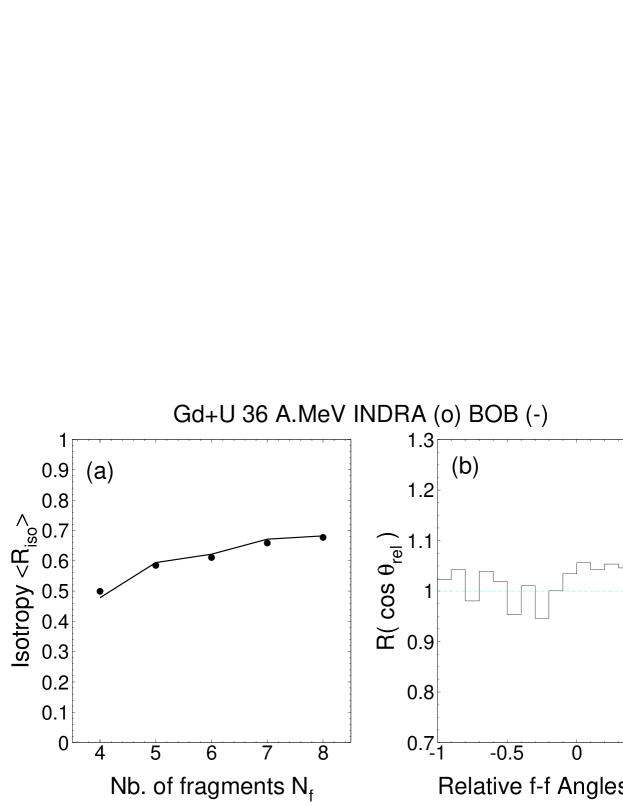
The shapes of the events expressed for instance through the isotropy ratio, with its multiplicity dependence, are identical in the experiment and in the simulation, as shown in Fig. 13a. Conversely the angular correlations between fragments presented in Fig. 13b are less populated at small relative angles in the calculation. This could suggest that the Coulomb effect is too strong in the calculation (longer real emission times?). The same effect would also be obtained if the freeze-out shape resembled a bubble, but in this case the event shape and the evolution of the fragment energies on their charge would be different. The experimental selection can also retain some deformed events [52], which are not accounted for in the simulation where spherical symmetry was kept. The disagreement between experiment and calculation on this point is not fully explained.
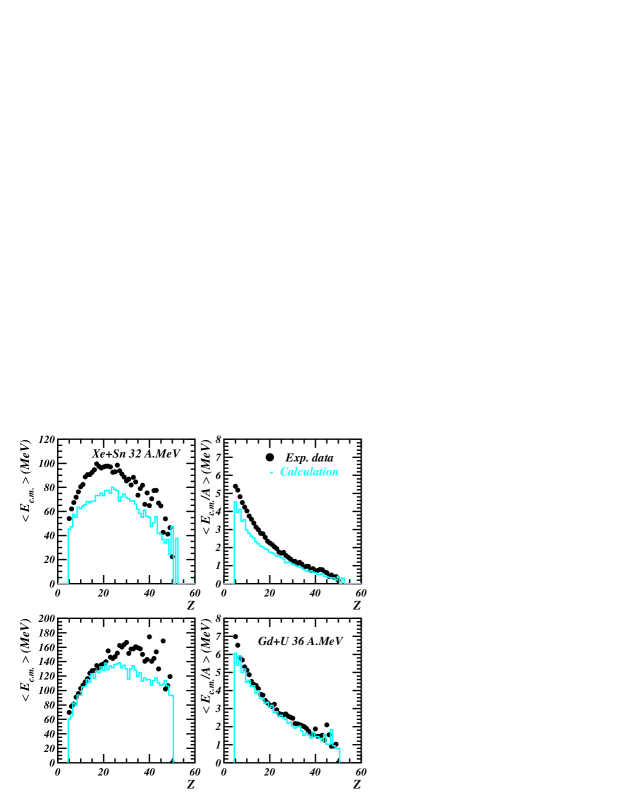
Finally the most crucial test is on the fragment kinetic energies, displayed in Fig. 14. Let us recall that as compared to ref. [23], the energy calibration of the INDRA CsI located past 45o (lab) were improved for fragments with charge larger than 15 (see Fig. 2). This correction is particularly important when the velocity of the reaction centre of mass is small, and the fragment velocities in the c.m. are large. Namely the new results are very different for the 36 A.MeV Gd+U and practically unchanged for the 32 A.MeV Xe+Sn central collisions. The improved simulations now predict the fragment energies for the Gd+U system with a good agreement; for Xe+Sn, the calculated energies fall 20% below the measured values; this remains satisfactory if one remembers that there were no adjustable parameters in the simulation.
6 Conclusions
The properties of the single multifragmenting source formed in central 36 A.MeV + collisions were studied in detail. The angular and energy distributions of all fragments and of most of the light charged particles are isotropic in the c.m. This indicates that the source has reached thermal equilibrium when it multifragments. Fragment kinetic energies sign the onset of expansion energy around 30 A.MeV.
The measured charge distribution is identical to that obtained for the lighter + system with the same available energy, while the average fragment multiplicities are in the ratio of the total charges of the systems. This independence of the Z distribution, experimentally observed for the first time, can be considered as strong evidence of a bulk effect in the production of these fragments. Note that this observation naturally breaks down when the total charge of the systems gets smaller than 60, which is the maximum measured fragment charge for the heavy systems considered here.
This experimental observation can be related either to bulk instabilities in the liquid-gas coexistence of nuclear matter (spinodal instabilities) or taken as a signature of a large exploration of phase space for such heavy systems. Indeed multiplicities, charge distributions and average fragment kinetic energies are equally well predicted by dynamical (BNV-BOB) and statistical (SMM) simulations [38, 39, 27].
Within the dynamical approach, a complete scenario of these central collisions may then be proposed: a gently compressed system expands and reaches thermal equilibrium at about the time it enters the spinodal region. There, the development of density fluctuations causes the disassembly of the system into many (hot) fragments and particles. When the fragments get free from the nuclear force, they are in a “freeze-out” configuration, and only subject to Coulomb repulsion. At that time, 250 fm/c in the simulations, the system has explored enough of the phase-space in order to be describable through statistical models. Within such a scenario, there is no contradiction between a “dynamical” and a “statistical” approach; the first one completely describes the time evolution of the collision, and thus helps in learning about nuclear matter and its phase diagram. The second starts from the phase diagram and has more to do with the thermodynamical description of finite nuclear systems.
Ultimate constraints on models can be expected from the study of correlations: fragment velocity and size correlations will allow to trace back to the fragment topology at freeze-out, and to look for possible fingerprints of spinodal decomposition. This work is in progress.
References
- [1] J.D. Frankland, Ch.O. Bacri, B. Borderie, M.F. Rivet, M. Squalli, G. Auger, N. Bellaize, F. Bocage, R. Bougault, R. Brou, P. Buchet, A. Chbihi, J. Colin, D. Cussol, R. Dayras, A. Demeyer, D. Doré, D. Durand, E. Galichet, E. Genouin-Duhamel, E. Gerlic, D. Guinet, Ph. Lautesse, J.L. Laville, J.F. Lecolley, R. Legrain, N. Le Neindre, O. Lopez, M. Louvel, A.M. Maskay, L. Nalpas, A.D. Nguyen, M. Parlog, J. Péter, E. Plagnol, E. Rosato, F. Saint-Laurent, S. Salou, J.C. Steckmeyer, M. Stern, G. Tabacaru, B. Tamain, O. Tirel, L. Tassan-Got, E. Vient, C. Volant, J.P. Wieleczko (INDRA collaboration), accompanying paper submitted to Nucl. Phys. A
- [2] L.G. Moretto and G.J. Wozniak, Ann. Rev. of Nuclear and Particle Science Vol 43 (1993) 379.
- [3] G.F. Bertsch and P.J. Siemens, Phys. Lett. B 126 (1983) 9.
- [4] D.H.E. Gross, Rep Prog. Phys. 53 (1990) 605 and Phys. Reports 279 (1997) 119.
- [5] J.P. Bondorf, A.S. Botvina, A.S. Iljinov, I.N. Mishustin, K. Sneppen, Phys. Reports 257 (1995) 133.
- [6] J.A. Lopez and J. Randrup, Nucl. Phys. A503 (1989) 183; A512 (1990) 345.
- [7] Al. H. Raduta and Ad. R. Raduta, Phys. Rev. C55 (1997) 1344
- [8] W.A. Friedman, Phys. Rev. C42 (1990) 667.
- [9] G. Peilert, H Stocker, W. Greiner, A. Rosenhaer, A. Bohnet and J. Aichelin, Phys. Rev. C39 (1989) 1402,
- [10] H. Feldmeier, Nucl. Phys. A515 (1990) 147,
- [11] A. Ono, H. Horiuchi and T. Maruyama, Phys. Rev. C47 (1993) 2652
- [12] A. Ono and H. Horiuchi, Phys. Rev. C53 (1996) 2958; A. Ono, Phys. Rev. C59 (1999) 853.
- [13] Y. Sugawa and H. Horiuchi, Phys. Rev. C60 (1999) 064607.
- [14] S. Ayik and C. Grégoire, Phys. Lett. B 212 (1988) 269; Nucl. Phys. A 513 (1990) 187.
- [15] J. Randrup and B. Remaud, Nucl. Phys. A 514 (1990) 339.
- [16] Ph. Chomaz, G. F. Burgio and J. Randrup, Phys. Lett B254 (1991) 340.
- [17] Ph. Chomaz, M. Colonna, A. Guarnera and J. Randrup, Phys. Rev. Lett. 73 (1994) 3512.
- [18] A. Guarnera, M. Colonna and Ph. Chomaz Phys. Lett. B373 (1996) 267 and references therein.
- [19] A. Guarnera, Ph. Chomaz, M. Colonna and J. Randrup. Phys. Lett. B403 (1997) 191.
- [20] Ph. Chomaz, Ann. Phys. Fr. 21 (1996) 669.
- [21] G. Tăbăcaru, B. Borderie, A. Ouatizerga, M. Pârlog, M.F. Rivet, G. Auger, Ch. O. Bacri, F. Bocage, R. Bougault, R. Brou, P. Buchet, J. L. Charvet, A. Chbihi, J. Colin, D. Cussol, R. Dayras, A. Demeyer, D. Doré, D. Durand, P. Ecomard, J.D. Frankland, E. Galichet, E. Genouin-Duhamel, E. Gerlic, D. Guinet, P. Lautesse, J.L. Laville, A. Le Fèvre, T. Lefort, R. Legrain, N. Le Neindre, O. Lopez, M. Louvel, L. Nalpas, A.D. Nguyen, E. Plagnol, E. Rosato, F. Saint-Laurent, S. Salou, M. Squalli, J.C. Steckmeyer, M. Stern, L. Tassan-Got, O. Tirel, E. Vient, C. Volant and J.P. Wieleczko, Nucl. Instr. and Meth.in Phys. Res. A428 (1999) 379.
- [22] M. Pârlog, B. Borderie, M.F. Rivet, G. Tăbăcaru, A. Chbihi, M. Elouardi, N. Le Neindre, O. Lopez, E. Plagnol, L. Tassan-Got, G. Auger, Ch. O. Bacri, N. Bellaize, F. Bocage, R. Bougault, B. Bouriquet, R. Brou, P. Buchet, J. L. Charvet, A. Chbihi, J. Colin, D. Cussol, R. Dayras, A. Demeyer, D. Doré, D. Durand, J. D. Frankland, E. Galichet, E. Genouin-Duhamel, E. Gerlic, S. Hudan, D. Guinet, P. Lautesse, F. Lavaud, J.L. Laville, J.F. Lecolley, C. Leduc R. Legrain, M. Louvel, A. M. Maskay, L. Nalpas, J. Normand, J. Péter, E. Rosato, F. Saint-Laurent, J.C. Steckmeyer, M. Stern, B. Tamain, O. Tirel, E. Vient, C. Volant and J.P. Wieleczko, submitted to Nucl. Instr. and Meth. in Phys. Res.
- [23] M.F. Rivet, C.O. Bacri, B. Borderie, J.D. Frankland, M. Assenard, G. Auger, F. Bocage, R. Bougault, R. Brou, P. Buchet, A. Chbihi, J. Colin, R. Dayras, A. Demeyer, D. Doré, D. Durand, P. Eudes, E. Galichet, E. Genouin-Duhamel, E. Gerlic, M. Germain, D. Guinet, P. Lautesse, J.L. Laville, J.F. Lecolley, A. Le fèvre, T. Lefort, R. Legrain, N. Le Neindre, O. Lopez, M. Louvel, L. Nalpas, A.D. Nguyen, M. Pârlog, J. Péter, E. Plagnol, A. Rahmani, T. Reposeur, E. Rosato, F. Saint-Laurent, S. Salou, M. Squalli, J.C. Steckmeyer, M. Stern, G. Tăbăcaru, B. Tamain, L. Tassan-Got, O. Tirel, D. Vintache, C. Volant, J.P. Wieleczko, A. Guarnera, M. Colonna, P. Chomaz, Phys. Lett. B 430 (1998) 217.
- [24] S. Pratt, C. Montoya and F. Ronning, Phys. Lett. B349 (1995) 261
- [25] H. Fuchs and K. M hring, Rep. Prog. Phys. 57 (1994) 231.
- [26] N. Marie, A. Chbihi, J.B. Natowitz, A. Le Fèvre, S. Salou, J.P. Wieleczko, L. Gingras, M. Assenard, G. Auger, Ch.O. Bacri, F. Bocage, B. Borderie, R. Bougault, R. Brou, P. Buchet, J.L. Charvet, J. Cibor, J. Colin, D. Cussol, R. Dayras, A. Demeyer, D. Doré, D. Durand, P. Eudes, J.D. Frankland, E. Galichet, E. Genouin-Duhamel, E Gerlic, M¿ Germain, D. Gourio, D. Guinet, K. Hagel, P. Lautesse, J.L. Laville, J.F. Lecolley, T. Lefort, R. Legrain, N. Le Neindre, O. Lopez, M. Louvel, Z. Majka, A.M. Maskay, L. Nalpas, A.D. Nguyen, M. Pârlog, J. Péter, E. Plagnol, A. Rahmani, T. Reposeur, M.F. Rivet, E. Rosato, F. Saint-Laurent, J.C. Steckmeyer, M. Stern, G. Tabacaru, B. Tamain, O. Tirel, E. Vient, C. Volant and R. Wada, Phys. Rev. C58 (1998) 256.
- [27] R. Bougault, J.P. Wieleczko, M. D’Agostino, W.A. Friedman, N. Le Neindre, F. Gulminelli, A. Chbihi, S. Salou, G. Auger, C.O. Bacri, N. Bellaize, F. Bocage, B. Borderie, R. Brou, P. Buchet, J. Colin, D. Cussol, R. Dayras, A. Demeyer, D. Doré, D. Durand, J.D. Frankland, E. Galichet, E. Genouin-Duhamel, E. Gerlic, D. Guinet, P. Lautesse, J.L. Laville, J.F. Lecolley, R. Legrain, O. Lopez, M. Louvel, A.M. Maskay, L. Nalpas, A.D. Nguyen, M. Pârlog, J. Péter, E. Plagnol, M.F. Rivet, E. Rosato, F. Saint-Laurent, J.C. Steckmeyer, M. Stern, G. Tăbăcaru, B. Tamain, L. Tassan-Got, O. Tirel, E. Vient, C. Volant, Proc. XXVII Intern. Workshop on Gross Properties of Nuclei and Nuclear Excitations, Hirschegg, Austria (1999). ed. H. Feldmeier, J. Knoll, W. Nörenberg, J. Wambach, page 24.
- [28] W. Reisdorf, D. Best, A. Gobbi, N. Herrmann, K.D. Hildenbrand, B. Hong, S.C. Jeong, Y. Leifels, C. Pinkenburg, J.L. Ritman, D. Sch ll, U. Sodan, K. Teh, G.S. Wang, J.P. Wessels, T. Wienold, J.P. Alard, V. Amouroux, Z. Basrak, N. Basti, I. Belyaev, L. Berger, J. Biegansky, M. Bini, S. Boussange, A. Buta, R. C̆aplar, N. Cindro, J.P. Coffin, P. Crochet, R. Dona, P. Dupieux, M. Delalija, J. Er , M. Eskef, P. Fintz, Z. Fodor, L. Fraysse, A. Genoux-Lubain, G. Goebels, G. Guillaume, Y. Grigorian, E. H fele, S. H lbling, A. Houari, M. Ibnouzahir, M. Joriot, F. Jundt, J. Kecskemeti, M. Kirejczyk, P. Koncz, Y. Korchagin, M. Korolija, R. Kotte, C. Kuhn, D. Lambrecht, A. Lebedev, A. Lebedev, I. Legrand, C. Maazouzi, V. Manko, T. Matulewicz, P.R. Maurenzig, H. Merlitz, G. Mgebrishvili, J. M sner, S. Mohren, D. Moisa, G. Montarou, I. Montbel, P. Morel, W. Neubert, A. Olmi, G. Pasquali, D. Pelte, M. Petrovici, G. Poggi, P. Pras, F. Rami, V. Ramillien, C. Roy, A. Sadchikov, Z. Seres, B. Sikora, V. Simion, K. Siwek-Wilczyska, V. Smolyankin, N. Taccetti, R. Tezkratt, L. Tizniti, M. Trzaska, M.A. Vasiliev, P. Wagner, K. Wisniewski, D. Wohlfarth and A. Zhilin (FOPI Collaboration), Nucl. Phys. A 612(1997) 493.
- [29] M. D’Agostino, A.S. Botvina, P.M. Milazzo, M. Bruno, G.J. Kunde, D.R. Bowman, L. Celano, N. Colonna, J.D. Dinius, A. Ferrero, M.L. Fiandri, C.K. Gelbke, T. Glasmacher, F. Gramegna, D.O. Handzy, D. Horn, W.C. Hsi, M. Huang, I. Iori, M.A. Lisa, W.G. Lynch, L. Manduci, G.V. Margagliotti, P.F. Matsinu, I.N. Mishustin, C.P. Montoya, A. Moroni, G.F. Peaslee, F. Petruzzelli, L. Phair, R. Rui, C. Schwartz, M.B. Tsang, G. Vannini and C. Williams, Phys. Lett. B 371 (1996) 175.
- [30] A.D. N’guyen, thesis, Université de Caen (1998), LPCC T 98-02
- [31] D.R. Dean and U. Mosel, Z. Phys. A322 (1985) 647.
- [32] S.E. Koonin and J. Randrup, Nucl. Phys. A474 (1987) 173.
- [33] W.A. Friedman, Phys. Rev. C60 (1999) 044603.
- [34] J.D. Frankland, th se, Universit Paris XI Orsay, 1998, IPNO-T-98-06.
- [35] S. Levit and P. Bonche, Nucl. Phys. A437 (1985) 426.
- [36] E. Plagnol, J. Łukasik, G. Auger, C.O. Bacri, N. Bellaize, F. Bocage, B. Borderie, R. Bougault, R. Brou, P. Buchet, J.L. Charvet, A. Chbihi, J. Colin, D. Cussol, R. Dayras, A. Demeyer, D. Doré, D. Durand, J.D. Frankland, E. Galichet, E. Genouin-Duhamel, E. Gerlic, D. Guinet, P. Lautesse, J.L. Laville, J.F. Lecolley, R. Legrain, N. Le Neindre, O. Lopez, M. Louvel, A.M. Maskay, L. Nalpas, A.D. Nguyen, M. Pârlog, J. Péter, M.F. Rivet, E. Rosato, F. Saint-Laurent, S. Salou, J.C. Steckmeyer, M. Stern, G. Tăbăcaru, B. Tamain, L. Tassan-Got, O. Tirel, E. Vient, C. Volant, and J.P. Wieleczko, Phys. Rev. C 61 (1999) 014606.
- [37] N. Marie, R. Laforest, R. Bougault, J.P. Wieleczko, D. Durand, Ch. O. Bacri, J.F. Lecolley, F. Saint-Laurent, G. Auger, J. Benlliure, E. Bisquer, B. Borderie, R. Brou, J.L. Charvet, A. Chbihi, J. Colin, D. Cussol, R. Dayras, E. De Filippo, A. Demeyer, D. Doré, P. Ecomard, P. Eudes, D. Gourio, D. Guinet, P. Lautesse, J.L. Laville, A. Le Fèvre, T. Lefort, R. Legrain, O. Lopez, M. Louvel, V. Métivier, L. Nalpas, A Ouatizerga, M. Pârlog, J. Péter, E. Plagnol, A. Rahmani, T. Reposeur, M.F. Rivet, E. Rosato, S. Salou, M. Squalli, J.C. Steckmeyer, B. Tamain, L. Tassan-Got, E. Vient and C. Volant, Phys. Lett. B391 (1997) 15.
- [38] S. Salou, thèse, université de Caen (1997), GANIL T 97 06
- [39] N. Le Neindre, thèse, université de Caen (1999), LPCC T 99 02
- [40] A. Le F vre, th se, Universit Paris 7-Denis Diderot (1997), GANIL T 97 03.
- [41] L.G. Moretto, Kin Tso, N. Colonna and G.J. Wozniak, Phys. Rev. Lett. 69 (1992) 1884.
- [42] B. Jouault, F. Sébille, G. Royer, V. de la Mota, Nucl. Phys. A 591 (1995) 497.
- [43] W. Cassing, V. Metag, U. Mosel and K. Niita, Phys. Rep. 188 (1990) 363
- [44] V. de la Mota, F. Sebille, M. Farine and P. Schuck, Phys. Rev. C46 (1992) 677.
- [45] W. Bauer, C.K. Gelbke and S. Pratt, Ann. Rev. Nucl. Part. Sci. 42 (1992) 77.
- [46] M. Colonna, M. Di Toro and A. Guarnera, Nucl. Phys. A589 (1995) 160.
- [47] B. Borderie, M.F. Rivet, P. Box, M. Dakowski, C. Cabot, Y. El Masri, F. Hanappe, D. Gardes, D. Jouan, G. Mamane, X. Tarrago and H. Utsunomiya, Z. Phys. A 357 (1997) 7.
- [48] Bao-An Li, Che Ming Ko and W. Bauer, Int. Journ. of Mod. Phys. E7 (1998) 147.
- [49] M. Colonna and Ph. Chomaz, Phys. Rev. C 49 (1994) 1908.
- [50] S. Ayik and J. Randrup, Phys. Rev. C 50 (1994) 2947.
- [51] A. Le F vre, M. Ploszajczak and V.D. Toneev, Phys. Pev. C60 (1999) 0510602
- [52] B. Bouriquet, J.P. Wieleczko and the INDRA collaboration, to be published.
- [53] M.Colonna, Nucl. Phys. A630 (1998) 136c.
- [54] L. Zamick, Phys. Lett B45 (1973) 313
- [55] G.F. Bertsch, Z. Phys. A 289 (1978) 103.