Direct Photon Production in 158 A GeV 208Pb+208Pb Collisions
Abstract
A measurement of direct photon production in 208Pb+208Pb collisions at 158 A GeV has been carried out in the CERN WA98 experiment. The invariant yield or upper limit of direct photons as a function of transverse momentum in the interval GeV/c is presented. A significant direct photon excess is observed at GeV/c in central collisions. The results are compared to proton-induced results and to theoretical predictions. Implications for the dynamics of high-energy heavy-ion collisions are discussed.
pacs:
25.75.+r,13.40.-f,24.90.+pI INTRODUCTION
A major current goal of the field of nuclear physics is the experimental confirmation of the existence of a new phase of strongly interacting matter, the quark gluon plasma (QGP) [1], which is predicted to exist according to lattice calculations of quantum chromodynamics. Enhanced production of strange hadrons, photons, and dileptons, and suppression of mesons are some of the proposed consequences of QGP formation. Both suppression [2] and strangeness enhancement [3] have been observed in relativistic heavy-ion collisions with strongly enhanced nuclear effects. While these observations naturally lead to the conclusion that the initial phase of the collision consisted of a hot and dense system with strong rescattering, which may be explained by the assumption of QGP formation, the direct experimental detection of QGP through observation of direct emission of real or virtual photons from the quark matter remains to be attained.
Historically, photons and lepton-pairs were the probes first suggested to use to search for evidence of quark-gluon plasma formation in ultrarelativistic heavy ion collisions. During the collision, real photons are produced mainly by scattering amongst the electrically charged objects while virtual (i.e. massive) photons, which later decay into pairs of oppositely charged leptons, or dileptons, are produced mainly by particle-antiparticle annihilations. Once produced, the real and virtual photons will interact with the surrounding hot dense matter through the electromagnetic interaction only. The resulting small interaction cross section implies a long mean free path in the dense matter with the consequence that the photons are likely to escape unscathed once produced. As a result, real and virtual photons carry information about the conditions of the matter from which they were produced throughout the entire history of the heavy ion collision, including especially the initial hot dense phase. Therefore, if the initial phase includes a quark-gluon plasma which radiates real and virtual photons differently than would dense hadronic matter this difference may be apparent in the photon and dilepton spectra observed by the experimentalist. This is in contrast to hadrons which, due to their extremely short mean free path in the hot dense matter, are unlikely to escape until the system has cooled and expanded to the low temperature and low density freezeout stage. As a result, quark-gluon plasma formation during the initial stage of the collision will make its presence evident via hadronic probes only if it alters the macroscopic features of the system, such as its strangeness content or collective flow, in a way which is different from dense hadronic matter and if these altered features are preserved until the time of freezeout. Thus the electromagnetic and hadronic probes provide complementary information. Since the real and virtual photon emission rate is greatest in hot dense matter the electromagnetic probes should carry information mostly about the dynamics (or thermodynamics) of the initial phase of the collision, while hadronic probes carry information dominantly about the late stage of the collision.
Originally, Feinberg [4] and Shuryak [5] suggested that thermal emission might be an important process in hadron-induced and even lepton-induced reactions when a large multiplicity of particles are produced in the final state. In particular they pointed out that rescattering amongst the produced particles in local thermal equilibrium during the later stages of the interaction would give rise to real and virtual photon emission. (Bjorken and Weisberg made similar suggestions at that time about the possible importance of rescattering [6]). Such a mechanism could explain the, at that time, puzzling excess dilepton yield observed at intermediate dilepton masses, GeV/c2 [5]. Feinberg [4] speculated upon the nature of the hot prematter remaining after the interaction and suggested that it may even be gluonic matter with embedded quarks. Shuryak [5] went on to assume formation of such a quark-gluon plasma in order to calculate the emission rates by perturbative QCD methods.
While it remains unknown whether quark-gluon plasma may be produced in hadron-induced reactions, it was suggested shortly afterwards that relativistic collisions of heavy ions provide conditions likely to result in the production of quark-gluon plasma. Initially it was suggested that such a plasma might occur at incident laboratory energies as low as a few GeV per nucleon [7] due to compression of the colliding nuclei and the resulting high baryon density. Another estimate based on extrapolations of known properties of NN and NA collisions at energies of GeV suggested that the fragmentation regions of AA collisions were likely to result in quark-gluon plasma formation [8]. Later calculations solving the relativistic hydrodynamic equations indicated that the highest energy densities would instead occur in the mid-rapidity region with energy densities considered sufficient for QGP formation at incident energies of around 400 GeV per nucleon [9].
Almost concurrent with the suggestions to use relativistic heavy ions as a means to produce the QGP in the laboratory were suggestions to use dilepton or photon measurements to diagnose whether QGP has been formed. First estimates considering only the lowest order elementary processes and thermal parton distributions [10, 11] concluded that the thermal dilepton emission rate from the QGP should exceed that from a hadronic gas in the mass region below the [10], and that real and virtual photons should provide accurate information on the temperature of the plasma [11]. A simple counting estimate indicated an expected photon enhancement relative to the number of pions in the case of QGP formation [12]. First calculations which performed the space-time integration of the lowest order production rates by solving the relativistic hydrodynamic equations confirmed [13] that the dilepton yield in the mass region below the was sensitive to the initial temperature of the QGP and to the critical temperature. Alternatively, it was suggested that the ratio of the simultaneously observed photon and dilepton pair yield might provide a signal which was sensitive to QGP formation while being insensitive to the details of the collision dynamics [14].
While these initial estimates indicated that photons and dileptons should be useful probes to diagnose the presence of QGP, the rate estimates themselves were suspect since lowest order perturbative calculations had been applied at energies, or temperatures, similar to , the QCD scale factor. The dilepton and photon rate estimates were put on firmer ground when McLerran and Toimela [15], following the suggestion by Feinberg [4] that the photon and dilepton rates could be determined from the expectation value of the electromagnetic current correlation function, demonstrated that for each order the emission rates had an invariant form with thermal structure functions entering in a manner exactly analogous to the usual structure functions for finding a quark or gluon in a hadron. Also, it was observed that terms which contribute to the dilepton or photon emission which are problematic at the basic diagram level, are regularized in the QGP. For example, dilepton emission from quark-antiquark annihilation is infrared divergent in the limit of zero mass gluons while in the plasma gluons propagate as plasma oscillations with a plasmon mass which provides a cutoff to eliminate the divergences for small gluon momenta [15].
Later, using the resummation techniques of Braaten and Pisarski [16, 17], Kapusta et al. [18] demonstrated that the photon emission rates of quark gluon matter and hadronic matter were very similar. As a consequence, it could be concluded that while photon emission was not per se a signature of quark gluon matter, detection of the emitted photons could provide a good measurement of the temperature of the hot and dense matter.
Recently, the situation has changed again with the demonstration by Aurenche et al. [19] that the contribution to the photon emission rate from two-loop diagrams are significantly larger than the lowest order contributions of the Compton () and annihilation () processes which were previously thought to dominate the photon emission rate from the quark matter. The two-loop diagrams were shown to give a large bremsstrahlung () contribution and a contribution from a previously neglected process of annihilation accompanied by q(g) rescattering. This annihilation with rescattering process is found to dominate the photon emission rate of the quark matter at large transverse momenta. Inclusion of these rates in hydrodynamic model calculations of heavy-ion collisions has recently shown that photon yield from the quark matter may be significantly larger than the photon yield from the hadronic matter [20]. The direct photons may therefore dominantly carry information about the quark gluon plasma.
A large body of data on prompt photon emission exists for proton-induced reactions on targets of protons, anti-protons, and light nuclei [21, 22, 23, 24, 25, 26, 27, 28, 29, 30, 31, 32, 33, 34, 35]. The prompt photon measurements have provided important input on gluon structure functions [36]. It is now possible to perform complete and fully consistent next-to-leading order (NLO) QCD calculations of the prompt photon cross sections. In general, the prompt photon data can be well described from fixed target energies up to Tevatron energies [37] which provides an important foundation for the intrepretation of direct photon production in nucleus-nucleus collisions. In the past, discrepancies with calculation have sometimes been attributed to effects of intrinsic smearing arising from higher order contributions such as soft-gluon emissions [33, 36, 38]. While the evidence for intrinsic effects remains under debate [39], the observed trend of an underestimated prompt photon yield at low transverse momentum and low incident energy is suggestive of an intrinsic effect [37, 39]. A thorough understanding of the source of this discrepancy will be important in the search for thermal direct photons at low transverse momentum in nucleus-nucleus collisions at the presently available low incident energies.
First attempts to observe direct photon production in ultrarelativistic heavy-ion collisions with oxygen and sulphur beams found no significant excess [40, 41, 42, 43]. The WA80 collaboration [43] provided the most interesting result with a dependent upper limit on the direct photon production in S+Au collisions at 200GeV. This result was subsequently used by several authors to rule out a simple version of the hadron gas scenario [44, 45, 46, 47] and to establish an upper limit on the initial temperature of [48]. In this paper, the first observation of direct photons from ultrarelativistic heavy-ion collisions is reported for central 158 A GeV 208Pb+208Pb collisons. The implications of the result are discussed.
The organization of the paper is as follows: A description of the WA98 experimental setup including the event selection and photon spectrometer are presented in the next section. A general description of the WA98 direct photon analysis method is given in Sec. III. The details of the data analysis including a presentation of the various corrections and their associated errors for extraction of the inclusive photon, , and yields is given in Sec. IV. The final inclusive photon, , and distributions are presented in Sec. V. The direct photon result is also presented in Sec. V and the results are compared to calculation and discussed. A summary and conclusion is given in Sec. VI.
II WA98 EXPERIMENTAL SETUP
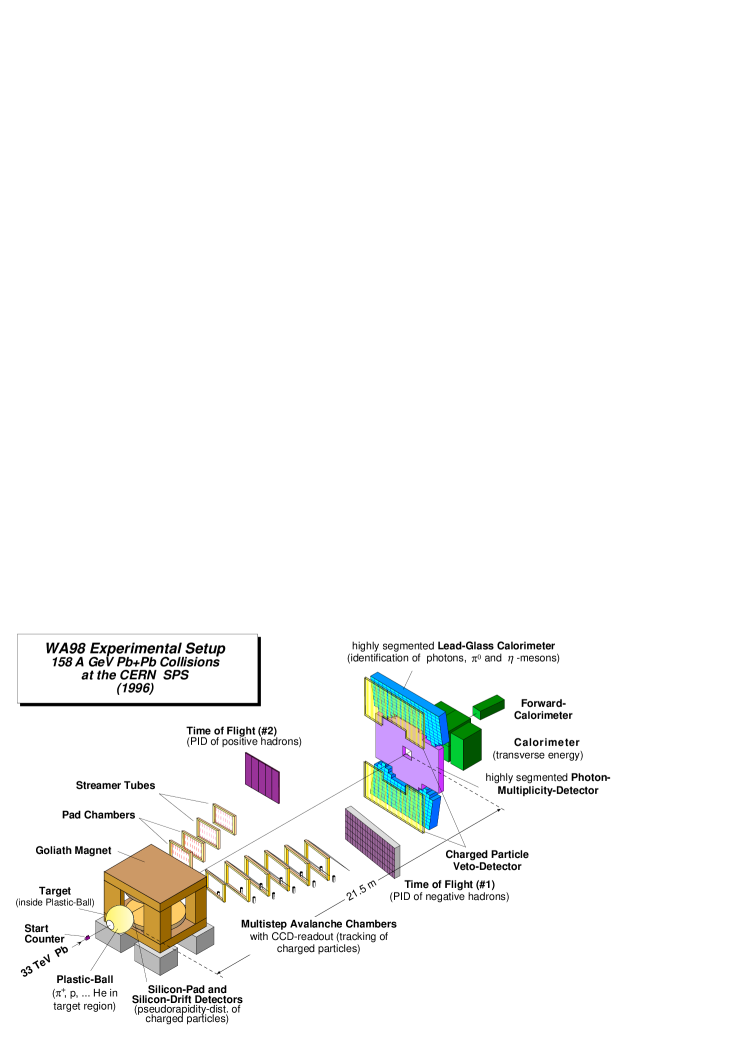
The CERN experiment WA98 is a general-purpose apparatus which consists of large acceptance photon and hadron spectrometers together with several other large acceptance devices which allow to measure various global variables on an event-by-event basis. The experiment took data with the 158 A GeV 208Pb beams from the SPS in 1994, 1995, and 1996. The results presented here were obtained from analysis of the 1995 and 1996 data sets. The layout of the WA98 experiment as it existed during the final WA98 run period in 1996 is shown in Fig. 1.
A Detector Subsytems
Each 158 A GeV 208Pb beam particle is qualified in a series of trigger counters located upstream of the target. The 208Pb target is mounted in a thin target wheel at the center of a 20 cm diameter spherical thin-walled aluminum vacuum chamber located within the Plastic Ball detector. The target wheel has 5 target positions, one of which was empty for non-target background measurements.
The Plastic Ball detector consists of 655 modules which provide energy measurement and particle identification of charged pions and light particles by measurement [49]. The Plastic Ball detector provides particle measurement over the interval . Each module comprises a slow 4 mm thick CaF2 scintillator followed by a fast plastic scintillator readout by a common photomultiplier. The signals from the photomultipliers of the two forward-most rings of Plastic Ball modules, subtending the angular region from to , are split and a portion of the signals are analog summed to provide an online energy signal for trigger purposes. This signal is used to suppress interactions downstream of the target.
The target vacuum chamber is extended downstream in a conical vacuum chamber which contains the Silicon Drift Detector (SDD) and the Silicon Pad Multiplicity Detector (SPMD) [50], each consisting of 300 m thick silicon wafers. The SDD and SPMD are located 12.5 cm and 30 cm downstream from the target, respectively. These detectors provide charged particle multiplicity measurement over the intervals of and , respectively.
Charged particle momentum measurement and particle identification is accomplished using two tracking spectrometer arms. The momentum measurement is accomplished by magnetic analysis in a large (1.6 m) aperture dipole magnet called GOLIATH which provides 1.6 Tm bending power. Both tracking spectrometers use straight-line tracking outside the magnetic field. Particle identification is obtained using time-of-flight measured with scintillator slat detectors in each tracking arm. In the normal magnetic field configuration the negative tracks are deflected to the right, looking downstream, into the first tracking arm. The first tracking arm consists of six planes of multi-step avalanche chambers [51]. The active area of the first tracking chamber is m2 while that of the other five chambers is m2. The chambers produce UV photons by means of a photoemissive vapor which are then converted to visible light via wavelength shifter plates. On exiting the chamber, the visible light is reflected by thin-foil mirrors to CCD cameras equipped with two-stages of image intensifiers. Each CCD pixel viewed a chamber area of about mm2.
The second tracking arm measures positive-charged tracks in the normal field condition. It consists of four chambers of m2 [52]. The first two chambers are multi-step avalanche chambers similar to those of the first tracking arm, but with the avalanche signal collected directly on an anode plane with pad readout. In total about 35000 pads per chamber are read out. The last two tracking chambers consist of streamer tubes read out with 6000 pads each. The second tracking arm was installed and operated for the 1996 run period only.
The Photon Multiplicity Detector (PMD) [53] is located at a distance of 21.5 m downstream from the target. The PMD is a large (21 m2) preshower detector consisting of 3.3 radiation lengths of lead used to convert and count photons. The lead converter is backed by over 50000 scintillator tiles individually wrapped and readout via wavelength shifter optical fibers coupled in groups to a set of CCD cameras with image intensifiers. The PMD provides a photon multiplicity measurement over the interval .
The WA98 photon spectrometer comprises the LEad-glass photon Detector Array (LEDA), and a charged particle veto detector. The photon spectrometer is divided into two halves placed above and below the beam plane to benefit from the charge-sweeping effect of the GOLIATH magnet, and is located at about the same distance as the PMD. It provides photon energy measurement over the interval . The photon spectrometer is described in more detail below.
Further downstream, at a distance of 24.7 m from the target, the total transverse energy is measured in the MIRAC calorimeter [54]. The MIRAC is a sampling calorimeter with 180 calorimeter towers readout on two sides with wavelength shifter plates coupled to photomultipliers. Each tower is segmented longitudinally to provide separate measurement of the electromagnetic and hadronic energy deposit. A portion of the signal from each photomultiplier of MIRAC is split off and the analog signal is summed with appropriate weight to form a total transverse energy signal for trigger purposes. The MIRAC is deployed in a rectangular wall 3.3 m wide by 2.4 m high centered on the beam axis with a central aperture 61 cm wide by 23 cm high through which the beam passes. A portion of the MIRAC coverage overlaps with the PMD preshower detector. The MIRAC provides total transverse energy measurement with varying azimuthal coverage over the interval .
Finally, the total energy of the uninteracting beam, or of the residual beam fragments and produced particles emitted near to zero degrees, is measured in the Zero Degree Calorimeter (ZDC). The ZDC consists of 35 lead/scintillator sampling calorimeter modules of cm2 cross sectional area each. For each module the scintillator is read out from the side with a fast wavelength shifter plate coupled to a photomultiplier with an active base. This allowed stable operation with intensities up to 1 MHz of the full 33 TeV 208Pb beam. The ZDC modules were stacked in an array 7 modules wide by 5 modules high. Since it serves as the WA98 beam stop the ZDC is located in a shielded cave (not shown in Fig. 1) for radiological protection reasons. The cave is located just behind MIRAC with an entrance aperture the same size as the aperture through MIRAC.
In order to minimize backgrounds, WA98 has been designed with attention to minimize the amount of material in the beamline and in the flight paths of the detected particles. Thus, except for trigger detectors in the beamline and a small air gap in the GOLIATH magnet, the beam is transported in an evacuated beampipe (not shown in Fig. 1) from the point of extraction from the SPS through the entire experiment until just before being stopped in the ZDC. A trapezoidal chamber extends the vacuum beyond the silicon detectors to the entrance of the GOLIATH magnet. It ends with a m2 exit window of 125 m thick mylar suspended by a kevlar mesh of 240 m average thickness. For the 1995 run period a 2.5 mm thick aluminum ring of 15 mm diameter with a 11 mm diameter hole was attached to the exit window at the location of the beam exit. The thick mylar and kevlar mesh was removed from the ring aperature and replaced by a thin mylar foil. While the purpose of the thin foil had been to reduce downstream interactions, the ring caused significant interactions from the beam halo and so the exit window was replaced with a homogeneous mesh and mylar foil for the 1996 run period. After a 75 cm air gap, the vacuum continues with a series of 0.5 mm thick carbon fiber beam tubes. The first beam tube is of 5 cm diameter and 1.44 m length followed by a second tube of 10 cm diameter and 4.5 m length. A third beam tube continues through the experiment with a 20 cm diameter to the front of the MIRAC calorimeter where it attaches to a rectangular vacuum pipe which defines the aperture in MIRAC and terminates the vacuum at the rear of MIRAC just before the entrance to the ZDC.
The PMD, SDD, and tracking spectrometers are not used in the present analysis and will not be discussed further. Additional details on event selection and on the photon spectrometer are given next.
B Event Selection
The WA98 trigger detectors comprise a nitrogen gas Čerenkov counter [55] to provide a fast start signal ( ps time resolution), beam-halo veto counters, and the MIRAC calorimeter. A clean beam trigger is defined as a signal in the start counter, located 3.5 m upstream of the target, with no coincident signal in the veto scintillator counter (which had a 3 mm diameter circular hole and was located 2.7 m upstream of the target), or in beam halo scintillator counters which covered the region from the veto counter to 25 cm transverse to the beam axis. Beam fragments from upstream interactions are rejected by use of a high threshold on the start counter signal, set just below the 208Pb signal. Short timescale pileup events are vetoed by an anti-coincidence requirement with a higher threshold start signal, set just above the 208Pb signal. Additional background event rejection is performed offline using the amplitude and timing information from the trigger detectors. For purposes of background rejection each of the trigger logic signals is copied multiple times and recorded on TDCs with various delayed starts or delayed stops which allow to inspect the time period immediately preceeding or following the trigger event. This set of TDCs allows to reject pileup beam particles or interactions over preceeding or following time ranges of 100 ns, 500 ns, or 10 s in the offline analysis.
The MIRAC calorimeter provides an analog total transverse energy sum for centrality selection for online trigger purposes. The WA98 minimum bias trigger requires a clean beam trigger with a MIRAC transverse energy signal which exceeds a low threshold. Two additional trigger signals are derived from the MIRAC transverse energy signal using thresholds set somewhat above and far above the minimum bias threshold. These three MIRAC thresholds define three non-overlapping event classes which are used to define the WA98 physics triggers. The thresholds were adjusted such that the so-called peripheral event class, between the lowest and next-to-lowest thresholds, corresponded to about 20% of the minimum bias event rate and the central event class, above the highest threshold, corresponded to about 10% of the minimum bias event rate. The remaining of the minimum bias cross section between central and peripheral event classes is referred to as the not-so-central event class. Taken together the three event classes were equivalent to the minimum bias event class. In normal run operation the central event class triggers were taken without prescale factor while the peripheral event triggers were typically downscaled by a factor of two and the not-so-central triggers were usually prescaled by a factor of 32 (after deadtime suppression) for the 1995 run period. For the 1996 run period the peripheral and not-so-central event classes were typically downscaled by a factor of 4 and 16, respectively. Downscaled beam triggers and in-spill pedestal triggers were also taken at a low rate as well as various out-of-spill calibration triggers for monitoring and calibration purposes for the various detectors. In order to obtain absolute cross section information, all trigger logic signals were counted with scalers before and after deadtime suppression, and after application of downscale factors. The scalers were recorded between spills.
In order to obtain the maximum data rate for the direct photon measurement, WA98 was operated with three different event types. The event types were distinguished by different groups of detectors with different readout deadtimes, varying up to about ms, ms, or ms for event types one, two, or three, respectively. Event type one included the trigger detectors, MIRAC, ZDC, Plastic Ball, and the photon spectrometer. Event type two also included the PMD, SPMD, and SDD. Event type three further included the tracking spectrometers. Zero-suppressed data volumes of about 50 kbyte/event were produced for central collisions. The experiment operated with a typical beam intensity of MHz 208Pb delivered to target over an effective SPS spill of about 2.5 s during the 14.4 s machine cycle. About 250 events were recorded per spill with a typical deadtime of about 80%.
C Photon Spectrometer
The WA98 photon spectrometer consists of a large area lead-glass detector array, LEDA, supplemented with a charged particle veto (CPV) detector placed immediately in front of it (see Fig. 1). The spectrometer has an unobstructed view of the target through the vacuum chamber exit window at the entrance to the GOLIATH magnet. The photon spectrometer is separated into two nearly symmetric halves above and below the beam plane in the two regions of reduced charged particle density which result from the sweeping action of the GOLIATH magnet. The two detector halves are inclined by an angle of such that photons near the center of the detector impinge with normal incidence. The maximum deviation from normal incidence to the detector surface is less than at the detector corners. The perpendicular distance to the front surface of the lead-glass is 22.1 m. This distance was chosen to allow the photon measurement near mid-rapidity while maintaining a maximum local particle hit occupancy below 3, which is necessary to insure that overlapping shower effects remain manageable.
The acceptance of the photon spectrometer for and detection, in rapidity and transverse momentum of the or , is shown in Fig. 2. The acceptance is calculated for a 750 MeV photon energy threshold. The acceptance in part a) is shown for detection of a single photon from the decaying . It indicates the phase space region over which ’s contribute photons into the acceptance of the spectrometer. The acceptance for simultaneous detection of both photons from the and two-photon decay branch is shown in parts b) and c), respectively. The acceptance covers the region , near mid-rapidity ().

1 Lead-Glass Detector
The lead-glass detector comprises 10,080 individual lead-glass modules. Each module is a cm3 (14.3 radiation lengths) TF1 lead-glass block with photomultiplier readout. The sides of each block are wrapped in an aluminized mylar reflective foil and sealed in a PVC plastic shrink tube of 0.15 mm wall thickness. Twenty-four lead-glass modules are epoxied together in an array 6 modules wide by 4 modules high to form a super-module. Each super-module has its own calibration and gain monitoring system based on a set of 3 LEDs mounted inside a sealed reflecting front cover dome [56]. Each lead-glass module views the reflected LED light through an aperture on the front surface, while the LED light is simultaneously monitored by a PIN-photodiode.
All 10,080 lead-glass modules were calibrated with 10 GeV electrons in the X1 beamline in the west area of the CERN SPS during the period of fall 1993 to spring 1994. The calibration beam was used to determine the GeV equivalent of the photodiode-normalized LED light viewed by each lead-glass module. The LED system allowed the calibration to be maintained after the lead-glass was installed in the WA98 experimental area with a new readout system. The energy and position resolution, and the non-linearity of the lead-glass detector were measured in the same test beam using electrons of incident energies from 3 GeV to 20 GeV. The measured energy resolution could be parameterized as [56]
| (1) |
and the measured position resolution could be parameterized as
| (2) |
with energy measured in GeV.
Each lead-glass module is read out by an FEU-84 photomultiplier with individually controlled high voltage. The high voltage is generated on-base with custom developed [57] Cockcroft-Walton voltage-multiplier type bases. The bases are controlled using a VME based processor and controllers. The photomultiplier signals are digitized with a custom-built ADC system [58] which was installed in the fall of 1994. The system features a fast shaping amplifier with dual gain ranges separated by a factor of 8 in gain. Each gain range is digitized with 10-bits resolution for 13-bits of effective dynamic range. The ADC system includes an analog memory in which the integrated signal is sampled and stored at 20 MHz in a ring buffer 16 cells deep. The analog memory provides the latency needed ( ns) for the WA98 trigger decision without the need for cable delay of the photomultiplier signals. The readout system also includes a constant fraction discriminator with TAC for time-of-flight measurement, and overlapping module current sums for possible trigger purposes, neither of which are used for the present analysis.
After calibration and installation in WA98 with the new readout system, the high voltage of each module was adjusted to set the full-scale ADC value at 40 GeV, based on the GeV-equivalent of the calibrated LED light. During the period of datataking, the LED system was pulsed and all lead-glass modules and photodiodes were read out and recorded between spills at a frequency of a few Hz. These calibration events were used offline to provide time-dependent gain correction factors for each module. The gain correction factors were stored in a database and applied on a run-by-run basis in the offline analysis. The overall stability of the lead-glass system is indicated in Fig. 3 where the time-dependent gain correction, averaged over all lead-glass modules, is plotted as a function of time during the 1995 run period. The rms of the distribution of module gains at a given time is indicated by the vertical bars. The smallness of the rms values throughout the run period demonstrates the stability of the high voltage and readout systems while the diurnal variation of the average gain factors suggests a sensitivity of the photomultiplier gains to the temperature in the experimental hall. Fig. 3 gives a good indication of the magnitude and importance of the time-dependent gain corrections which have been applied.

2 Charged Particle Veto Detector
In order to tag and thereby directly deduce the fraction of showers observed in the lead-glass originating from charged hadron, the photon spectrometer is supplemented by a Charged Particle Veto (CPV) detector which covers the lead-glass region of acceptance [59]. The two sections of the CPV each consist of 86 Iarocci-type plastic streamer tubes in a single layer. Each tube is tilted by to avoid normal particle incidence which would result in a 7% geometrical inefficiency due to the streamer tube walls. The streamer tubes are operated with a gas mixture of 10% argon, 30% isobutane, and 60% carbon dioxide at atmospheric pressure. A streamer discharge induces a charge signal on externally mounted pads which have a size of 42 mm 7 mm. Groups of 16 pads are connected to a charge sensitive chip which converts a charge signal into a 6 bit ADC value. In total 49120 pads and 3070 chips are necessary to read out the 19 m2 active area of the CPV. The CPV detector is nearly transparent to high energy photons with only 2.0% of incident photons converting and producing detectable signals inside the streamer tubes. The CPV was under construction at the time of the 1995 208Pb run and was fully operational only for the 1996 run period. As a result, the CPV has been used in the analysis of the 1996 data set only.
By employing magnetic field off data, with straight-line trajectories from the target, the silicon pad multiplicity detector can be used together with the lead-glass detector to determine the average CPV efficiency in situ. The SPMD consists of four quadrants each divided into 1012 pads with 46 azimuthal divisions and 22 radial divisions. Each pad has roughly equal size in of about . The efficiency for detecting a charged particle in the SPMD was measured in a test beam to be better than .
III DATA ANALYSIS METHOD
In this section we discuss the WA98 direct photon analysis method. An overview of the method is presented followed by a discussion of the details of the photon identification criteria and the photon and efficiency determination. These are the main sources of systematical error in the present direct photon analysis. Next, the method to determine the charged particle contamination in the photon yield is discussed. Then the calculation of the photon background expected from radiative decays of long-lived resonances is described. Finally, the extraction of the direct photon excess is discussed.
A Direct Photon Analysis Overview
Due to the high photon multiplicity in central Pb+Pb collisions, and the limited photon spectrometer acceptance, it is not feasible to identify isolated single direct photons on an event-by-event basis. Instead, in the direct photon analysis presented here, the transverse momentum distribution of direct photons is determined on a statistical basis. In brief, the direct photon excess is extracted from the difference between the measured inclusive photon yield and the photon yield predicted from a calculation of the radiative decays of long-lived resonances. Among such decay photons, the and comprise the largest source, contributing roughly 97% of the photon yield according to the expected relative abundances of produced particles (see Fig. 28). Therefore, in order to maximize the sensitivity of the measurement to a direct photon excess, it is imperative to accurately determine the and yield.
In the WA98 measurement, the and yield are determined via their two-photon decay branch for exactly the same event sample for which the inclusive photon yield is measured. This eliminates all systematical error sources related to absolute cross section normalization or centrality selection. In fact, this analysis method allows to determine the decay background correctly even if data sets with very different centralities or run conditions were combined arbitrarily since the averaged decay photon distribution would follow directly from the averaged and distributions. Thus, for example, contributions from background sources such as a secondary target will not produce an apparent photon excess in this analysis, as long as their contribution to the and yield can be extracted from the two-photon invariant mass peaks. Such background sources would distort the extracted and transverse momentum distributions, but this distortion would also be reflected in the inclusive photon distribution. Similarly, a distortion of the photon momentum distribution due to a calibration error or non-linearity of the detector response would be reflected in the momentum (and mass) distribution of the reconstructed ’s and ’s. This means that the sensitivity of the direct photon search to detector calibration or non-linearity errors is reduced in this analysis. Furthermore, the momentum dependence of the invariant mass peak provides an in situ means to verify and quantify the accuracy of the detector calibration.
A major source of systematical error in the present analysis is the determination of the photon detection efficiency. Roughly speaking, since the photon detection efficiency enters quadratically in the efficiency correction of the yield extracted via its two-photon decay, but only linearly in the photon yield correction, an error in the photon detection efficiency directly modifies the apparent photon excess. Thus a major emphasis of the present analysis is to demonstrate an accurate determination of the identification efficiencies and associated systematical errors. This is accomplished by applying different photon identification criteria having very different efficiencies and sensitivities to backgrounds, and verifying that the final corrected results are consistent in all cases.
Another source of error may be due to mis-identified non-photon backgrounds. Since the number of charged hadrons exceeds the number of photons by about a factor of three at large transverse momenta, they pose a large potential background of apparent excess photons if mis-identified as photons. Fortunately, high energy hadrons deposit only a small fraction of their incident energy in the lead-glass detector (its 40 cm length is about one interaction length). As a result, showers with large energy deposit, or large apparent transverse momentum, are predominantly photons with a hadron contamination of only about . Since hadronic showers typically have large transverse dimension the hadron shower contamination can be further reduced by a factor of 2-3 by excluding showers with large width. Since the magnetic field alters the distribution and apparent transverse momenta of the charged hadrons while leaving the neutral particle distributions unchanged, a comparison of the extracted neutral shower result for magnetic field on and field off provides a consistency check of the charged hadron rejection. The Charged Particle Veto detector is used to determine the charged hadron contribution to the photon spectrum.
Another source of apparent photons is neutrons and anti-neutrons. This contribution is estimated by simulation only. Its contribution can similarly be reduced by excluding showers with large width. Consistency in the final result with different shower identification criteria and run conditions provides confirmation that the background contributions are properly eliminated.
B Particle Identification and Yield Determination
The most critical requirement of the direct photon search is an accurate determination of the inclusive photon and yields. In general, the accuracy of the yield determination is verified by using different identification criteria with large differences in efficiency and background sensitivity, and demonstrating consistent final results. The yield is largely insensitive to background particles since the ’s are self-identified by their mass peak in the two-photon invariant mass spectrum. The effect of background particles is mainly to increase the combinatorial background in the invariant mass spectrum which makes the problem of extraction of the peak content more difficult. On the other hand, charged hadrons and neutrons are significant backgrounds to the photon yield determination. In the present analysis, the Charged Particle Veto detector is used to identify charged hadron showers and remove the charged hadron contribution from the photon spectrum. At the same time, care must be taken not to remove converted photons from the photon or data.
The photon yield extraction involves the following steps:
-
-1.
The photon identification criteria are applied to the reconstructed showers and a photon candidate spectrum is accumulated.
-
-2.
The normalized target-out background photon candidate spectrum is subtracted, if necessary.
-
-3.
The CPV detector is used to determine the charged hadron contamination included in the photon candidate spectrum. The charged shower contribution is subtracted from the photon candidate distribution to produce the uncorrected neutral shower spectrum.
-
-4.
The neutral shower spectrum is corrected for photon conversions and for the reconstruction efficiency.
-
-5.
The neutron and anti-neutron contamination, based on simulation, is removed to produce the raw photon spectrum, within the lead-glass detector acceptance.
-
-6.
The raw photon spectrum is corrected for the geometrical acceptance to produce the final photon spectrum.
The (or ) yield extraction involves the following steps:
-
-1.
The photon identification criteria are applied to the reconstructed showers to produce a list of photon candidates for each event.
-
-2.
The invariant mass of each photon pair within an event is calculated and sorted into invariant mass histograms according to the of the photon pair. An invariant mass histogram is accumulated for each bin to be used in the final spectrum.
-
-3.
The photons are simultaneously used to construct artificial mixed events of similar multiplicity for each centrality class. The mixed events are analyzed in exactly the same manner as the real events to produce background invariant mass spectra as a function of .
-
-4.
The final mixed event invariant mass spectra are normalized and subtracted from the the final real event invariant mass spectra to remove the combinatorial background from the real event spectra.
-
-5.
The normalized target-out final invariant mass spectra are subtracted from the final invariant mass spectra, if necessary.
-
-6.
The final invariant mass spectra are analyzed to extract the content in the (or ) peak at each . The result is the uncorrected spectrum.
-
-7.
The spectrum is corrected for the reconstruction efficiency and losses due to photon conversions to produce the raw spectrum within the lead-glass detector acceptance.
-
-8.
The raw spectrum is corrected for the geometrical acceptance and photon energy threshold to produce the final spectrum.
For both the photon and analysis, the shower reconstruction itself involves the following steps [60]: First, all lead-glass detector modules with energy deposit are analyzed and contiguous modules are associated together as a cluster. The list of clusters is then analyzed to determine the number of local maxima in each cluster. Clusters with a single maximum are treated as single showers. Clusters with multiple maxima are assumed to result from overlapping showers, with one shower per maximum. The energy deposit in each module in the cluster is partitioned to the overlapping showers according to the distance of the module from the shower maxima, assuming all showers to have electromagnetic radial shower profiles. The individual showers are then analyzed to calculate the total shower energy, position, and spatial dispersion (width) [60]. The shower positions are calculated with a logarithmic weighting of the energy deposit [61] and are projected to the front surface of the lead-glass detector, correcting for the shower depth and the non-projective geometry. The distance from the shower position to the nearest hit in the CPV is also extracted. All of this information is recorded on Data Summary Tapes (DSTs) as an intermediate analysis step.
After application of the minimum energy threshold of 750 MeV used in the analysis and acceptance calculations, the showers are subject to various sets of further identification criteria. The different criteria result in varying non-photon background contaminations and photon () identification efficiencies, which must then be determined. In order to avoid shower distortions near the detector edges, or around “dead” detector modules, an edge cut is applied to require that the reconstructed shower position lies beyond a specified distance from the detector edges or dead modules. A distance cut of two module widths from the detector edge and 1.5 modules widths from the center of a dead module was used.
In the present analysis, the photon selection has been made with the following shower identification criteria:
-
S1.
Use all reconstructed showers.
-
S2.
Use only narrow showers which have a dispersion (width) which is less than a specified value.
-
S3.
Use only showers which have no associated CPV hit.
-
S4.
Use narrow showers satisfying the dispersion cut with no CPV hit.
The first condition will have the highest photon identification efficiency but largest non-photon background contribution, while the last condition will have the lowest efficiency but lowest background contributions. For the extraction of the photon yield, the criteria S1 and S2 are not entirely independent from the criteria S3 and S4 since the CPV detector is used in the first case also to determine the charged hadron contamination. The distinction is mainly in the manner in which the data is processed and in how the corrections are applied. In particular, with criteria S3 and S4 the neutral shower distribution is acquired directly, but must be corrected for photons which were rejected due to random associated hits in the CPV, or due to photon conversions, while for criteria S1 and S2 the charged shower distributions are extracted using the CPV and corrected for random associated hits and conversions and then the corrected charged shower contribution is removed from the total shower distribution to obtain the neutral shower distribution. For the yield extraction the CPV is not used at all when criteria S1 or S2 are used with the result that no corrections for random CPV hits are needed and smaller conversion corrections are required. Criteria S2 and S4 make use of the fact that the transverse size of hadronic showers, with large energy deposit, is significantly greater than that of electromagnetic showers in the lead-glass calorimeter. The cut on the shower dispersion is chosen to accept more than of the isolated photon showers while rejecting hadron showers by a factor of 2-3. However, the shower dispersion cut is more likely to lose electromagnetic showers in the case of shower overlap.
For additional consistency checks, the data has also been analyzed with the shower energy threshold increased from 750 MeV to 1.5 GeV, with the outer edge module cut increased to three module widths, and with a photon energy asymmetry cut applied in the analysis.
C Particle Reconstruction Efficiency
The large particle multiplicities in central Pb+Pb collisions result in module occupancies in the WA98 lead-glass detector of up to , which poses a special problem for the direct photon search. These large occupancies result in overlapping showers in which photons may be lost, mis-identified, or significantly altered in position or energy. This results in a significant dependence of the photon and identification efficiency on the centrality of the collision. Furthermore, the position and energy resolution, and even the energy scale, will be centrality dependent due to the effect of shower overlap. For an accurate direct photon search it is imperative to accurately determine and account for these effects. For the present analysis this has been accomplished by the method of randomly inserting test showers into real events and studying how they are altered and the efficiency with which they are recovered. This procedure has been used to determine the , , and reconstruction efficiency.
For this reconstruction procedure the WA98 experiment geometry was implemented in GEANT [62] with the GEANT tracking parameters for LEDA adjusted to reproduce test beam measurements of the LEDA response to electrons. The generation and transport of Čerenkov photons in GEANT was parameterized and this parameterized Čerenkov response was used in the full WA98 GEANT simulation due to the prohibitive CPU-time consumption of the full Čerenkov tracking in GEANT. Single ’s (’s) were simulated with a uniform distribution in transverse momentum and pseudo-rapidity over the LEDA acceptance and the decay photons were tracked through GEANT. The simulated LEDA response was recorded to create a library of photon test showers in the form of digitized LEDA signals. Only simulated ’s with both decay photons in the nominal LEDA acceptance were recorded. The reconstruction efficiency was then extracted with the procedure illustrated in Fig. 4. First the raw data were calibrated and the event was characterized by the trigger detectors and other detectors of WA98. Then three passes were made through the LEDA event analysis software. In the first pass, the calibrated LEDA data was analyzed to perform the clustering and shower characterization as described above. The position, energy, shower dispersion, and distance to nearest hit in the CPV were saved for all identified showers together with the calibrated information from the other WA98 detectors. Next, a event was read from the shower library and inserted into an empty LEDA raw event. Simulated signals in dead modules were eliminated and the event was then analyzed as a real event. The shower information reconstructed from the simulated showers in the empty LEDA was recorded together with the primary and photon information prior to the GEANT response. Finally, the real LEDA event was overlaid with the simulated LEDA event and the signals were summed. Then the superimposed event was analyzed. In this step the position, energy, shower dispersion, and distance to nearest hit in the CPV were saved only for all new showers which were not in the list of showers found in the original raw event. Also, all showers of the original event found to be missing from the reanalyzed overlap event were marked as lost. All of this information was stored for each event in a single pass through the WA98 raw data and recoded on the Data Summary Tapes. Thereafter the data analysis was performed from the DSTs since they could easily be analyzed multiple times, or simultaneously, with different shower selection criteria.
In order to determine the photon reconstruction efficiency it is necessary to determine which shower in the overlap event corresponds to the simulated photon incident on the LEDA. In the first step, the empty LEDA GEANT shower information is analyzed to determine the reconstructed position of the highest energy shower in the vicinity of the incident GEANT photon. The overlap event is then analyzed to find the shower nearest to that position. If that shower has less than twice the energy***The factor of two change in energy criterion determines who “eats” whom when showers overlap and is necessary to avoid double counting. of the shower in the empty LEDA event it is taken as the reconstructed photon. Otherwise the photon is considered to be lost. After the associated shower is identified, it is tested to determine whether it passes the photon energy threshold requirement and whether it passes the detector edge cut. Also, if its position falls on the location of a so-called “bad” module with questionable gain, as described below, it is eliminated. Finally, it is tested against the various shower identification criteria S1-S4 described above.
The efficiency corrections are made as a function of the measured transverse momenta. The photon reconstruction efficiency can be constructed as a two-dimensional response matrix which transforms the transverse momentum of the incident photon into the transverse momentum of the reconstructed test shower, if it passes all identification criteria (the reconstructed transverse momentum is set to zero if the criteria are not satisfied). This two-dimensional efficiency matrix must then be inverted and applied to the measured transverse momentum distribution to obtain the final efficiency corrected result [63]. Alternatively, the efficiency can be applied as an iterative one-dimensional correction. In this case, one-dimensional histograms are accumulated of the incident transverse momentum and reconstructed transverse momentum with each entry weighted according to the final transverse momentum spectrum and rapidity distribution. The reconstruction efficiency is given as the ratio of reconstructed to input distributions. This one-dimensional efficiency determination must be iterated until the weighted input distribution matches the final measured distribution.

The reconstruction efficiency is similarly obtained by requiring that the showers from both of the decay photons simultaneously pass the photon identification criteria. The mass and transverse momentum is then calculated from the momenta of the two reconstructed photon showers. It is then required that the reconstructed mass fall within the peak mass integration region, and it may be additionally required that the photons pass an asymmetry () cut on their reconstructed energies. The reconstruction efficiency is applied as a one-dimensional function of the transverse momentum. As in the photon case, the correction is determined from the ratio of reconstructed to input transverse momentum distributions. The input transverse momentum and rapidity weights must be adjusted by iteration until the assumed input transverse momentum distribution is the same as the final corrected distribution.
It should be noted that while these correction factors have been referred to as efficiency corrections, they might more properly be termed response corrections. They include essentially all detector effects other than the nominal detector acceptance. Specifically, they include the effects of detector edge cuts, dead and bad modules, energy resolution, and distortions or loss due to shower overlap, as well as the efficiency to satisfy the specified identification criteria. In particular, the correction for smearing due to overlap and energy resolution can result in efficiency correction factors which exceed unity.
D Background Calculation and Direct Photon Excess
As described above, the direct photon excess is obtained from the difference between the measured inclusive photon yield and the background photon yield expected from radiative decays of long-lived final state hadrons. The background photon yield in the WA98 LEDA acceptance is calculated by a Monte Carlo simulation of radiative decays of hadrons. The most important input to this calculation is the measured WA98 yield, which is extracted from the same data sample used to obtain the inclusive photon yield (see Fig. 4). Photons from decay account for about of the total expected background from radiative decays. It is important to note that the background photon yield attributed to decay includes both directly produced ’s, as well as those from hadronic decays with ’s in their final state. Thus, photons resulting from the decay branch of the are taken into account via the measured yield. On the other hand, the lifetime of the is sufficiently long that few of the weak decays occur in front of the LEDA detector and therefore there is little contribution to the yield, and hence little contribution to the background photon yield. However, the weak decay of the to is a special case. The lifetime is such that a substantial fraction of the decays are distributed over the distance between the target and the LEDA detector. As with the contribution, those decays which occur beyond the LEDA distance do not contribute to the or background photon yield. On the other hand, photons from a produced in a decay will have correctly measured energies but will be assumed to be produced at the target location and therefore will have an incorrect opening angle. This will result in a reconstructed invariant mass which is incorrect. While decays which occur close to the target will have a reconstructed mass which falls into the identification window, and so its decay photon contribution will be included via the measured yield, some fraction of the decays will occur sufficiently far from the target that their decays will not be properly identified. Only this portion of the decay photon contribution must be included in the calculated photon background.
The decay of the is the second most important contribution to the photon decay background after the contribution. Together the and photon decays constitute approximately of the expected radiative decay background (see Fig. 28). Compared to the yield measurement the measurement is more difficult due to the smaller production rate, the smaller decay branching ratio, and the resulting smaller signal to combinatorial background ratio in the invariant mass distribution. In the present analysis, the yield is measured with modest statistical accuracy over a limited transverse momentum range due to these difficulties. In order to extrapolate the measured transverse momentum distribution into unmeasured regions it is assumed that the yield obeys -scaling. This is the phenomenological observation [64] that the differential invariant cross sections, plotted as a function of the transverse mass , for the various hadrons, , have the same form, , with a normalization factor, , which can vary but is found to be the same for many species:
| (3) |
Quite different theoretical explanations [65, 66, 67] can account for this observation. For various proton and pion-induced reactions at similar incident energies [68, 69, 70, 71, 72, 73, 74, 75] it is observed that the yield obeys -scaling to good accuracy [76]. A scaling factor relative to production of is obtained for the case of proton-induced reactions [76, 77]. Similarly, the yield is found to be consistent with -scaling in minimum bias sulphur-induced reactions [77] at 200 A GeV incident energy.
Collective transverse flow will affect the spectrum of produced particles according to their mass with the result that -scaling might be violated in collisions of very heavy ions. Evidence for collective transverse flow has been observed at the SPS for central 208Pb+208Pb collisions with estimated average transverse flow velocities as large as [78, 79, 80]. For a particle of mass and transverse momentum the effective inverse slope, or temperature , will be modified as [81]
| (4) |
where is the average transverse flow velocity and is the thermal temperature. While the modification of the transverse mass spectrum is seen to decrease with increasing , the effect can be significant. As an example, a transverse flow of would increase for the by about at GeV/c which would result in an increase of about in the yield at GeV/c.
It has been suggested that if chiral symmetry restoration occurs in the hot dense system formed in relativistic heavy ion collisions, then the masses of the and mesons might decrease with an associated increase in their production rates [82, 83]. These initial estimates suggested that the and yields might be increased by as much as a factor of 3 and 10, respectively. Once produced, the and are expected to interact relatively little in the dense matter with the result that they would survive to the final state to decay with their vacuum masses and contribute significantly to the decay background to produce excess photons and dileptons [82]. On the other hand, more recent calculations within the context of the non-linear sigma model suggest that the temperature dependence of the and masses and mixing are negligible [84]. In view of these significant uncertainties in the extrapolation of the yield from proton-induced reactions to central 208Pb+208Pb collisions it is important to measure the yield directly for central collisions to provide experimental constraints on its possible contribution to the background photon yield.
Besides the and , other hadrons with radiative decays which may contribute to the background photon yield are listed in Table I [85]. The production rates of these other hadrons are not measured in this experiment. As for the , their production has been assumed to follow -scaling with the same spectrum as the measured spectrum and with relative normalizations (equivalent to the asymptotic ratio as ) given in Table I. Within experimental errors the ratio independent of incident energy for the and [64, 73, 75, 86] and for the [86]. For the a ratio of [87, 88, 89] is observed for proton-induced reactions with indications for an increased ratio for nucleus-induced reactions [89, 90].
Of the other radiative decays listed in Table I only the and are expected to contribute more than one percent of the background photons (see Fig. 28). The is notable in that it might be significantly enhanced due to the mechanism discussed above. While the production rate is not determined in the present measurement, it can be constrained by the measurement due to its branching ratio to .
To summarize, the background photon yield in the acceptance of the WA98 lead-glass detector is calculated by a Monte Carlo simulation of radiative decays of all hadrons listed in Table I. The various hadrons are assumed to have the same transverse mass spectrum as the measured WA98 transverse mass spectrum for each event class. The yields of the other hadrons relative to the yield are given by the -scaling factors listed in Table I. The one exception is the scaling factor for central 208Pb+208Pb collisions where the measured -scaling factor is used. The Monte Carlo program uses the JETSET 7.3 routines [91] to implement the hadron decays with proper branching ratios and decay distributions. The hadrons are assumed to have a Gaussian rapidity distribution centered on mid-rapidity with a width of according to measurements for 208Pb+208Pb collisions [92].
| State | Decay Branch | ||||
IV DATA ANALYSIS DETAILS
In this section, detailed results are presented for the extraction of the , , and yield and their error estimates, as required for the direct photon analysis. First, a description of the data sample selection is presented. This is followed by a discussion of the analysis involving the Charged Particle Veto detector. The CPV is used to determine the charged particle contamination in the photon shower sample. Next follows a description of the details of the extraction of the inclusive photon transverse momentum distributions, including a discussion of the background contributions from charged particles and neutrons, and losses due to photon conversions. The photon identification efficiency for the various methods is discussed together with a summary of the estimated systematical error on the inclusive photon measurement. Next, the yield extraction is described. This includes a discussion of the yield extraction method, efficiencies, backgrounds, and systematical error. Finally, the yield extraction is described. The final results and the extraction of the direct photon excess are described in the following section.
A Data Selection
The present analysis has been performed using the event samples summarized in Table II. The data have been taken over six week run periods in 1995 and in 1996 with the 158 A GeV 208Pb beam of the SPS on 208Pb targets of 495 and 239 mg/cm2, respectively. During both run periods most data were taken with the GOLIATH magnet on, as required for the WA98 tracking spectrometer measurements. The minimum bias cross sections for the various data sets, after subtraction of the target out backgrounds, are given in Table II. Because of the change in the apparent transverse momenta of the charged particles due to the deflection in the magnetic field, the apparent transverse energy measured in MIRAC is increased with magnet on compared to the actual transverse energy. With the fixed low transverse energy trigger threshold, this resulted in larger minimum bias cross sections for the magnet on data sets. During the 1995 datataking period the vacuum exit window at the entrance to the GOLIATH magnet produced a significant background of downstream interactions which satisfied the minimum bias transverse energy threshold. These downstream interactions were eliminated by requiring an interaction at the target location by the requirement of a hit in the Plastic Ball in the angular region from to using the Plastic Ball trigger (described in Sec. II A) in coincidence with the minimum bias trigger. For the 1996 run period, the vacuum exit window was changed resulting in fewer downstream interactions. As a result, the Plastic Ball trigger was not required in the online trigger which resulted in less biased minimum bias cross sections. The rms variations of the minimum bias cross sections determined on a run-by-run basis are also given in Table II. The measured variation gives an indication of the uncertainty in the measured absolute cross sections due to normalization and background corrections. The background corrections were obtained from special empty target runs with no target in the target location. Due to the lower event rates, and resulting low deadtime and lack of need to be downscaled, the empty target data was taken with similar number of integrated beam triggers as obtained for the Pb data. Specifically, the 1995 and 1996 empty target data corresponded to a factor of 2.3 and 1.4 fewer beam triggers than the 1995 and 1996 Pb target data, respectively.
| Run Period | 208Pb Target | Minimum Bias | ||
|---|---|---|---|---|
| Thickness (mg/cm2) | (mb) | |||
| 1995 Field On | 495. | 6192. (56.) | ||
| 1995 Field Off | 495. | 5971. (30.) | ||
| 1996 Field On | 239. | 6451. (53.) | ||
| 1996 Field Off | 239. | 6202. (58.) |
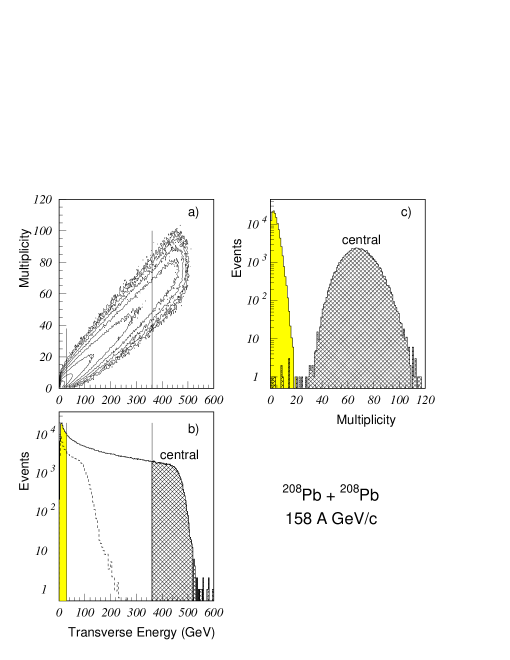
The direct photon analysis has been performed for event selections corresponding approximately to the most peripheral and most central portions of the minimum bias cross sections. These event classes are defined by cuts on the total transverse energy, measured in MIRAC, as calculated in the offline analysis. The selections correspond closely to the online trigger event classes described in Sec. II B. More precisely, the transverse energy cut which defines the central event sample was chosen to correspond to a most central cross section of 635 mb, or impact parameters less than about 4.5 fm, for all data sets. Similarly, the transverse energy cut which defines the peripheral event sample was chosen to correspond to a cross section of 4910 mb above the transverse energy cut, or to a peripheral event sample with impact parameters greater than about 12.5 fm. Due to the variation of the minimum bias cross section for the different data sets analyzed (see Table II), the meaning of the peripheral event class (for example, as reflected in the particle multiplicity) depended on the data sample. These event class definitions are shown in Fig. 5 for the 1995 magnet on data set where the multiplicity of showers in the lead-glass fiducial region with energy above 750 MeV is plotted versus the total transverse energy. The projections onto each axis are also shown. Similar transverse energy cuts are used for the event class definitions for both the 1995 and 1996 data sets. However, quite different cuts are used for the magnet on and magnet off data sets due to the change in the apparent transverse energy scale noted above.
We note that while the central event samples in the four data sets should be very similar in terms of the impact parameter range selection and particle multiplicity, the peripheral event samples of the different data sets are likely to be more variable. This is due to the rapid variation of the overlap geometry in the peripheral region and the variations in the minimum bias cross section and background corrections for the four data sets noted above.
In the offline analysis the various trigger signals are checked to remove events with inconsistent trigger information and to remove events with another beam particle within 100 ns or another interaction within about 300 ns of the triggered event. These trigger cuts discard about of the events. For the 1996 data set the Plastic Ball trigger was not required in the online trigger or used in the offline analysis for the final data sample. However, events which did not satisfy the Plastic Ball trigger requirement were used in the offline analysis to investigate the downstream interaction contributions in more detail. Since the downstream interactions are on light materials, such as air, mylar, and aluminum () and have underestimated emission angles, they produce small measured transverse energies with the result that their contamination is almost entirely in the peripheral event sample (see Fig. 5). The peripheral data sample for the 1996 data set was smaller than that for the 1995 data set due to the factor of two larger prescale factor used in the 1996 peripheral trigger.
In addition to a selection of the data sample based on trigger cleanup cuts, the lead-glass shower data was analyzed in a preliminary scan of the data and modules with questionable gain were eliminated for the subsequent analysis. This selection was made by accumulating the shower energy spectrum for each individual module where the shower centroid was within that module. The results were compared to the average dependence across the detector surface. Modules whose spectrum deviated from the average behavior, with rather strict criteria, were flagged as bad. In the actual data analysis, showers with positions within a module which was flagged as bad were eliminated. As a result of the rejected bad modules and the modules eliminated around the edges of the detector and dead modules, the effective LEDA acceptance was reduced by about 40%.
B Charged Particle Veto
The Charged Particle Veto detector provides essential information for the photon analysis. It allows charged showers in LEDA to be identified and associated with charged hadrons or photon conversions (see step G3 of Sec. III B). When the photon selection is made without invoking the CPV directly in the shower identification criteria (criteria S1 and S2 of Sec. III B) then the CPV is used to accumulate the transverse momentum spectrum of charged LEDA showers. This spectrum is corrected for the -independent CPV efficiency and then subtracted from the total LEDA shower transverse momentum spectrum to obtain the neutral shower transverse momentum spectrum. The charge/neutral ratio is extracted and fitted as a function of the transverse momentum and used to calculate a correction factor applied to the total shower spectrum to obtain the neutral shower spectrum. The neutral shower spectrum is then corrected for neutrons and anti-neutrons, and for conversions to obtain the raw photon spectrum.

Alternatively, the CPV can be used directly in the shower selection criteria to choose non-charged photon candidates (criteria S3 and S4 of Sec. III B). However, because the CPV detector was fully installed and operated for the 1996 run period only, it was not possible to perform the analysis with the CPV in this way for the 1995 data sample. Instead it was necessary to extract the charge/neutral correction from the 1996 data sample and apply this correction to the 1995 data. Therefore it was important to verify the consistency of the two methods in which the CPV information was used.
In the shower analysis procedure described in Sec. III C, each shower in the list of individual localized showers in LEDA is compared with the list of hits in the CPV and the distance between the LEDA shower position and the nearest CPV hit position is recorded. An example of this distance distribution is shown in Fig. 6a) for showers in peripheral collisions with transverse momenta GeV/c. The distribution shows a clear peak at small veto distance with a long tail extending to large veto radii. The long tail results from random associations between showers in LEDA and hits in the CPV. The veto radius distribution of these random associations is also shown in Fig. 6a). This distribution is extracted from the veto distance distribution obtained for the GEANT test photons introduced into the LEDA event, as described in Sec. III C. Since these test showers have no correlated hit in the CPV their veto distance distribution is strictly random. The random hit distribution is normalized to the distribution for real LEDA showers at large veto distance and subtracted from the distribution for real showers to obtain the distance distribution of real charged showers shown in Fig. 6b). While the random veto contribution is quite small for peripheral collisions, the detector occupancies are much greater in central collisions with the result that there is a much higher probability for a CPV hit to be randomly associated with a shower in LEDA. This is shown in Fig. 7 where the same veto distance distributions are shown for central collisions. In this case the correction for the random CPV hits is essential.

Based on these distributions, showers with a CPV hit within a distance cut of 8 cm are tagged as charged showers. For the analysis methods S1 and S2, in which the CPV is used to extract a charged/neutral correction factor, the charged shower yield is extracted for each bin as the random subtracted yield in the veto peak within the 8 cm distance cut. The result is the charged shower distribution which is then used to obtain the charged/neutral shower correction factor as a function of . The charged/neutral shower ratio as a function of the shower energy is shown in Fig. 8 for peripheral collisions using a 8 cm distance cut. The peak in the spectrum at about 550 MeV is due to non-showering hadrons which pass through the lead-glass and deposit similar energy by only. A minimum shower energy threshold of 750 MeV has been applied in the present analysis to eliminate this minimum-ionizing particle, or MIP, peak from the photon candidates. It is seen that the charged hadron background differs for the magnet on and magnet off run conditions.

For the analysis methods S3 and S4 charged hadrons are rejected directly from photon candidate showers by an associated CPV hit within the 8 cm distance cut. In this case there is no charged/neutral correction necessary to the photon candidate spectrum. On the other hand, the loss of photon showers due to random vetos and conversions is treated as an efficiency loss which is then taken into account at a later step in the efficiency correction (see Sec. IV C 3).
The charged shower identification must be corrected for the efficiency of the Charged Particle Veto. As mentioned in Sec. II C 2, the CPV efficiency has been determined in situ using LEDA and the Silicon Pad Multiplicity Detector. The analysis is performed using magnet off data to allow straight line tracking between the SPMD and LEDA. Peripheral collisions are used to keep the detector occupancies low in order to minimize random hit associations. Hits in the SPMD are projected to the LEDA detector surface and associated with a hit in LEDA if they fall within the SPMD projected pad area. If a hit is found within LEDA the distance from the LEDA shower to the nearest hit in the CPV is extracted. The raw CPV efficiency, , obtained as the ratio of the number of CPV hits found to the number of SPMD-LEDA coincidence tracks, is shown in Fig. 9 as a function of the distance between the LEDA shower and the CPV hit. It is seen to increase rapidly up to a veto distance of about 15 cm and then increase very slowly for larger distances. This slow rise at large distances is due to random coincidences with hits in the CPV which artificially increase the apparent efficiency. The random CPV hit efficiency, , also shown in Fig. 9, is extracted by an event mixing technique in which the CPV data are taken from a different peripheral event than the one used for the SPMD-LEDA track. The CPV efficiency is corrected for such random CPV associations as . In addition, due to the SPMD inefficiency or interactions, there can be random coincidences between the SPMD and LEDA, for which a hit in the CPV would not be expected, which decrease the apparent CPV efficiency. The shape of the SPMD-LEDA random coincidence distribution is also shown in Fig. 9. A small additional correction is applied to to account for this effect.

As shown in Fig. 9, an asymptotic corrected CPV efficiency of is obtained for veto distance cuts greater than about 17 cm. It will be noted that this distance is considerably larger than indicated by the width of the veto distance distributions shown in Figs. 6 and 7. This difference is due to the fact that the CPV efficiency analysis uses all charged hits in the SPMD. Therefore it is dominated by charged hadrons which deposit very little energy in LEDA either due to poorly developed hadronic showers, or due to energy deposit by only. These low energy showers have very poor position determination in LEDA. This effect is also evident by the observation that the width of the LEDA-CPV correlation (see Figs. 6 and 7) increases at very low transverse momentum. As a result the RVeto distance cut is increased for low transverse momenta to insure that the asymptotic CPV efficiency is attained. The CPV efficiency is assumed to be 87% independent of transverse momentum.
During datataking, CPV readout errors occurred with apparently random frequency which resulted in loss of portions of the CPV data in the event. These errors were not excluded in the present analysis and account for most of the extracted CPV inefficiency. Since the readout errors resulted in loss of trailer information in the CPV data packets it was possible to identify such readout errors and determine the CPV efficiency for a data sample without readout errors. An intrinsic detector efficiency of better than 98% was obtained [59]. It was also possible to verify that the readout error rate did not vary with detector occupancy or with time during the run period. The readout errors occurred relatively frequently but affected only a small portion of the CPV data of an event when they did occur. Therefore rejection of all events in which a CPV readout error occurred would have resulted in an unacceptable reduction of the data sample.
C Photon Analysis
The method to extract the inclusive photon transverse momentum spectra are described in Sec. III B. In summary, the procedure is to remove the charged hadron contamination from the photon candidates or candidate spectrum, remove the neutron and anti-neutron contamination, correct for photon conversions, then correct for the photon identification efficiency, and finally to correct for the detector acceptance. The details of this procedure are described in this section.
1 Charged Particle Contamination and Conversions
The CPV detector is used to select charged showers. The charged shower transverse momentum distribution is constructed from the random corrected yield in the veto peak for each bin, as discussed in Sec. IV B (see Figs. 6 and 7). The random corrected charged shower distribution is then corrected for the CPV efficiency to obtain the total charged shower distribution. This corrected charged shower distribution includes both charged hadrons and photon conversions. Next, the corrected charged shower distribution is subtracted from the total shower distribution to obtain the raw neutral shower spectrum. The neutral shower spectrum is depleted uniformly as a result of photon conversions and must be corrected by a factor where is the photon conversion probability. The amount of conversion material between LEDA and the target was the same for both the 1995 and 1996 run periods. The air plus vacuum exit window contributed 5.4% to the conversion probability and the CPV material before the active volume of the CPV contributed an additional 2.0% to the conversion probability. Finally, the 1995 and 1996 target (half) thicknesses contributed an additional 3.0% and 1.45%, respectively. Thus the total photon conversion probability for the 1996 run period during which the CPV was in operation was .


The neutral shower spectrum, after correction for conversions, is subtracted from the total shower spectrum to obtain the final charged hadron shower spectrum. By this procedure the amount of contamination of the selected showers due to charged hadrons is determined for each shower identification criterion and for the magnet on and magnet off run conditions. The extracted ratio of charged/neutral showers under the condition to use all showers (S1) is shown in Fig. 10 for central and peripheral collisions and for magnet on and magnet off. The charged hadrons are seen to constitute about 20% of all showers at low decreasing to about 5% at the highest . When the shower dispersion cut is applied in the shower selection criterion (S2) the hadron contamination is reduced to about 5% nearly independent of as seen in Fig. 11. For comparison, simulation results are also shown for the case of magnet off. The simulation was performed using full VENUS 4.12 [93] events calculated for central 208Pb+208Pb collisions. All particles incident on LEDA were tracked with GEANT [62] with full tracking of the produced Čerenkov photons, which is the dominant component of the shower observed in the lead-glass. The results shown were obtained using the GCALOR hadronic shower package for hadrons [94]. Reasonably good agreement with measurement is observed. In addition, the GEANT calculations were performed using the GHEISHA and FLUKA hadronic shower packages. The GHEISHA results were in better agreement with measurement while the FLUKA results overpredicted the observed charged/neutral ratio with the GCALOR result intermediate between the other two results. The proper description of hadronic showers in the lead-glass is an especially severe test of the hadronic shower packages. Since only that component of the shower which produces Čerenkov light which reaches the photomultiplier contributes to the observed signal, the lead-glass response to hadrons is sensitive to details of the hadronic shower composition. For the charged/neutral corrections the measured results have been used. In contrast, the corrections for neutrons and anti-neutrons discussed below are, by necessity, based solely on the contributions calculated using GEANT.
The measured charged/neutral ratio spectra, , are fitted (as seen in Figs. 10 and 11) to remove statistical fluctuations and to extrapolate to high . The lowest bins are not used in the present analysis due to the sharply increasing rise in the hadron contamination.†††Note that while results will be shown to low for various intermediate analysis steps, the final results will be presented only for the region GeV/c due to various systematical error sources which increase at low . The fitted result provides the neutral/total shower ratio which is then used as a multiplicative factor to extract the neutral shower spectrum from the total shower spectrum. This charged hadron correction procedure was necessary for the analysis of the 1995 data set since there was no CPV measurement to extract the charged hadron contamination information. It also allowed to use the full 1996 data sample including periods when the CPV was not fully operational. It should be noted that the 1995 and 1996 run conditions and analysis procedures were the same, and so the amount of charged hadron contamination extracted from the 1996 data sample should be the same for the 1995 data sample. A minor difference between the two data samples is the thicker target used for the 1995 run period which resulted in an additional 1.55% conversion probability. For the magnet off data sample this is expected to have no effect since essentially all converted photons are identified as single showers, which means that the total shower spectrum is unchanged. Therefore the charged/neutral shower correction factor is the same nearly independent of the amount of conversions. For the magnet on run conditions the pair produced at the target will separate in the magnetic field and the total shower spectrum will depend on the amount of photon conversions. Therefore a small correction () for this effect has been applied to the charge/neutral ratio when used for the 1995 magnet on data. Based on the results shown in these figures, a conservative 30% uncertainty has been assumed for the charged/neutral ratio for the photon analysis.

The raw neutral shower multiplicity per event as a function of transverse momentum, uncorrected for neutrons, efficiency, or acceptance, are shown in Fig. 12. The results are shown for central and peripheral collisions for the sum of 1995 and 1996 data samples. The measured distributions extend over more than 6 orders of magnitude and extend to about 3 and 4 GeV/c for peripheral and central collisions, respectively. A flattening of the distribution is observed in going from peripheral to central collisions. Also shown is the distribution obtained for events satisfying the peripheral trigger condition for runs with no target. No events from empty target runs satisfy the central event trigger condition (see Fig. 5). The empty target data is seen to have a neutral shower multiplicity which is similar to the peripheral 208Pb+208Pb case but to fall more steeply with transverse momentum. The similarity is not surprising since the trigger selection on the transverse energy for peripheral Pb collisions will select events with a similar number of nucleon-nucleon collisions as for an empty target interaction. The no-target interactions most likely occur on light materials of the target wheel and vacuum system (aluminum or carbon). The steeper falling empty target spectrum results from the fact that many of those interactions occur on downstream materials and therefore have underestimated angles and correspondingly smaller apparent transverse momenta. Since the spectral shapes differ, the peripheral spectrum should be corrected for the effect of the empty target contribution. The true peripheral spectrum, , should be obtained from the raw peripheral spectrum, , and empty target spectrum as
| (5) |
where f is the fraction of empty target events to true Pb target events in the peripheral data sample. Based on the live-beam scalers, downscale factors, and number of peripheral triggers a value of is obtained for the results shown in Fig. 12 where the empty target results are obtained with the same trigger cleanup cuts as used for the Pb data. On the other hand, as will be discussed in regard to the result in Sec. IV D below, there are reasons to believe that the target out contribution to the peripheral data may be larger than indicated by the properly normalized empty target data. With the requirement of a coincident hit in the forward region of the Plastic Ball detector (see Sec. IV A) as for the 1995 data sample, the properly normalized fraction of empty target events in the peripheral data sample is only .
2 Neutron and Anti-neutron Corrections
The neutral shower spectra must be corrected for neutron and anti-neutron contributions to obtain the raw photon spectrum. For this correction it is necessary to rely entirely on results from simulation. The incident neutron and anti-neutron flux into the LEDA acceptance has been estimated using VENUS. In Fig. 13a) the VENUS predictions of the number of particles per decay photon are shown as a function of their incident transverse momentum for neutrons, anti-neutrons, and . In the region of greatest interest at high , the neutron flux is seen to exceed the flux by roughly an order of magnitude. Even the incident anti-neutron flux is similar to the flux at large . Fortunately, as for the charged hadrons, the neutrons and anti-neutrons deposit only a small portion of their incident energy in the lead-glass detector which results in a much reduced apparent transverse momentum.
The response of the lead-glass detector to the neutrons and anti-neutrons, and to photons was simulated with GEANT with full tracking of the produced Čerenkov photons. The resulting ratio of neutron+anti-neutron to total neutral showers as a function of their apparent transverse momentum is shown in Fig. 13b). The contamination is seen to be significantly reduced in comparison to the incident flux due to the small energy deposit. The contamination is dominated by the neutron contribution. Results are shown with and without application of the shower dispersion cut. It is seen that the requirement of a narrow photon-like dispersion significantly reduces the contamination from about 5% to 1-2%.
The results shown have been calculated using the GCALOR hadronic shower package [94] of GEANT. Calculations were also performed using the GHEISHA and FLUKA hadronic shower packages. GHEISHA predicted /neutral ratios which were nearly a factor of two lower than the FLUKA predictions while the GCALOR result was about 1-2% in value below the FLUKA result for the case of all showers. With the narrow shower condition applied GCALOR and FLUKA gave consistent results. While no hadronic shower package has been clearly demonstrated to be superior [95], we have chosen to use the GCALOR results, since GCALOR, as well as FLUKA, is considered to be more reliable for neutron transport.
The proton spectrum predicted by VENUS for central 208Pb+208Pb is considerably flatter than the measured spectrum reported by NA49 [96]. This would suggest that VENUS also overpredicts the neutron and anti-neutron yield at high transverse momentum, which would suggest a smaller contamination. On the other hand, VENUS also overpredicts the and hence inclusive photon yield at high [97]. The open points in Fig. 13a) show an experimental estimate of the neutron ratio based on the NA49 proton measurement and the present WA98 photon measurement. The NA49 proton transverse mass distribution (measured over the interval GeV/c2 [96]) has been fitted to an exponential with the integral yield normalized to the predicted VENUS neutron multiplicity. It is seen that the neutron ratio estimated from the experimental results is quite similar to that predicted by VENUS, even in the region extrapolated beyond the NA49 measurement. Moreover, after GEANT response the final neutral ratio is very similar to the VENUS result over the entire region. In view of the uncertainties inherent in comparing different experimental results with different event selections, especially for peripheral collisions, the VENUS predictions have been used for the neutron and anti-neutron corrections. Due to these uncertainties, and especially those uncertainties associated with the simulation of the neutron response, a 50% uncertainty has been assumed for the contribution to the photon result.

The neutral ratio is fitted (as shown in Fig. 13b)) and the uncorrected neutral spectra (see Fig. 12) are then corrected by the factor neutral to obtain the raw photon spectrum. The anti-neutrons comprise about one third of the total neutral correction. The result is the raw inclusive photon spectra which must then be corrected for the photon reconstruction efficiency and acceptance.
3 Reconstruction Efficiency
As described in Sec. III C, the photon reconstruction efficiency is extracted by the method of inserting GEANT photon test showers into real events and determining how the test showers are modified or lost. The efficiency is extracted as the ratio of the transverse momentum spectrum of found photons divided by the transverse spectrum of input photons. The input photon and its associated found photon are weighted such that the input distribution reproduces the measured transverse momentum distribution for each event class. The input weights are taken according to the raw photon distribution (see Fig. 12) for the initial efficiency result and the weights and resulting efficiency are iterated until the input distribution agrees with the final result.

The final photon identification efficiency results are shown in Fig. 14 for peripheral and central collisions in parts a) and b), respectively. The results are shown for the various photon idenification criteria (see Sec. III B): All showers (S1); Narrow showers surviving a shower dispersion cut (S2); All showers within an increased edge cut (detector edge dead region increased from 2 modules to 3 modules); All showers with no associated CPV hit (S3); and Narrow showers with no associated CPV hit (S4). As previously discussed, what is called identification efficiency should more properly be called a response correction. It includes acceptance losses resulting from the fiducial cuts to define the useable detector region as well as dead or bad modules eliminated from the analysis. The acceptance is calculated for the full geometrical area of the lead-glass detector while the identification efficiency corrects for modules removed from the acceptance in the analysis. The efficiency correction also includes resolution corrections which can increase the apparent efficiency to values greater than one.
For peripheral reactions it is seen that the photon identification efficiency is only about 60% independent of transverse momentum. This reflects the loss of acceptance due to such eliminated modules. The efficiency is seen to be slightly smaller with the increased edge cut reflecting the decreased fiducial region. Otherwise, the photon efficiency is nearly independent of the identification method for peripheral collisions. This indicates that few photons are lost by these identification criteria or by shower overlap effects.
In contrast, for central collisions a large difference in photon identification efficiency is obtained for the different identification criteria. For the case of using all recovered showers the efficiency is seen to rise strongly with transverse momentum. This is understood as a result of the increase in the shower energy, and hence its transverse momentum, as a result of absorbing the energy of underlying showers which have been overlapped. Due to the steeply exponential transverse momentum distribution of the photons (see Fig. 12) there is a large feeddown of showers from low to high when the shower energy is increased due to overlap. When the shower dispersion cut is applied this rise in the efficiency is dramatically reduced, indicating that many overlapping showers are eliminated because they are found to be too broad to be single photons (recall that the clustering algorithm separates obvious shower overlap clusters with multiple maxima into multiple clusters with single maxima). The photon identification efficiency is reduced further when it is required that there be no associated hit in the CPV detector. This reduction is due to the elimination of photon showers which overlap with charged hadrons which would otherwise appear as a single photon shower. As discussed previously (see Secs. III B and IV B), all photon identification methods use the CPV information to eliminate the charged hadron contamination. The difference between methods S1, S2 and methods S3, S4 is mostly a matter of procedure. In methods S3 and S4 in which the CPV is used directly to reject charged showers no charged hadron correction of the photon candidate spectrum is necessary. On the other hand, as seen in Fig. 14 the photon losses due to random overlap with charged hits are greater, resulting in a reduced photon identification efficiency.
The photon identification efficiencies are fitted (see Fig. 14) to remove fluctuations‡‡‡Note: The fluctuations for different identification methods are correlated since the efficiencies are extracted from the same simulated shower sample for all methods and the fitted efficiency corrections are applied to the raw photon spectra to obtain the final photon transverse momentum distributions which need only be corrected for the LEDA acceptance. The identification efficiencies obtained by iteration were compared to efficiencies obtained by the two-dimensional unfolding method III C . The systematical error on the photon identification efficiency is estimated to be 2%.
4 Systematical error
The systematical errors relevant for the direct photon analysis which contribute solely to the extraction of the inclusive photon yield are listed in Table III at two representative transverse momenta. The errors are estimated for the case of photons identified with the narrow shower criterion (S2). The 30% uncertainty in the charged/neutral measurement discussed in regard to Figs. 10 and 11 leads to the listed dependent uncertainty in the photon yield due to the charged particle background correction. Based on a comparison of the magnetic field on and field off results, and a comparison with and without the CPV requirement, a 0.5% uncertainty on the photon conversion probability has been assumed. The assumed 50% uncertainty on the neutron and anti-neutron contribution discussed in regard to Fig. 13 results in the listed dependent uncertainty in the photon yield. Finally a 2.0% uncertainty in the photon identification efficiency has been assumed. The systematical errors are added in quadrature to give the total systematical error on the photon yield measurement listed in Table III. Other sources of systematical error, such as the energy calibration and non-target backgrounds, which also affect the yield extraction will be discussed in Sec V D.
The total systematical error on the photon yield measurement can be investigated by comparison of the inclusive photon results obtained with the different photon identification criteria. In particular, it was shown above that the charged and neutron backgrounds are reduced by about a factor of two when the shower dispersion cut is applied. Also, the photon identification efficiencies are observed to vary by a factor of 2-3 for central collisions depending on the identification criterion (see Fig. 14). The results of such a comparison are shown in Fig. 15 for peripheral and central collisions where the photon transverse momentum spectra obtained with the various photon identification criteria are divided by the photon spectrum obtained using the criterion of all showers. Since the corrections are largest for the condition of using all showers, it is the method expected to have the largest systematical error, with errors which should be larger than those which have been estimated for the narrow shower condition. The dependent upper and lower systematical errors on the photon yield measurement are indicated by the horizontal lines. In general, to the extent allowed by the statistical uncertainties, one may conclude that the various results are consistent within the systematical error estimates.

D Analysis
The method to extract the transverse momentum spectra is described in Sec. III B. In summary, the procedure is to calculate the two-gamma invariant mass spectrum for each bin and extract the yield in the peak. This is done using the various photon identification criteria and run conditions and the final results are checked for consistency. While charged hadron and neutron contamination in the selected photon showers will not directly contribute to the peak and yield, they will contribute excess photon pairs in the combinatorial background which must be subtracted to obtain the yield in the peak. The large combinatorial background in the invariant mass distribution, especially for central collisions, poses a special difficulty for the analysis. After the raw yield is extracted it is corrected for the identification efficiency, and finally for the lead-glass detector acceptance. The details of this procedure are described in this section.
1 Yield Extraction
The two-photon invariant mass distributions for peripheral 208Pb+208Pb collisions are shown in part a) of Figs. 16 and 17 for photon pair transverse momenta in the range of GeV/c and GeV/c, respectively. The distributions are obtained using all showers which pass the 750 MeV energy threshold. While it is evident that the peak content can easily be extracted at high , it is seen that the peak sits on top of a rather large and broad background with a complicated shape for the case of low pair . This combinatorial background arises as a result of “random” combinations of photons within the detector acceptance where the pair of photons did not originate from the same radiative decay (e.g. different ’s) and hence the two photons have little or no correlation. Although correlations between the photon pairs could exist, such as from a residual Bose-Einstein correlation, or from a multi- decay final state, or from collective flow, it is expected that the shape of the photon pair combinatorial background depends mainly on the photon spectrum and on the detector acceptance. To accurately determine its shape without resort to a complicated fit procedure, an event-mixing technique has been used in which all photons of an event are paired with all photons of the next analyzed event within the same centrality selection. This procedure removes all resonance pair correlations but leaves some of the higher order correlations which might also exist in the real-pair background distribution. No attempt was made to impose cuts on the mixed event shower pairs to implement the effect of merging showers. This has the result that the mixed events are not expected to accurately reproduce the very low mass region of the real event mass spectra.
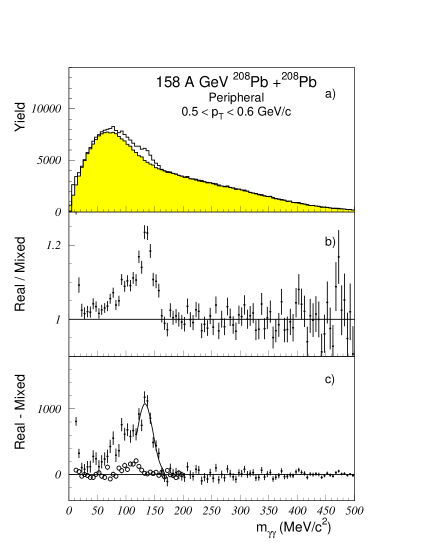
The mixed event invariant mass distributions are shown as the shaded histograms in part a) of Figs. 16 and 17. The ratios of the real to mixed invariant mass distributions are shown in part b). The ratios have been normalized to unity in the region outside of the mass interval. For peripheral collisions the normalization has been calculated as the ratio of integrated yields in the mass intervals and MeV/c2. The normalization extracted in this way was then fit to a smooth function of to determine the final mixed event background normalization. The normalized background subtracted results are shown in part c). The mixed event distribution is seen to provide a good description of the combinatorial background outside the mass region. However, a low-mass tail on the peak is observed at the lowest (see Fig. 16c). Such a tail can result from ’s produced downstream from the target, such as from decays (see Sec. III D) or from background interactions on downstream materials. This will be further discussed below.
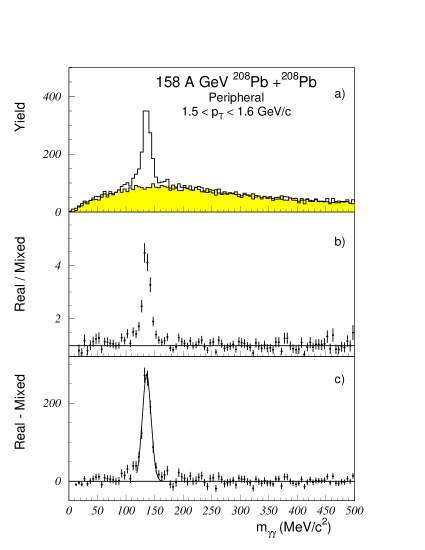
The invariant mass distributions for central 208Pb+208Pb collisions are shown in part a) of Figs. 18 and 19 for photon pair transverse momenta in the range of GeV/c and GeV/c, respectively. Due to the much higher photon multiplicity in central events (see Fig.5) the combinatorial backgrounds are much greater. As a result it is seen that the peak is hardly visible at low . In the same way as for peripheral events, the combinatorial background has been calculated using mixed events and normalized to the real event invariant mass distribution using the mass intervals and MeV/c2 with the normalizations fitted to a smooth dependence. The real/mixed event invariant mass distribution ratios are shown in part b) and the final normalized background subtracted invariant mass distributions are shown in part c). As for the case of peripheral collisions, the event mixed background is seen to provide a good reproduction of the combinatorial background in the region around the peak.
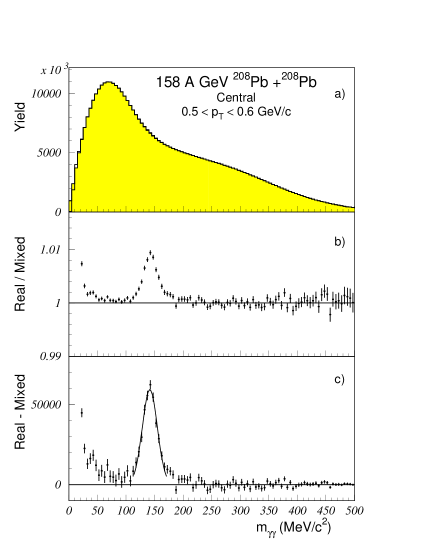
Several features of the results for central collisions are notable in comparison to the results for peripheral collisions. First, it is observed that the peak is broader and shifted to higher mass as compared to the case for peripheral collisions. This is due to the effects of shower overlap and the modification of the energy and position of the original shower. Secondly, the peak is seen to exhibit a long non-gaussian tail to high mass which is also attributed to shower overlap effects. And finally, the low mass tail on the peak at low is not present. The mixed event invariant mass normalization regions were chosen differently for central collisions due to these last two observations. In addition, the invariant mass distribution is observed to show structure in the very low mass region below about 50 MeV/c2. This structure is attributed to several effects, such as splitting of overlapping showers and the above-mentioned details of the treatment of the mixed events for nearby showers. It does not affect the analysis presented here and will not be discussed further.
The transverse momentum spectra are obtained by integration of the yield in the peak region of the combinatorial background subtracted invariant mass distributions for each bin. The integration regions used were MeV/c2 for peripheral collisions and MeV/c2 for central collisions. The wider integration region used for central collisions is due to the previously discussed high mass tail on the peak which results from overlap effects. The uncorrected transverse momentum distributions are shown in Fig. 20 for peripheral and central collisions. The results are obtained using the full 1995 and 1996 magnet on data sample with the narrow shower identification criterion (S2) (see Sec. III B). The distributions are observed to extend over about four orders of magnitude with similar coverage but lower statistical accuracy as compared to the inclusive photon result shown in Fig. 12. The distributions are observed to be cut off at low at around 0.5 GeV/c due to the acceptance limit (see Fig. 2) imposed by the 750 MeV shower energy threshold.
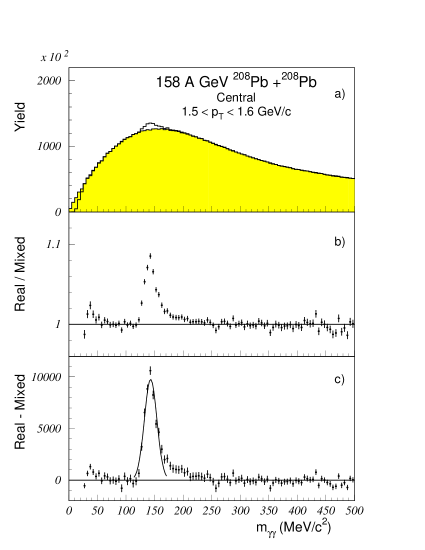
As noted in the discussion of the inclusive photon result, no empty target events satisfy the central collision trigger requirement with the result that no background corrections to the photon and spectra are necessary for central collisions. On the other hand, as discussed with regard to Fig. 16, the invariant mass distributions for low peripheral events show a low mass tail which suggests a contribution of ’s produced downstream of the target location. In principal, this can be verified by comparison to the distribution obtained for runs taken with no target. However, when the empty target events are analyzed with the trigger requirement of a hit in the forward region of the Plastic Ball detector to eliminate downstream interactions, as used for analysis of the peripheral events, no significant peak is observed in the empty target distribution. On the other hand, when the Plastic Ball hit condition is removed, a small low mass peak is observed in the empty target distribution, as shown by the open symbols in Fig. 16c. With the same Plastic Ball condition as used for the Pb target the empty target contribution is reduced by a factor of more than five (see the discussion of Fig. 12). Even with the Plastic Ball condition removed, the empty target yield, appropriately normalized according to the relative number of live beam triggers, is about a factor of three lower than the observed low mass yield with the Pb target.

The results shown in Fig. 16 are for the 1996 magnet on data sample. A slightly larger low mass contribution with a more distinctive peak at around MeV/c2 is observed for the 1995 data sample. As for the 1996 data, there is no such contribution seen for central collisions or for high peripheral collisions (the 1995 results are shown in Figs.17,18,19). The additional 1995 low mass contribution is attributed to downstream interactions on an aluminum ring on the vacuum exit window which was removed for the 1996 run period (see Sec. II A). For the 1995 run period the Plastic Ball hit requirement was implemented directly in the online trigger. With this condition, as for the 1996 run, no significant low mass contribution was observed in the 1995 empty target data. The explanation for these observations is that the Plastic Ball condition was in fact effective to remove downstream interactions when there was no target in place. However, when the target was in place, -electrons produced in the target could be detected in the Plastic Ball and satisfy the Plastic Ball trigger requirement. This meant that more downstream interactions could be accepted with target in place than without target. Nevertheless, even with the Plastic Ball trigger requirement removed, the empty target result is about a factor of three below the observed low mass excess, as noted above. This observation is not understood.
For the direct photon analysis the effect of the empty target contribution has been studied under two extreme assumptions. In the first case it has been ignored completely, while in the second case the result without the Plastic Ball condition has been renormalized to be as large as possible consistent with the result for the Pb target. That is, the empty target result was increased to remove as much as possible of the low mass excess in the distribution at low . While these two assumptions will give different photon and distributions, it might be expected that the direct photon result is not too dependent on this assumption as long as both the photon and yields from all sources are taken into account consistently. Finally, we emphasize again that this non-target background uncertainty is only relevant for the low (below GeV/c) peripheral data sample.

2 Reconstruction Efficiency
The procedure to determine the reconstruction efficiency is similar to the one for photons described in Sec. IV C 3. As described in Sec. III C, the reconstruction efficiency is extracted by inserting test ’s into real events and determining how the test ’s are modified or lost. The test ’s were initially generated uniformly in transverse momentum and pseudo-rapidity. Only those ’s which decayed to give two photons within the nominal LEDA acceptance were recorded and those photons were tracked with GEANT. The efficiency is extracted as the ratio of the transverse momentum spectrum of found ’s divided by the transverse momentum spectrum of input ’s. The input and its associated found are weighted such that the input distribution reproduces the measured transverse momentum distribution for each event class. The initial input weights are taken according to the raw distribution (see Fig. 20) after application of the acceptance correction and an initial estimated efficiency correction. The weights and resulting efficiency are iterated until the weighted input distribution agrees with the final result. The input distribution is weighted according to a Gaussian rapidity distribution centered on mid-rapidty with an rms width of [92], consistent with the final result.
After being superimposed onto real events the simulated ’s are considered to be found if both photons are recovered and the reconstructed invariant mass of the photon pair falls within the same mass window as applied in the analysis of the real events (see Sec. IV D 1). For an accurate efficiency determination it is essential that the simulated photon showers have the same characteristics as the measured photon showers. This can be verified by comparison of the extracted mass peak for real events with that of the simulated ’s after superposition onto real events. Such a comparison is shown in Fig. 21. The fitted mass and width of the peak are shown as a function of transverse momentum for central and peripheral event selections for the case of using all shower candidates (S1) for the invariant mass calculation. As noted in the discussion of the invariant mass spectra, the mass and width of the peaks are observed to be significantly larger for central collisions in comparison to peripheral collisions due to the effects of shower overlap. With the narrow shower condition (S2), the peak position is about 3 MeV/c2 lower and the peak width is about 1.5 MeV/c2 smaller for central conditions compared to the results shown in Fig. 21. The characteristics of the reconstructed simulated ’s are seen to be in good agreement with those of the real ’s for both peripheral and central event selections. This indicates that the energy calibration and resolution, and their modification due to detector occupancy effects, are accurately reproduced in the simulation and therefore are properly taken into account in the efficiency determination.

The final identification efficiencies are shown in Fig. 22 for peripheral and central collisions in parts a) and b), respectively. The results are shown for the various photon identification criteria (see Sec. III B): all showers (S1); narrow showers surviving a shower dispersion cut (S2); all showers with no associated CPV hit (S3); and narrow showers with no associated CPV hit (S4); all showers but with the photon energy threshold increased from 750 MeV to 1.5 GeV; shower pairs which satisfy an energy asymmetry cut . As previously mentioned, what is called the identification efficiency should more properly be called a response correction. It includes acceptance losses resulting from the fiducial cuts to define the useable detector region as well as dead or bad modules eliminated from the analysis. The acceptance is calculated for the full geometrical area of the LEDA while the identification efficiency corrects for modules removed from the acceptance in the analysis.
For peripheral reactions it is seen that the identification efficiency is only about 30%, nearly independent of transverse momentum, which reflects the loss of acceptance due to eliminated modules. With the 1.5 GeV shower energy threshold the efficiency is seen to drop sharply at low transverse momentum due to the loss of acceptance which results from the higher energy threshold. Similarly, the shower energy asymmetry cut results in a loss of acceptance, and hence a decreased efficiency, at large transverse momenta. Otherwise, the efficiency is nearly independent of the identification method for peripheral collisions. Again, this indicates that few photons are lost by these identification criteria or by shower overlap effects.
Similar to the photon identification efficiency, the efficiency dependence is quite different for the case of central collisions. A large difference in the identification efficiency is obtained for the different identification criteria. For the case of using all recovered showers the efficiency is seen to rise strongly with transverse momentum, exceeding the efficiency for peripheral collisions. This is understood as a shower overlap effect which results in an increase in the shower energy, and hence transverse momentum, as a result of absorbing the energy of underlying showers which get overlapped. Due to the steeply exponential transverse momentum distribution of the ’s (see Fig. 20) there is a large feeddown of the yield from low to high when the shower energy is increased due to overlap. When the shower dispersion cut is applied this rise in the efficiency is dramatically reduced, and becomes more similar to the result for peripheral collisions. This indicates that many overlapping showers are eliminated because they are found to be too broad to be single photons. The identification efficiency is reduced further when it is required that there be no associated hit in the CPV detector (methods S3 and S4). This reduction is due to conversions and the elimination of photon showers which overlap with charged hadrons which would otherwise appear as a single photon shower.
The identification efficiencies are fitted (see Fig. 22) to remove fluctuations§§§Note: The fluctuations for different identification methods are correlated since the efficiencies are extracted from the same simulated shower sample for all methods. and the fitted efficiency corrections are applied to the raw spectra to obtain the final transverse momentum distributions which need only be corrected for the LEDA acceptance. The systematical error on the identification efficiency is estimated to be 3% for peripheral collisions and 4% for central collisions.
3 Systematical error
The systematical errors relevant for the direct photon analysis which enter only for the inclusive yield extraction are listed in Table III at two representative transverse momenta. The errors are estimated for the case of photons identified with the narrow shower criterion (S2). Based on a comparison of the magnetic field on and field off results, and a comparison with and without the CPV requirement a 0.5% uncertainty in the yield due to photon conversions has been assumed. As mentioned above, the uncertainty in the identification efficiency has been assumed to be 3% and 4% for peripheral and central collisions, respectively. An important source of systematical error in the yield extraction at low for central collisions is the error associated with the combinatorial background subtraction. The statistical error of the combinatorial background subtraction is included in the statistical error on the yield. An additional systematical error of of the background yield has been assumed. This error contribution is estimated from the variability of the results at low for central collisions for the different analysis methods (see Fig. 23). Besides the small peak/background ratios at low for central collisions, the curvature of the background under the peak may futher complicate the extraction of the yield and increase the error beyond expectations from the magnitude of the background. The systematical errors are added in quadrature to give the total systematical error on the yield extraction listed in Table III. Other sources of systematical error, such as the energy calibration and non-target backgrounds, which affect both the photon and yield extraction will be discussed below.
As for the photon yield determination, the total systematical error estimate on the yield extraction can be investigated by comparison of the inclusive results obtained with the different identification criteria. The results of such a comparison for peripheral and central collisions are shown in Fig. 23 where the transverse momentum spectra obtained with the various conditions are divided by the spectrum obtained using the criterion of all showers (S1). Since the identification efficiencies vary by a factor of 2-3 for central collisions depending on the identification criterion (see Fig. 22) this comparison provides a sensitive indication of the accuracy of the efficiency determination. Also, the uncertainty in the peak yield extraction is probed since, for example, the application of the shower dispersion cut reduces the non-photon shower contamination and therefore improves the peak/background ratio by nearly a factor of two, which reduces the necessary background correction. Since the corrections are largest for the condition of using all showers, it is the method expected to have the largest systematical error, with errors which should be larger than those which have been estimated for the narrow shower condition. The dependent upper and lower systematical errors on the yield measurement are indicated by the horizontal lines. In general, to the extent allowed by the statistical uncertainties, one may conclude that the various results are consistent within the given systematical error estimates. The increasing systematical deviations at low transverse momentum for central collisions are due to the above-mentioned systematical error of the combinatorial background subtraction.

E Analysis
The method to extract the transverse momentum spectrum is similar to that used for the analysis described in Sec. III B and discussed in Sec. IV D. As for the , the procedure is to calculate the invariant mass spectrum for each bin and extract the yield in the peak. The extraction of the yield is much more difficult due to the lower production cross section and smaller branching ratio to two photons together with the very large combinatorial background in the invariant mass distribution. An example of the two-photon invariant mass distributions for central 208Pb+208Pb collisions in the mass region is shown in part a) of Fig. 24 for photon pair transverse momenta in the range of GeV/c. The distributions are obtained using all narrow showers which pass the 750 MeV energy threshold and include the full 1995 and 1996 magnet on data samples. The invariant mass distribution for real events is shown by the open histogram while the invariant mass distribution constructed with photons from mixed events is shown by the shaded histogram. The difference in the two distributions is scarcely visible, even in the peak region.
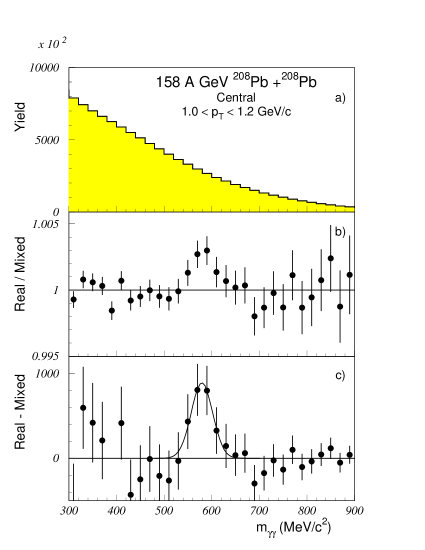
The peak yield is extracted in the same way as the yield extraction but with one additional step. To insure that the high mass tail of the peak does not affect the normalization of the background the content is first removed from the invariant mass distribution. This is done by extraction of the peak yield, as described in Sec. III B, and then subtraction of the corresponding invariant mass distribution of simulated ’s after event overlap, normalized to the same yield, from the invariant mass distribution. This removes the peak and high mass tail from the invariant mass distribution of real photon pairs. The ratio of the subtracted real event to mixed event invariant mass distributions is shown in part b) of Fig. 24. The mixed event background normalization is given by fixing to unity the ratio of integrated yields in the mass interval and above MeV/c2. The normalized background subtracted invariant mass distribution is shown in part c). While the peak is clearly seen to contain several thousand counts, the statistical significance of the peak is weak due the low signal to background ratio of less than . The peak is seen to be shifted to higher mass due to the effect of shower overlap in central collisions, similar to observation for the (see Fig. 21). The yield is obtained by integration over the invariant mass region MeV/c2.
The and yields are extracted from the invariant mass distribution for each transverse momentum bin and are corrected for identification efficiency, acceptance, and the two-photon decay branching ratios. The ratio of corrected yields, , is shown as a function of transverse momentum in Fig. 25. While the statistical error at each point is large, due to the large combinatorial background for extraction of the yield, there is a general tendency for a rise in the ratio with increasing . This is the expected behavior if the and yields have the same functional dependence on the transverse mass. The solid curve in Fig. 25 is the calculated ratio expected from the fit to the spectrum (see Fig. 26 and discussion below) assuming -scaling. The absolute normalization is the -scaling parameter which is fitted to the results of Fig. 25 to be (stat.)(syst.). A 20% systematical error has been assumed on the absolute normalization of the yield relative to the yield. This systematical error reflects the uncertainty due to the worse ratio of yield to combinatorial background in the region, and a less thorough investigation of the efficiency corrections due to the limited statistics.

Within errors, the fitted ratio is in agreement with previous results. A value of has been obtained from a compilation of previous measurements [76, 77] as discussed in Sec. III C and listed in Table I. The present measurement excludes any large enhancement of the yield in central Pb+Pb collisions as has been suggested might occur as a consequence of chiral symmetry restoration [82, 83] (see discussion of Sec. III C). The result also indicates that the -scaling assumption is valid, or at least not significantly distorted by collective flow effects, for the transverse momentum range of interest for the present direct photon analysis.
Finally, we note that due to the limited data sample and lower multiplicity it was not possible to obtain a significant measurement for the peripheral Pb+Pb event selection. Instead, -scaling has been assumed as given by the measured peripheral result with a -scaling parameter of .
V RESULTS
In this section the final inclusive and inclusive photon results are presented. The inclusive measurement is used, together with the result of the previous section, as input to a calculation of the expected inclusive photon distribution from radiative decays. The difference between the measured and calculated photon distributions is extracted as the direct photon excess. The measured excess is presented and discussed in comparison to other measurements and model calculations.
A and Production
The final inclusive transverse momentum spectra for central and peripheral 158 A GeV 208Pb+208Pb collisions are shown in Fig. 26. The results presented are the sum of the 1995 and 1996 data samples with magnet on. The details of the data selection have been discussed in Sec. IV A and the characteristics of the peripheral and central data samples are summarized in Table II. The distributions have been corrected for the identification efficiency and acceptance as described in Secs. III B and IV D. The indicated errors are the total statistical errors which include also the statistical errors introduced by the combinatorial background subtraction. The systematical errors on the yield extraction have been discussed in Sec. IV D 3 and will be summarized again in Sec. V D. It should be noted that the yield per event is given rather than the absolute cross section. For the direct photon analysis the measured photon multiplicity per event will be compared to the background multiplicity calculated from the measured yield per event for the same event sample. Therefore there are no systematical errors associated with the absolute cross section determination. Also, it is recalled that the definitions of the peripheral data samples were slightly different for the 1995 and 1996 runs so that the result presented is for an averaged peripheral class. The peripheral distribution has not been corrected for target-out background (see Sec. IV D).

The transverse mass distributions are observed to be nearly exponential over more than five orders of magnitude. On the other hand, the distributions exhibit a weak curvature which is best described by a power-law. The spectra have therefore been fitted with a QCD-inspired power-law functional form [98],
| (6) |
The fit region and fit results are shown by the solid curves in Fig. 26. The extracted fit parameter values are GeV/c, and with for peripheral collisions and GeV/c, and with for central collisions.
For the power-law functional form of Eq. 6 the local inverse slope is calculated as
| (7) |
The ratio characterizes the slope of the distribution as , while characterizes the strength of the curvature. The above fit results give and 249.8 MeV/c for peripheral and central collisions, respectively. The large fitted values of confirm the nearly exponential spectral shapes.
More properly [98, 99, 100], the invariant yields per event can be fitted to the same functional form to provide a similarly good description.
| (8) |
Fitting the invariant transverse momentum distributions in the region above 500 MeV/c gives fit parameters GeV/c, and with for peripheral collisions and GeV/c, and with for central collisions. This corresponds to and 173.4 MeV/c for peripheral and central collisions, respectively. The fitted slope and curvature parameters are similar to those which have been extracted for the invariant cross sections for sulphur-induced reactions [100].
The fit results of Eq. 6 shown in Fig. 26 are the main experimental input to the calculation of the radiative decay background. In addition, the fit result for central collisions has been used to fit the ratio shown in Fig. 25 assuming -scaling and to extract the -scaling ratio for central collisions, as discussed in Sec. IV E. The calculated inclusive photon distribution from radiative decays is compared to the measured inclusive photon distribution to extract the excess which may be attributed to direct photons.

B Inclusive Photon Results
The final inclusive photon transverse momentum spectra for central and peripheral 158 A GeV 208Pb+208Pb collisions are shown in Fig. 27. The results presented are the sum of the 1995 and 1996 data samples with magnet on, which is exactly the same data sample as used for the final and result. The details of the data selection have been discussed in Sec. IV A and the characteristics of the peripheral and central data samples are summarized in Table II. The distributions have been corrected for the photon identification efficiency and acceptance as described in Secs. III B and IV C. The indicated errors are statistical errors only. The systematical errors on the photon yield extraction have been discussed in Sec. IV C 4 and will be summarized again in Sec. V D. It is again noted that there are no systematical errors associated with the absolute cross section determination for the direct photon analysis. Also, it is again noted that the peripheral data sample definitions were slightly different for the 1995 and 1996 runs which means that the result represents an average peripheral class. The peripheral photon distribution has not been corrected for target-out background (see Sec. IV C 1).
Similar to the transverse mass distributions, the inclusive photon transverse momentum distributions are nearly exponential over more than six orders of magnitude. The inclusive photon distributions have been fitted with the power-law functional form of Eq. 6 with the fit region and results shown by the solid curves in Fig. 27. The extracted fit parameter values are GeV/c, and for peripheral collisions and GeV/c, and for central collisions.
The measured inclusive photon distributions are to be compared to the background inclusive photon distributions calculated from radiative decays of the and other hadrons to extract the direct photon excess.

C Background Photon Calculation
For each data sample or event selection in which the inclusive yield is extracted, the expected inclusive photon background from long-lived radiative decays is calculated using a Monte Carlo program which uses the JETSET 7.3 routines [91] to implement the hadron decays with proper branching ratios and decay distributions. As described in Sec. III D, the most important input to that calculation is the measured inclusive yield per event for the same event sample. In the present analysis, the direct photon excess is to be extracted for central and for peripheral Pb+Pb collisions. The peripheral data sample is used to provide a control measurement. Therefore, the fits to the final inclusive transverse momentum distributions of Fig. 26 are the primary input to the calculations. The output of the simulation is the calculated decay photon yield per into the LEDA acceptance. This calculated ratio, is to be compared to the measured ratio. Since the simulated distribution must agree with the measured distribution by construction, the difference in the measured and calculated inclusive yield per event gives the direct photon excess.
While photons from decay constitute the dominant source of background photons, other radiative decays are also included in the background calculation. The calculated fraction of the total background photons due to each of the various photon sources is shown in Fig. 28 for central Pb+Pb collisions. As discussed in Sec. III D, the yields of the various hadrons has been calculated with the assumption of -scaling. This implies that the transverse momentum distributions of the other hadrons are determined by the measured transverse momentum distributions. The -scaling normalization factors are taken from the literature as discussed in Sec. III D and given in Table I. The quoted -scaling factors are used for both peripheral and central collisions, with the exception that the measured -scaling value of extracted for the results shown in Fig. 25 and discussed in Sec. IV E is used for central collisions. As seen from Fig. 28, the radiative decay contribution is the most significant source of background photons, beyond the contribution.¶¶¶Note that decay photons from ’s which are themselves decay products of other hadrons are included in the measured decay contribution, and therefore not included as decay photons from the original hadron. As will be discussed in the next section, the uncertainty on the yield constitutes one of the largest sources of systematical error on the background photon calculation.
For the background calculations, a Gaussian rapidity distribution of particle production is assumed centered on mid-rapidity () with an rms width of according to measured results for photon production in 158 A GeV 208Pb+208Pb collisions [92]. Since the LEDA is near to mid-rapidity (see Fig. 2) the rapidity distribution varies little over the detector acceptance consistent with the width. As an extreme, the background calculation has been performed with the assumption of a flat rapidity distribution. Under this assumption the calculated background photon yield would increase by about 2% for all transverse momenta above GeV/c. The increase is greater at low with an increase in the photon yield of about 5% at MeV/c. This modest sensitivity to the assumed rapidity distribution can be understood from the limited acceptance for photons from ’s which are emitted away from LEDA, as seen in part a) of Fig. 2. More important however, is that the calculated ratio, which is the quantity relevant for the direct photon analysis, is much less sensitive to the assumed rapidity distribution. With the assumption of a flat rapidity distribution the ratio is increased by only 2% at MeV/c, 0.5% at GeV/c, with the size of the increase rapidly decreasing at higher transverse momenta. Therefore, one may conclude that the uncertainty in the calculated ratio due to extrapolation and uncertainty of the rapidity distribution is negligible.
D Direct Photon Excess
In this section the final direct photon result is obtained and compared to results from proton-induced reactions at similar and to model calculations. The direct photon yield is extracted as a function of the photon transverse momentum for central and peripheral 158 A GeV 208Pb+208Pb collisions. The results presented are the sum of the 1995 and 1996 magnet on data samples. The details of the data selection have been discussed in Sec. IV A and the characteristics of the peripheral and central data samples are summarized in Table II. As described in Sec. III A, the direct photon excess is extracted on a statistical basis as the difference between the measured inclusive photon distributions discussed in Sec. V B and the background photon distributions calculated from radiative decays of long-lived final state hadrons discussed in Sec. V C.
1 Results
Since radiative decays comprise the dominant source of background photons (see Fig. 28), it is instructive to first investigate the ratio as a function of the transverse momentum. As a result of the steeply falling transverse momentum spectra (see Fig. 26), photons of a given predominantly result from asymmetric decays in which the photon carries most of the momentum of the parent . (Since photons from symmetric decays carry roughly half of the parent momentum they are suppressed by the lower yield at the two times higher , compared to the asymmetric decay ’s.) Therefore, the error on the predicted photon yield at a given will be most strongly correlated with the error in the measured yield at a similar, slightly higher, . For the ratio many sources of systematical errors partially cancel, such as errors in the energy scale calibration for the measurement, or errors in the assumed rapidity distribution for the background calculation (as discussed in Sec. V C). Therefore a comparison of the measured and calculated ratios provides a sensitive indication whether a direct photon excess is observed.

The measured ratio for peripheral 208Pb+208Pb collisions is shown as a function of transverse momentum in part a) of Fig. 29. The solid points show the measured yield per event divided by the measured yield per event in the LEDA acceptance, fully corrected for efficiencies and backgrounds. The errors indicate the total statistical error on the ratio from the and yield extraction at each . The open points show the measured results additionally corrected for the and acceptances. The results shown are obtained using the photon identification criterion in which all showers are considered photon candidates (condition S1 of Sec. III B). This shower identification criterion provides the greatest and efficiency, but also requires the largest corrections and therefore has the largest expected systematical error. The measured result is compared to the predicted ratio shown by the solid curve in part a). The predicted result is from the Monte Carlo calculation of the background radiative decay photons discussed in Sec. V C which is based on the measured peripheral spectrum of Fig. 26. The simulation provides the yield per event of photons and ’s into the LEDA acceptance. The calculated result is also shown with the and acceptance corrections.
The predicted ratio from background decays is seen to be in good agreement with the measured results. This is shown more clearly in part b) of Fig. 29 where the solid points show the ratio of the measured ratio to predicted background ratio. Even without consideration of possible systematical errors, the rather good agreement between the measured and calculated ratio, within statistical errors, suggests that no significant direct photon excess is observed for peripheral collisions over the transverse momentum region of measurement.
The results in part a) and solid points in part b) of Fig. 29 have not been corrected for target out backgrounds. As discussed in Sec. IV C 1 the measured target out background rate implied less than 10% of the events of the peripheral data sample were due to non-target background. The photon multiplicities per non-target background event were measured to be similar to peripheral events, but with a steeper falling distribution (see Fig. 12). From the low invariant mass distributions for peripheral events (see Fig. 17) the non-target background events were deduced to be due to downstream interactions, as indicated by a peak shifted to lower mass, with indications for a non-target contamination larger than determined by the target out measurements, as discussed in Sec. IV D 1. The peripheral result has therefore been checked with the assumption of the maximum possible non-target correction consistent with the low mass structure observed in the low invariant mass spectra. It was only possible to do this for the 1996 data sample since no low mass peak was observed in the target out data for the 1995 run due to the Plastic Ball multiplicity condition requirement in the online trigger (see Sec. IV D 1). The result is shown by the open squares in part b) of Fig. 29. Due to the smaller 1996 peripheral data sample and the maximally increased target out correction of roughly 50% of the 1996 peripheral events, the statistical errors on the corrected results are very large. Nevertheless, the corrected is found to be consistent with the uncorrected ratio and confirms the lack of a significant photon excess for the case of peripheral collisions.

The corresponding ratio results for central 208Pb+208Pb collisions are shown in Fig. 30. The results are obtained using the photon identification criterion in which all showers are considered photon candidates, as was used for the results of Fig. 29. The background photon calculation is based on the measured central spectrum of Fig. 26 and uses the measured ratio for central collisions deduced from the results of Fig. 25. Compared to the result for peripheral collisions, the statistical uncertainty on the measured ratio for the case of central collisions is greatly reduced due to the slightly larger event sample, and more importantly, the much higher particle multiplicities per event.
In contrast to the case for peripheral collisions, the background calculation does not account well for the measured ratio for central collisions. Instead, an excess in the measured ratio compared to the background calculation is clearly seen in part b) of Fig. 30. The observed excess increases with up to about a 20% excess at high transverse momentum.
To determine whether the observed excess is significant, a detailed consideration of the various sources of systematical error is necessary. The final direct photon excess is to be extracted as
| (9) |
If the ratio is equal to one within errors, then no significant photon excess is observed. The ratio and its error are determined from the measured and calculated ratios. Since, by construction, within uncertainties we have
| (10) |
Additional systematical errors on which partially cancel in Eq.10 must also be included in Eq. 9. Furthermore, when the absolute excess photon cross section is extracted the absolute cross section normalization errors on must be introduced.
The total systematical error on is obtained from the separate error contributions to , , and . These various systematical error contributions to the direct photon result are summarized in Table III. The errors quoted correspond to the shower identification criterion of using narrow showers (S2), which minimizes the background corrections and therefore is expected to have the smallest systematical error. This shower identification criteria will be used to extract the final WA98 result. A comparison of the final result with the results of Figs. 29 and 30 where all showers (S1) have been used provides an additional check of the overall systematical errors. In general, many of the systematical errors are dependent on the transverse momentum and so must be estimated for each . The systematical errors are listed at 1 GeV/c and 2.5 GeV/c for peripheral and central collisions to give an indication of the and centrality dependence of the systematical error contributions.
| Source of Error | Peripheral Collisions | Central Collisions | ||
|---|---|---|---|---|
| GeV/c | GeV/c | GeV/c | GeV/c | |
| Charged Particle background+ | 1.7 | 2.2 | 1.3 | 1.3 |
| conversion correction+ | 0.5 | 0.5 | 0.5 | 0.5 |
| Neutrons+ | 0.6 | 1.0 | 0.9 | 1.9 |
| reconstruction efficiency+ | 2.0 | 2.0 | 2.0 | 2.0 |
| a) yield measurement | 2.7 | 3.2 | 2.6 | 3.1 |
| conversion correction∗ | 0.5 | 0.5 | 0.5 | 0.5 |
| yield extraction∗ | 0.3 | 0.1 | 5.1 | 1.0 |
| reconstruction efficiency∗ | 3.0 | 3.0 | 4.0 | 4.0 |
| a) yield measurement | 3.1 | 3.0 | 6.5 | 4.2 |
| a) Non-target background | 1.5 | 0.1 | 0.1 | 0.1 |
| a) Energy scale calibration | 0.9 | 1.7 | 0.8 | 1.7 |
| b) Detector acceptance | 0.5 | 0.5 | 0.5 | 0.5 |
| b) ratio, -scaling | 2.9 | 3.2 | +3.4 (-4.8) | +3.7 (-5.2) |
| b) Other radiative decays | 1.0 | 1.0 | 1.0 | 1.0 |
| c) fit | 1.6 | 6.8 | 2.9 | 0.4 |
| Total: (quadratic sum) | 5.7 | 8.9 | +8.3 (-9.1) | +6.7 (-7.6) |
+ Included in yield measurement error. ∗ Included in yield measurement error.
The separate systematical errors on the photon and measurement as they contribute to have been discussed previously in Secs. IV C 4 and IV D 3. As discussed in Sec. IV C 4, the photon error includes an assumed 30% uncertainty in the charged particle correction related to the results shown in Fig. 11, and an assumed 50% uncertainty in the neutron+anti-neutron correction related to the results shown in Fig. 13. A 2% uncertainty is assumed for the photon identification efficiency. The overall systematical error on the determination of the photon yield is which was shown to be consistent with observed systematic variations by a comparison of the yield determination using different shower identification methods (see Fig. 15).
The systematical errors on the yield determination listed in Table III were discussed in Sec. IV D 3. The systematical error associated with the determination of the identification efficiency was estimated to be 3% and 4% for peripheral and central collisions, respectively. An additional source of systematical error on the yield extraction is attributed to the subtraction of the combinatorial background underlying the peak in the invariant mass distributions which becomes important for the case of central collisions at low . This error was estimated to contribute at the level of of the background. The overall systematical error estimate on the determination of the yield was shown by a comparison of the yield results using different shower identification methods (see Fig. 23) to be consistent with observed systematical variations.
Other systematical error contributions to the measured ratio listed in Table III are the target out background contribution and the calibration of the energy scale. Although the magnitude of the non-target correction was found to have large uncertainties, as discussed in Secs. IV C 1 and IV D 1, the peripheral ratio showed little systematic dependence on the non-target background correction, as discussed in regard to Fig. 29. No target out background correction was necessary for central collisions, as previously discussed.
Based on the observed agreement between the measured and simulated peak positions shown in Fig. 21, the calibration of the energy scale is estimated to be accurate to 0.5%. Using the measured and transverse momentum distributions the error on the ratio is calculated as a function of assuming a 0.5% uncertainty in the scale.
The uncertainty in the detector acceptance listed in Table III is relevant for the background photon calculation. As discussed in Sec. V C, the calculated ratio is not very sensitive to the uncertainty in the detector acceptance, or to extreme assumptions on the extrapolation of the hadron distributions outside of the detector acceptance. The quoted error estimate of 0.5% includes both effects.
One of the larger contributions to the systematical error in this analysis is attributed to the uncertainty in the yield. While the ’s constitute a relatively large source of background photons (see Fig. 25), their yield has not been measured very precisely in the present analysis (see discussion of Sec. IV E). According to the discussion of Sec. V C, -scaling has been assumed in order to allow to relate the spectrum of the to the measured spectrum with only a single overall normalization factor . For peripheral collisions the yield has not been measured. In this case, it should be a good approximation to use the -scaling factor of [76, 77] obtained from a compilation of proton and -induced results, where the -scaling assumption has also been shown to be valid. Nevertheless, we assume a larger systematical error of 20% on since it is an unmeasured quantity and also to accommodate deviations from the -scaling assumption. This results in a systematical error contribution to of about 3% for peripheral collisions, as shown in Table III.
For central collisions, the transverse momentum dependence of the yield was extracted with modest precision, as discussed in Sec. IV E. The measured ratio was found to be consistent with the -scaling assumption with a best fit overall normalization of (stat.)(syst.). For the direct photon analysis, we have added these statistical and systematical errors in quadrature to obtain a low estimate on the ratio of which is used for the lower error estimate on the ratio due to the background contribution. For the upper error estimate on the ratio due to the we have assumed a high estimate of , which is the same upper estimate used for the case of peripheral collisions. This results in a larger upper error than lower error on the ratio with the associated asymmetric errors listed in Table III∥∥∥Note that an upper error estimate on the background photons contribute to the lower error estimate on the photon measurement..
The expected total background contribution from radiative decays other than those of the and (predominantly the and ’) is of the order of a few percent only (see Fig. 28). Since this contribution is unmeasured, a systematical error of in their yield, or 1% on the background photon contribution, has been assumed.
From the results shown in Fig. 26 it is apparent that the statistical error on the measurement limits the significance of the results shown in Figs. 29 and 30, especially at high transverse momenta. This statistical error may be removed by fitting the spectra of Fig. 26, but at the cost of an additional source of systematical error. The last error listed in Table III is the estimated fit error. This error was estimated by fitting separately the spectra for the 1995, 1996, and sum 1995+1996 data samples and separately for the shower condition of all showers (S1) or narrow showers (S2) (i.e. 6 different spectra each for peripheral and central) in the high region only ( GeV/c) and using the half-width of the maximum variation of the fit results over the full region to define the fit error as a function of . This error is observed to be strongly dependent and increases rapidly outside of the range of measurement.
Since within uncertainties by construction, the individual systematical errors on , , and , can be combined to give the total systematical error on . The various systematical errors listed in Table III are added in quadrature to obtain the total systematical error on the ratio. While some of the errors are correlated, the correlations are such that they tend to cancel in the final ratio. Also, the fit error includes some of the errors of the yield extraction. Therefore, the assumption of independent errors is considered a conservative assumption.
The ratio as a function of transverse momentum is shown in Fig. 31 for peripheral and central 158 A GeV 208Pb+208Pb collisions. The results are shown for photons identified using the narrow shower condition (S2). As expected according to the discussion of Eq. 10, the ratios of Fig. 31 show the same behavior as the ratios of Figs. 29 and 30. This comparison provides an additional systematic check since the two sets of results were obtained with different shower identification criteria. As discussed previously, in addition to the larger systematical errors expected when using all showers as photon candidates, the results of Figs. 29 and 30 have larger statistical error because the measurement at each is used and contributes to the statistical error, while on the other hand, the fitted results of Fig. 26 are used for the results of Fig. 31, which reduces the statistical error but increases the systematical error. The general agreement of the two sets of results again suggests that the systematical errors are not large.
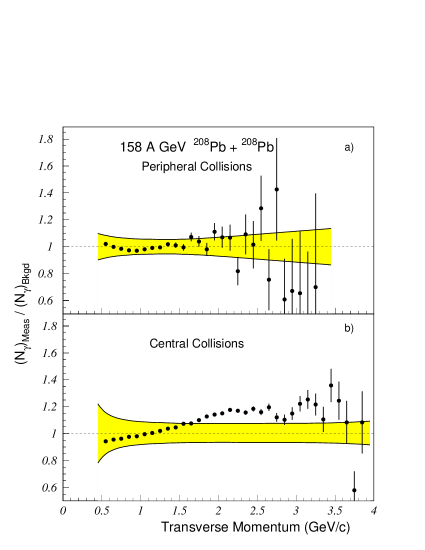
The total -dependent systematical errors listed in Table III are shown by the shaded regions in Fig. 31. The systematical errors increase strongly at low transverse momenta due the combinatorial background uncertainties in the yield extraction. They increase also at large transverse momenta due to the uncertainties in the fits to the distributions. For peripheral collisions, all measured results fall within of , which indicates that no significant photon excess is observed. On the other hand, the results for central collisions do indicate a significant photon excess in the region above about 1.5 GeV/c.

The direct photon excess for central 208Pb+208Pb collisions is shown in Fig. 32. The results are presented as the invariant direct photon yield per central collision. The direct photon excess is obtained according to Eq. 9 with the measured results of Fig. 31 and Fig. 27. The statistical and asymmetric systematical errors of Fig. 31 are added in quadrature to obtain the total upper and lower errors shown in Fig. 32. An additional -dependent error is included to account for that portion of the uncertainty in the energy scale which cancels in the ratio, but enters again with in Eq. 9. In the case that the lower error is less than zero a downward arrow is shown with the tail of the arrow indicating the 90% confidence level upper limit (). The results are also tabulated in Table IV.
For comparion, other published fixed target prompt photon measurements for proton-induced reactions at 200 GeV are also shown in Fig. 32. Results are shown from FNAL experiment E704 [25] () for proton-proton reactions, and from FNAL experiment E629 [21] () and CERN SPS experiment NA3 [22] () for proton-carbon reactions. These results have been divided by the total pp inelastic cross section ( mb) and by the mass number of the target to obtain the invariant direct photon yield per nucleon-nucleon collision. They have then been multiplied by the calculated number of nucleon-nucleon collisions for the central Pb+Pb event selection for comparison with the present measurements. Based on a Glauber model calculation, the number of nucleon-nucleon collisions is calculated to be 660 for the 635 mb most central event selection used for the present analysis. This scaling of the proton-induced results is estimated to have an uncertainty of less than 10% due to uncertainties in the assumed nuclear density distribution and nucleon interaction cross section. The proton-induced results have also been scaled from GeV to the lower GeV of the present measurement. The proton-induced results have also been scaled from GeV to the lower GeV of the present measurement under the assumption that , where [36]. The -scaling effectively reduces the GeV proton-induced results by about a factor of two. This comparison suggests an excess direct photon production in central 208Pb+208Pb collisions as compared to proton-induced reactions at the same of 17.3 GeV. The interpretation of the present result is further discussed in the next section.
2 Comparison to Calculations
Considerable progress has been made in the theoretical description of prompt photon production in hadron-induced reactions. It is now possible to perform a complete and fully consistent next-to-leading order (NLO) QCD calculation of the prompt photon cross section and obtain a quite good description of the data at incident energies from GeV up to Tevatron energies ( TeV)[37]. On the other hand, these same calculations which provide a good description at high incident energy, underpredict prompt photon production at GeV. For the results shown in Fig. 32 the E704 and NA3 results are underpredicted by about a factor of two, while the E629 result is underpredicted by about a factor of five [37].
It has been proposed [36] that the intrinsic transverse momentum of the partons, as a consequence of confinement within the hadron, or of soft gluon radiation, may significantly increase the theoretical prompt photon predictions at low incident energies, or low transverse momenta. The effect of intrinsic is normally neglected in state of the art perturbative QCD calculations due to the formidable technical difficulty to perform the integration over transverse degrees of freedom in the NLO calculations. Nevertheless, there has been a renewed interest to investigate intrinsic effects in prompt photon production [101, 102, 33] largely motivated by recent high precision prompt photon measurements of FNAL experiment E706 [31, 32], although the necessity for such intrinsic effects remains a topic of debate [39].
Recently, Wong and Wang [101] have investigated the effects of parton intrinsic on photon production under the assumption that the NLO corrections are independent of intrinsic . Correction factors, or K-factors, were determined as a function of photon transverse momentum as the ratio of the NLO+LO calculation result to the leading-order (LO) result, without intrinsic . The LO calculations were reevaluated with the inclusion of parton intrinsic assumed to be characterized by a Gaussian distribution with , where is the average intrinsic of a parton. The K-factors determined without intrinsic were then applied to the LO result with intrinsic included to obtain the final prompt photon prediction.

With this prescription the E704 and NA3 results shown in Fig. 32 were well described with a parton intrinsic of (GeV/c)2 [101]. The importance of the intrinsic effect decreases with increasing and increasing photon such that the prompt photon data at higher are equally well described with or without intrinsic .
Predictions of the direct photon production for GeV central 208Pb+208Pb collisions calculated in this manner [101] are compared to the measured results in Fig. 32 and also in Fig. 33. The calculation has been scaled to central 208Pb+208Pb collisions in the same way as described above for the proton-induced data. Results are shown with and without the effects of parton intrinsic by the long-dashed and short-dashed curves, respectively. At this low incident energy, the parton intrinsic is seen to increase the predicted photon yield by a factor which increases with decreasing from about 4 to 8. The predicted direct photon yield with intrinsic effects included is in good agreement with the GeV proton-induced results scaled to GeV. It is also in general agreement with the shape of the observed photon spectrum in central 208Pb+208Pb collisions, but underpredicts the observed yield by about a factor of 2.5. This discrepancy could be a result of further deficiencies in the prompt photon calculations when applied at low incident energy, or it may indicate new effects attributable to nuclear collisions. A possible explanation might be additional broadening of the incoming partons due to soft scatterings prior to the hard scattering which produces the photon [102]. Alternatively, it may be expected that the photon production is enhanced by the additional scatterings which occur as a result of rescattering in nucleus-nucleus collisions.
It is anticipated that if a quark gluon plasma is formed in relativistic heavy ion collisions, it will evolve from the initial hard-scattering partonic stage, through a preequilibrium stage, to a finally thermalized partonic QGP phase. Therefore the Parton Cascade Model (PCM) [103] has been widely regarded as a promising tool to investigate the evolution of the initial partonic state. The VNI [104] implementation of the PCM has recently been used to predict direct photon production in central Pb+Pb collisions at the SPS [105]. Those predictions are in reasonable agreement with the present result, although they slightly overpredict the yield above GeV/c while underpredicting the yield below 2.5 GeV/c. However, it has recently been pointed out that the method which was used to implement higher order pQCD corrections in those calculations, by rescaling in the running coupling constant , is highly questionable at SPS energies [106].
Non-equilibrium direct photon emission has also been investigated within the context of the Ultrarelativistic Quantum Molecular Dynamics model (UrQMD) [107]. The UrQMD predictions of the total direct photon production in central Pb+Pb collisions are shown by the open squares in Fig. 33 [108]. It is interesting that the UrQMD predictions are very similar to the the VNI parton cascade predictions [105]. In the UrQMD calculations, the direct photon production results strictly from meson-meson scattering, predominantly and . In these calculations it was observed that the photon production in the transverse momentum region with GeV/c is dominated by pre-equilibrium emission in which the scattering mesons have locally non-isotropic momentum distributions. The thermal photon emission was found to be important only in the low transverse momentum region below GeV/c.
It is of particular interest to compare the observed direct photon yield to predictions of the expected yield in the event of quark gluon plasma formation. Hydrodynamic model calculations of the predicted direct photon yield are shown by the solid curve in Fig. 33 [20, 109]. The hydrodynamic calculations include transverse expansion [110] with a rich hadronic equation of state including all hadrons and resonances with mass up to 2.5 GeV. The photon emission rates used for the hadronic phase are those which have been obtained from a two-loop approximation of the photon self energy using a model where the interactions have been included [18], and also include the important contribution from the resonance [111]. The photon emission rates from the quark matter phase include the lowest order contributions from the Compton () and annihilation () processes, as well as the new contributions from two-loop diagrams which have recently been shown [19] to give a large bremsstrahlung () contribution and a previously neglected process of annihilation accompanied by q(g) rescattering which is found to dominate the photon emission rate.
As shown in Fig. 33, very good agreement with the experimental result is obtained for the case of an equation of state which includes a QGP phase transition which occurs at a critical temperature of MeV [109] with a hadron thermal freeze-out temperature of MeV. The calculation has been performed for the 10% most central Pb+Pb collisions for a particle density with the assumption of a fast equilibration time of given by the uncertainty relation. This results in an initial temperature of MeV with a thermalization time of fm/c. The contribution from the quark matter in the QGP and mixed phase dominates the calculated high photon yield [109]. This is attributed to the “annihilation with rescattering” process which is a special feature of dense quark matter. This calculation does not include prompt or preequilibrium contributions.
Further study will be necessary to improve the theoretical predictions of the prompt photon contribution as well as the non-equilibrium contributions. On the other hand, the hydrodynamical model calculations which provide a time integration of the emission rate with a very short initial formation time and high initial temperature may provide a reasonable approximation of the contributions from the early non-equilibrium phase of the collision [109]. Further studies will also be necessary to determine how the present direct photon results might further constrain the QGP and non-QGP scenarios. The WA80 direct photon upper limit for central S+Au collisions [43] was able to rule out thermal emission from purely hadronic matter in which the hadronic matter consisted of a simple pion gas with few degrees of freedom [44, 45, 46, 47] due to the constraints which the result implied on the initial temperature [48]. The S+Au direct photon limit has been shown to be consistent with the QGP transition using the new rates for quark matter, although with somewhat different parameters than presented here [112, 109]. It will be important to determine whether the present result, combined with other measurements including the S+Au direct photon upper limit, can provide further constraints and provide compelling evidence for the QGP phase transition scenario.
VI SUMMARY and CONCLUSIONS
A search for direct photons in 208Pb+208Pb collisions at 158 A GeV has been performed using the large-area finely-segmented lead-glass calorimeter of the WA98 experiment. The analysis has been performed on nearly equal-sized event samples of the 10% most central and 20% most peripheral fractions of the total minimum bias cross section. The inclusive photon and transverse momentum distributions were measured for each event sample. Constraints were also obtained on the transverse momentum distribution for central collisions with a modest accuracy which was limited by statistics. The systematical error sources were discussed at length with particular attention to demonstrate the accuracy of the systematical error estimates. The total systematical error for the direct photon analysis varied from about 6% to 10% over the region of interest, and varied with the centrality selection. The direct photon excess was extracted on a statistical basis as the difference between the measured inclusive spectrum of photons within the detector acceptance and the calculated spectrum of photons which result from all hadrons with significant radiative decay contributions. The dominant decay contributions are those from the measured ’s and ’s.
No significant direct photon excess was observed for the peripheral event sample for transverse momenta up to about 2.5 GeV/c. This upper limit of the measurement was imposed by the increasing statistical error at large due to the low particle multiplicity for peripheral collisions.
In contrast, a significant direct photon excess was observed over the region of about 1.5 GeV/c to 3.5 GeV/c for central 208Pb+208Pb collisions. At transverse momenta where the observed excess was not significant, a 90% confidence level upper limit on the direct photon excess was given. This extended the result to the full region of measurement from 0.5 GeV/c to 4 GeV/c.
The observed direct photon yield was compared to a next-to-leading order perturbative QCD calculation at the same (=17.3 GeV) and scaled according to the number of nucleon-nucleon collisions calculated for the selected central event class. The measured direct photon yield was about a factor of 2-3 above the pQCD calculation which included the effects of partonic intrinsic with a parameter which gave a good description of proton-induced prompt photon results at the nearest incident energy (=19.4 GeV). A NLO pQCD calculation without intrinsic was about an order of magnitude below the measured result.
The results suggest that the additional direct photon yield in central 208Pb+208Pb collisions is the result of additional rescatterings in the dense matter. The measured results can be well-described by hydrodynamical model calculations which include a quark gluon plasma phase transition with an initial temperature of MeV and a critical temperature of MeV [109]. The photon emission from the quark matter is found to dominate over the contribution from the hadronic matter due to the recently identified process of annihilation with rescattering [19] which is only expected to occur in dense quark matter. It will be important to determine the uniqueness of this interpretation.
Acknowledgements.
We wish to express our gratitude to the CERN accelerator division for the excellent performance of the SPS accelerator complex. We acknowledge with appreciation the effort of all engineers, technicians and support staff who have participated in the construction of this experiment. We acknowledge helpful discussions with D.K. Srivastava and C.-Y. Wong. This work was supported jointly by the German BMBF and DFG, the U.S. DOE, the Swedish NFR and FRN, the Dutch Stichting FOM, the Stiftung für Deutsch-Polnische Zusammenarbeit, the Grant Agency of the Czech Republic under contract No. 202/95/0217, the Department of Atomic Energy, the Department of Science and Technology, the Council of Scientific and Industrial Research and the University Grants Commission of the Government of India, the Indo-FRG Exchange Program, the PPE division of CERN, the Swiss National Fund, the INTAS under Contract INTAS-97-0158, ORISE, Grant-in-Aid for Scientific Research (Specially Promoted Research & International Scientific Research) of the Ministry of Education, Science and Culture, the University of Tsukuba Special Research Projects, and the JSPS Research Fellowships for Young Scientists. ORNL is managed by UT-Battelle, LLC, for the U.S. Department of Energy under contract DE-AC05-00OR22725. The MIT group has been supported by the US Dept. of Energy under the cooperative agreement DE-FC02-94ER40818.REFERENCES
- [1] See for example, Proceedings of Quark Matter ’99, Nucl. Phys. A 661 (1999).
- [2] M.C. Abreu et al., Phys. Lett. B 410, 337 (1997).
- [3] E. Andersen et al., Phys. Lett. B 449, 401 (1999).
- [4] E.L.Feinberg, Nuovo Cimento 34 A, 391 (1976).
- [5] E.Shuryak, Phys. Lett. B 78, 150 (1978).
- [6] J.D.Bjorken and H.Weisberg, Phys. Rev. D 13, 1405 (1976).
- [7] S.A.Chin, Phys. Lett. B 78, 552 (1978).
- [8] R.Anishetty, P.Koehler, and L.McLerran, Phys. Rev. D 22, 2793 (1980).
- [9] K.Kajantie and R.Raitio, Phys. Lett. B 121, 415 (1983).
- [10] G.Domokos and J.I.Goldman, Phys. Rev. D 23, 203 (1981).
- [11] K.Kajantie and H.I.Miettinen, Z. Phys. C 9, 341 (1981).
- [12] F.Halzen and H.C.Liu, Phys. Rev. D 25, 1842 (1982).
- [13] S.A.Chin, Phys. Lett. B 119, 51 (1982).
- [14] B.Sinha, Phys. Lett. B 128, 91 (1983).
- [15] L.D.McLerran and T.Toimela, Phys. Rev. D 31, 545 (1985).
- [16] R.D.Pisarski, Phys. Rev. Lett. 63, 1129 (1989).
- [17] E.Braaten, R.D.Pisarski, and T.C.Yuan, Phys. Rev. Lett. 64, 2242 (1990).
- [18] J.Kapusta,P.Lichard, and D.Seibert, Phys. Rev. D 44, 2774 (1991); Erratum, ibid D 47, 4171 (1993).
- [19] P. Aurenche, et al., Phys. Rev. D 58, 085003 (1998).
- [20] D. K. Srivastava, Eur. Phys. J. C 10, 487 (1999).
- [21] E629 Collaboration, M. McLaughlin et al., Phys. Rev. Lett. 51, 971 (1983).
- [22] NA3 Collaboration, J. Badier et al., Z. Phys. C 31, 341 (1986).
- [23] NA24 collaboration, C. De Marzo et al., Phys. Rev. D 36, 8 (1987).
- [24] R108 collaboration, A.L.S. Angelis et al., Nucl. Phys. B 263, 228 (1986).
- [25] E704 Collaboration, D.L. Adams et al., Phys. Lett. B 345, 569 (1995).
- [26] R806 collaboration, E. Annassontzis et al., Z. Phys. C 13, 277 (1982).
- [27] WA70 collaboration, M. Bonesini et al., Z. Phys. C 37, 535 (1988).
- [28] WA70 collaboration, M. Bonesini et al., Z. Phys. C 38, 371(1988).
- [29] R110 collaboration, A.L.S. Angelis et. al., Nucl. Phys. B 327, 541 (1989).
- [30] AFS/R807 collaboration, T. Åkesson et al., Sov. J. Nuc. Phys. 51, 836 (1990).
- [31] E706 collaboration, G. Alverson et al., Phys. Rev. D 48, 5 (1993).
- [32] E706 collaboration, L. Apanasevich et al., Phys. Rev. Lett. 81, 2642 (1998).
- [33] L. Apanasevich, et al., Phys. Rev. D 59, 074007 (1999).
- [34] UA6 collaboration, G. Ballocchi et al., Phys. Lett. B 436, 222 (1998).
- [35] CDF collaboration, F. Abe et al., Phys. Rev. Lett. 73, 2662 (1994).
- [36] J.F. Owens, Rev. Mod. Phys. 59, 465 (1987).
- [37] See for example, W. Vogelsang and M.R. Whalley, J. Phys. G: Nucl. Part. Phys. 23, A1 (1997).
- [38] J. Huston et al., Phys. Rev. D 51, 6139 (1995).
- [39] P. Aurenche et al., Eur. Phys. J. C 9, 107 (1999).
- [40] HELIOS Collaboration, T.Åkesson et al., Z. Phys. C 46, 369 (1990).
- [41] WA80 Collaboration, R. Albrecht et al., Z. Phys. C 51, 1 (1991).
- [42] CERES Collaboration, R.Baur et al., Z. Phys. C 71, 571 (1996).
- [43] R. Albrecht et al., Phys. Rev. Lett. 76, 3506 (1996).
- [44] D. K. Srivastava and B. Sinha, Phys. Rev. Lett. 73, 2421 (1994).
- [45] J. J. Neumann, D. Siebert, and G. Fai, Phys. Rev. C 51, 1460 (1995).
- [46] A. Dumitru et al., Phys. Rev. C 51, 2166 (1995).
- [47] N. Arbex et al., Phys. Lett. B 354, 307 (1995).
- [48] J. Sollfrank et al., Phys. Rev. C 55, 392 (1997).
- [49] A. Baden et al., Nucl. Instrum. Methods Phys. Res. Sect. A 203, 189 (1982).
- [50] W. T. Lin et al., Nucl. Instrum. Methods Phys. Res. Sect. A 389, 415 (1997).
- [51] J. M. Rubio et al., Nucl. Instrum. Methods Phys. Res. Sect. A 367, 358 (1995).
- [52] L. Carlén et al., Nucl. Instrum. Methods Phys. Res. Sect. A 431, 123 (1999).
- [53] M. M. Aggarwal et al., Nucl. Instrum. Methods Phys. Res. Sect. A 424, 395 (1999).
- [54] T. C. Awes et al., Nucl. Instrum. Methods Phys. Res. Sect. A 279, 497 (1989).
- [55] T.Chujo, et al., Nucl. Instr. and Meth. A 383, 409 (1996).
- [56] T. Peitzmann et al., Nucl. Instrum. Methods Phys. Res. Sect. A 376, 368 (1996).
- [57] S. Neumaier et al., Nucl. Instrum. Methods Phys. Res. Sect. A 360, 593 (1995).
- [58] A. L. Wintenberg et al., Proceedings of Electronics for Future Colliders Conference, May 1994, LeCroy Corp.
- [59] K. Reygers, Doctoral thesis, University of Münster, Germany (1999).
- [60] F. Berger et al., Nucl. Instrum. Methods Phys. Res. Sect. A 321, 152 (1992).
- [61] T. C. Awes et al., Nucl. Instrum. Methods Phys. Res. Sect. A 311, 130 (1992).
- [62] R. Brun and F. Carminati, GEANT Detector Description and Simulation Tool, CERN Program Library, Long Writeup W5013, March, 1994.
- [63] D. Bucher, Doctoral thesis, University of Münster, Germany (1999).
- [64] M. Bourquin and J.-M. Gaillard, Nucl. Phys. B 114 334, (1976).
- [65] R. Blankenbecler and S.J. Brodsky, Phys. Rev. D 10, 2973 (1974).
- [66] E. V. Shuryak and O. Zirhov, Phys. Lett. B 89, 253 (1980).
- [67] R. Hagedorn, Riv. Nuovo Cimento 6, 1 (1983).
- [68] F. Büsser et al., Nucl. Phys. B 106, 1 (1976).
- [69] J. Bartke et al., Nucl. Phys. B 120, 14 (1977).
- [70] G. Donaldson et al., Phys. Rev. Lett. 40, 684 (1978).
- [71] C. Kourkoumelis et al., Phys. Lett. B 84, 277 (1979).
- [72] J. Povlis et al., Phys. Rev. Lett. 51, 967 (1983).
- [73] NA27 Collaboration, M. Aguilar-Benitez et al., Z. Phys. C 50, 405 (1991).
- [74] Omega Photon Collaboration, R. Apsimon et al., Z. Phys. C 54, 185 (1992).
- [75] CERES/TAPS Collaboration, G. Agakichiev et al., Eur. Phys. J. C 4, 231 (1998).
- [76] AFS Collaboration, T. Åkesson et al., Phys. Lett. B 178, 447 (1986).
- [77] WA80 Collaboration, R. Albrecht et al., Phys. Lett. B 361, 14 (1995).
- [78] NA44 Collaboration, I.G. Bearden et al., Phys. Rev. Lett. 78, 2080 (1997).
- [79] NA49 Collaboration, H. Appelshäusser et al., Eur. Phys. J. C 2, 661 (1998).
- [80] WA98 Collaboration, M.M. Aggarwal et al., Phys. Rev. Lett. 83, 926 (1999).
- [81] J.R. Nix, Phys. Rev. C 58, 2303 (1998).
- [82] J. Kapusta et al., Phys. Rev. D 53, 5028 (1996).
- [83] Z. Huang and X.-N. Wang, Phys. Rev. D 53, 5034 (1996).
- [84] J. Jalilian-Marian and B. Tekin, Phys. Rev. D 57, 5593 (1998).
- [85] Review of Particle Properties, Eur. Phys. J. C 3, 1 (1998).
- [86] M. Diakonou et al., Phys. Lett. B 89, 432 (1980).
- [87] F.T. Dao et al., Phys. Rev. Lett. 30, 1151 (1973).
- [88] I. Derado et al., Z. Phys. C 50, 31 (1991).
- [89] NA35 Collaboration, T. Alber et al., Z. Phys. C 64, 195 (1994).
- [90] WA85 Collaboration, S. Abatzis et al., Phys. Lett. B 376, 251 (1996).
- [91] T. Sjöstrand and M. Bengtsson, The Lund Monte Carlo Programs - JETSET, CERN Program Library, W5035, March, 1994.
- [92] WA98 Collaboration, M.M. Aggarwal et al., Phys. Lett. B 458, 422 (1999).
- [93] K. Werner, Phys. Rep. 232, 87 (1993).
- [94] T.A. Gabriel et al., CALOR: A Monte Carlo Program Package for the Design and Analysis of Calorimeters, ORNL/TM-5619, (1977).
- [95] A. Ferrari and P.R. Sala, GEANT Hadronic Event Generators: a comparison at the single interaction level, ATLAS Internal Note, PHYS-No-086, June 1996.
- [96] NA49 Collaboration, S.V. Afanasiev et al., Nucl. Phys. A 610, 188c (1996).
- [97] WA98 Collaboration, M.M. Aggarwal et al., Phys. Rev. Lett. 81, 4087 (1998).
- [98] R. Hagedorn, CERN-TH. 3684 (1983).
- [99] UA1 Collaboration, G. Bocquet et al., Phys. Lett. B 366, 434 (1996).
- [100] R. Albrecht et al., Eur. Phys. J. C 5, 255 (1998).
- [101] C.-Y. Wong and H. Wang, Phys. Rev. C 58, 376 (1998).
- [102] G. Papp, P. Levai, and G. Fai, Phys. Rev. C 61, 021902 (1999).
- [103] K. Geiger and B. Müller, Nucl. Phys. B 369, 600 (1992); K. Geiger, Phys. Rep. 258, 237 (1995).
- [104] K. Geiger, Comp. Phys. Comm. 104, 70 (1997).
- [105] D.K. Srivastava and K. Geiger, Phys. Rev. C 58, 1734 (1998).
- [106] S.A. Bass and B. Müller, Phys. Lett. B 471, 108 (1999).
- [107] S.A. Bass et al., Prog. Part. Nucl. Phys. 41, 225 (1998).
- [108] A. Dumitru et al., Phys. Rev. C 57, 3271 (1998).
- [109] D. K. Srivastava and B. Sinha, nucl-th/0000000.
- [110] J. Cleymans, K. Redlich, and D.K. Srivastav, Phys. Rev. C 55, 1431 (1997).
- [111] Li Xiong, E. Shuryak, and G.E. Brown, Phys. Rev. D 46, 3798 (1992).
- [112] D. K. Srivastava and B.C. Sinha, Eur. Phys. J. C 12, 109 (2000).