Sideward flow in Au + Au collisions between 2 and 8 GeV
Abstract
Using the large acceptance Time Projection Chamber of experiment E895 at Brookhaven, measurements of collective sideward flow in Au + Au collisions at beam energies of 2, 4, 6 and 8 GeV are presented in the form of in-plane transverse momentum and the first Fourier coefficient of azimuthal anisotropy . These measurements indicate a smooth variation of sideward flow as a function of beam energy. The data are compared with four nuclear transport models which have an orientation towards this energy range. All four exhibit some qualitative trends similar to those found in the data, although none shows a consistent pattern of agreement within experimental uncertainties.
pacs:
PACS numbers: 25.75.LdSideward flow was the first type of collective motion to be identified among fragments from relativistic nuclear collisions [1]. It consists of a preferential emission in the plane defined by the incident nuclei (the reaction plane); at relativistic energies, nucleon emission towards the projectile side is favored forward of the center of mass rapidity, while the target side is favored at backward rapidities. This behavior is normally attributed to a release of compressional energy, and thus is sensitive to the integrated effect of the nuclear pressure generated in the collision. Models indicate that sideward flow is established during the early, high density stage of the heavy ion collision, and that it is minimally distorted during the subsequent evolution.
A Quark Gluon Plasma (QGP) might be formed in heavy ion collisions at sufficiently high energies, in contrast to the purely hadronic matter that exists throughout the collision process at lower energies. Near the transition between these two regimes, it is argued that the increased entropy density leads to a “softest point” in the nuclear equation of state (EOS), which could generate a minimum in the pressure-driven sideward flow at the relevant beam energy [2, 3, 4]. Earlier, it had been suggested that sideward flow at CERN energy would have a magnitude that depends on whether or not a plasma is produced [5]. Initial calculations incorporating a softest point in the framework of one-fluid relativistic hydrodynamics featured a prominent minimum in the sideward flow for near-central Au + Au collisions around 5 GeV [3]. However, the softening effect is reduced when allowance is made for the finite size of the hydrodynamic system [6], and it occurs at higher beam energies in a three-fluid model [4]. Most recently, it has been argued that the shape of the rapidity dependence of sideward flow may be a QGP signature [7].
In the past, hydrodynamic calculations have frequently been the first to predict new collective phenomena, whereas microscopic transport models have typically reproduced flow measurements subsequently with better agreement. Relativistic transport codes yield measurably different flow amplitude near the “softest point” beam energy, depending on whether or not a phase transition is simulated [8, 9]. Furthermore, the smooth excitation function for elliptic flow observed in E895 [10] has been interpreted as a possible phase transition signature because a transport model comparison is consistent with a progressive softening of the EOS with increasing beam energy [9]. However, a transition from hadronic to string degrees of freedom has since been put forward as an alternative interpretation for such an EOS softening [11]. There are several further reasons why the 2-8 GeV energy range is especially interesting: it is largely unexplored; many inelastic NN channels open up within this relatively narrow range of beam energies; and models suggest that the highest baryon density is reached in this region [12].
We report proton sideward flow measurements for Au + Au collisions at kinetic energies of 1.85, 3.9, 5.9, and 7.9 GeV in experiment E895 [13] at Brookhaven’s AGS. The data presented come from the main E895 subsystem — the EOS Time Projection Chamber (TPC). E895 allows a seamless extension to higher beam energies of the detailed flow excitation functions already measured [14, 15] using the same TPC at the Bevalac. The TPC offers good acceptance for charged particles over a substantial fraction of solid angle, as well as particle identification via energy loss measurement, although ambiguities in separating protons from both pions and deuterons increase with beam energy. The full event reconstruction capability of E895 allows determination of flow even when the correlations used to establish the reaction plane orientation are relatively weak.
The estimated reaction plane azimuth for an event is based on the orientation of , where runs over all baryonic fragments in the event, is momentum in the plane perpendicular to the projectile direction, and we use the weighting factor , where is the center-of-mass frame rapidity for fragment , and is half the rapidity gap between target and projectile [16]. Thus, denotes normalized rapidity such that the target and projectile are always at and , respectively. Detector asymmetries and inefficiencies result in anisotropies in the determined reaction plane azimuth . Uniform distributions in are recovered after each track is assigned a weight according to its and magnitude and direction.
The centrality of collisions is characterized in terms of charged ejectile multiplicity as a fraction of , the value near the upper limit of the spectrum where the height of the distribution has fallen to half its plateau value [17]. The events used in our analysis come from the region where sideward flow is at or near its maximum — multiplicities between 0.5 and 0.75 times . Models indicate that this region corresponds to impact parameters distributed mostly between 5 and 7 fm. After centrality selection, the analyzed samples contain 12, 24, 9.3 and 7.2 thousand events at 2, 4, 6 and 8 GeV, respectively.
The mean proton transverse momentum projected onto the reaction plane, , is presented as a function of rapidity in Fig. 1. Using the prescription described in Ref. [18], these and all subsequent flow signals are corrected for finite resolution in determining the reaction plane. Dispersion correction factors are 0.89, 0.79, 0.62 and 0.43 at 2, 4, 6 and 8 GeV, respectively. In E895, there are known distortions below GeV caused by track reconstruction inefficiencies and by the breakdown of proton – separation at some rapidities. At Bevalac beam energies, where these distortions are not a factor, we have studied the contours on scatter plots of the components and within various rapidity gates, after events are rotated so that estimated reaction planes are aligned with the axis. It is observed that the contours are concentric, and is constant in any slice of , with deviations of less than 5%. Therefore, full acceptance in the plane is not required to extract the sideward flow, provided an appropriate cut is applied to remove the problematic region. For GeV, the expected flat behavior in is observed at E895 beam energies. We assign these plateau values to , with the assumption that the behavior described above is a general property of sideward flow which does not change between Bevalac and AGS energies. Moreover, GEANT-based simulations of the detector response without this assumption yield corrected results that are consistent within the reported uncertainties.
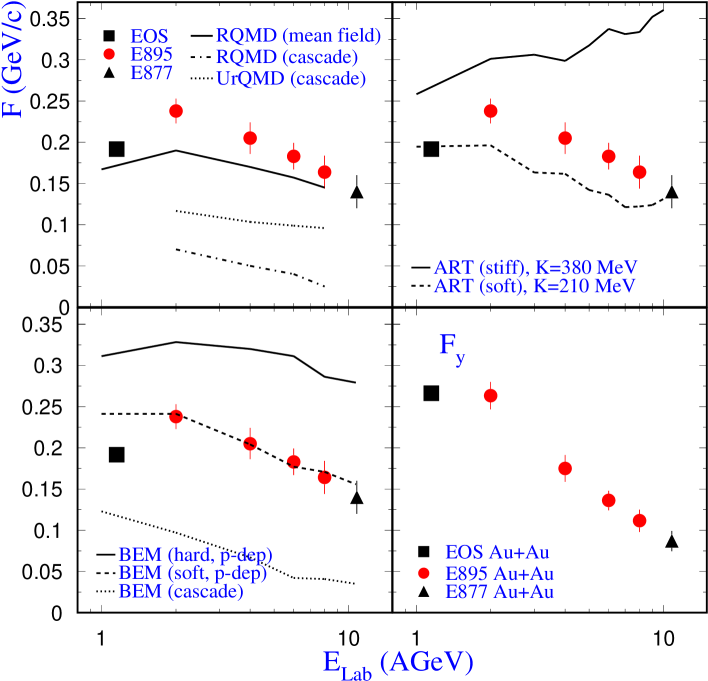
Shapes of are normally close to linear over an interval centered on midrapidity, and a function typically fits the distribution over the region dominated by participant fragments. It has become common to use the fitted linear coefficient (or , the corresponding slope for unnormalized rapidity) to characterize the overall strength of the sideward flow. We average the fitted coefficient with and without imposing , and the difference generally dominates the systematic uncertainty in the slope (which is large compared with the statistical error). Figure 2 presents both and as functions of beam energy, along with the same quantities for comparable centrality, as measured in the same detector at lower energy [15], and in E877 [19] at maximum AGS energy. Nucleon rapidity spectra at fixed centrality have close to the same form at different beam energies, and this observation motivated the use of normalized rapidity in the definition of . Both flow observables decrease steadily with increasing beam energy over the E895 range. The significant decrease in at E895 energies (in contrast to a flat or slightly decreasing trend in at Bevalac energies [15]), is interpreted in the hydrodynamic picture as an increased deviation from ideal fluid behavior (constant [20, 1]), most plausibly viscosity arising from the increasingly copious particle production in this region [20]. Phenomenologically, the observed trends in and between 0.2 and 10 GeV can be related to the steady decrease in the azimuthal anisotropy of the proton distribution (defined below) over this range, in combination with the variation of , which increases steeply at Bevalac/SIS energies but appears to approach saturation at higher beam energies [1].
Within a rapidity window, flow causes anisotropic distributions of track azimuths relative to the reaction plane. These anisotropies generally can be well described by the truncated Fourier expansion
| (1) |
The first Fourier coefficient, , reflects the azimuthal angular part of the sideward flow correlation, and is related to the sideward flow observable according to
| (2) |
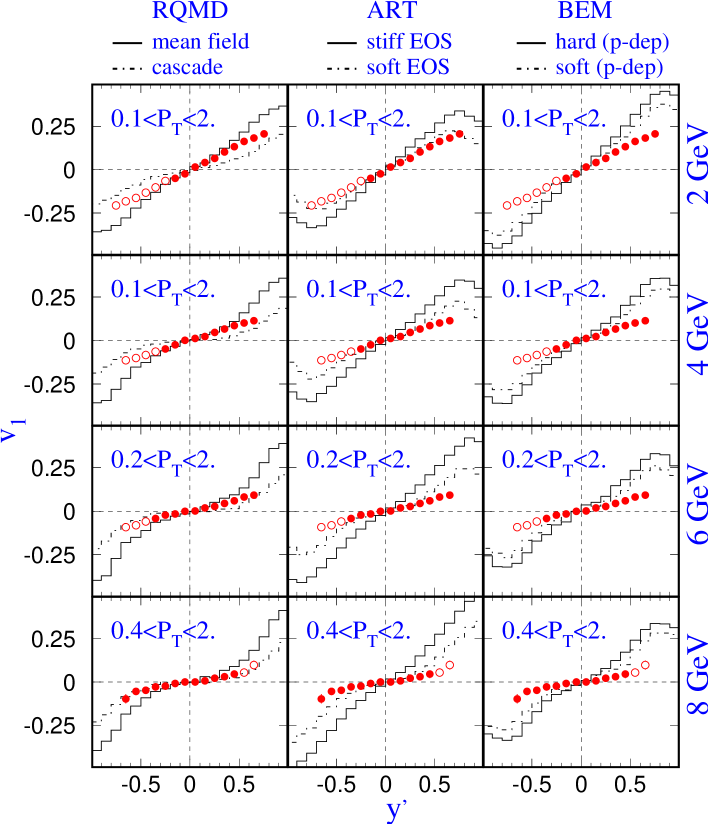
The coefficient in Eq. (1) represents elliptic flow [1], already reported for the present E895 data set [10]. Figure 3 presents measured coefficients for protons as a function of rapidity, at the four E895 beam energies. gates, as labeled, were applied when generating the spectra reported in Fig. 3 (but gates were not used in any of the analyses).
The data in Figs. 1 through 3 do not show evidence of a dip in the flow excitation function [3, 6, 8, 9], and previous measurements at both higher and lower beam energy are consistent with a smooth extrapolation of the E895 data. The slopes show no evidence of a decrease near midrapidity, while a small flattening effect [21, 7] appears in at the highest energies. The decrease in slope at midrapidity is very prominent at CERN energy [22].
Nuclear transport models describe the nuclear collision in part as successive point-like nucleon-nucleon interactions. The NN cross sections are mostly taken from experiment and include inelastic processes, e.g., production of resonances, pions, etc. These models have been successful in reproducing a large fraction of the published flow measurements to within a few tens of percent or better. The representative transport models now available include RQMD [23] (Relativistic Quantum Molecular Dynamics), UrQMD [24] (Ultrarelativistic Quantum Molecular Dynamics), ART [8] (A Relativistic Transport model) and BEM [9] (Boltzmann-Equation Model). In one operating mode of RQMD (“cascade”), the hadrons and resonances propagate freely between binary collisions, and the equilibrium pressure is close to that of an ideal gas. RQMD also contains an option (the “mean-field” mode) which allows additional pressure to be generated in the high density stage. UrQMD provides only a cascade mode at these energies, but features a completely independent implementation from RQMD. BEM is based on the relativistic Landau theory of quasiparticles. In addition to a cascade mode, two types of momentum-dependent EOS can be selected in BEM: a scalar potential (soft EOS, MeV) and a vector potential (hard EOS, MeV). In the ART model, there is likewise provision for a soft and stiff EOS, but using different phenomenological prescriptions from those in BEM. An early version of the BEM code was used in refs [10, 25]; the version reported here yields less sideward flow than before [25], but almost the same elliptic flow [10, 25]. All comparisons presented here are subject to a systematic uncertainty arising from the fact that all of the model calculations neglect formation of composite nuclear fragments, while the flow measurements are for free protons only.
Although a relatively complex pattern of disagreement is observed between data and all four models, several general conclusions are suggested by the comparisons. The cascade modes of BEM, RQMD and UrQMD all exhibit less proton flow than observed. The significant differences among the codes in cascade mode (up to a factor of 2 or more) indicates that the binary scattering part of transport simulations, usually considered to be better understood than the “long-range” part, remains a source of significant uncertainty in model calculations at these energies. The soft EOS in ART and BEM, and RQMD’s mean field, all come close to reproducing the measurements. The relative variation of for data and all models as a function of increasing beam energy is suggestive of a softening trend [10]. However, there is a marked tendency for the data to favor substantially softer equations of state than measurements. The coefficient reflects only the azimuthal angular part of the sideward flow correlation, while and also include the effect of magnitude correlations; thus, the tendency noted above indicates that the models consistently have too small a magnitude flow correlation relative to their azimuthal angle flow correlation. It is also noteworthy that no mode of any of these models is close to simultaneously reproducing the E895 elliptic flow [10, 25] and our data for and .
In summary, we report measurements of sideward flow in collisions of heavy nuclei in the previously unexplored region between maximum Bevalac/SIS energy and maximum AGS energy. Sideward flow decreases smoothly over the 2 to 8 GeV range, and extrapolations are consistent with existing measurements at both lower and higher beam energies. A new trend of decreasing flow sets-in near the low end of the studied beam energy range — the excitation function changes from flat or slowly decreasing to a steeper rate of decrease, while the slope of the excitation function changes sign. This change roughly coincides with the onset of copious particle production, and is reproduced qualitatively by some transport calculations. As at other energies [1], transport simulations in cascade mode consistently yield less flow than is observed. The model flow calculations for E895 energies are subject to significant systematic uncertainties, as inferred from variations among different models and from the overall extent and pattern of agreement with experiment. At present, these uncertainties appear to be larger than the magnitude of flow signatures of physics importance, and so strongly motivate further transport model investigation and development focused specifically on this unique energy domain where many new inelastic NN channels open up, and meson yields increase steeply. Overall, our flow excitation function measurements offer important constraints on possible conclusions regarding a QGP phase transition at or above E895 energies.
We thank the authors of refs. [8, 9, 23, 24] for providing model codes and/or calculations. We also thank P. Danielewicz, A. Poskanzer and S. Voloshin for valuable input and discussions. We acknowledge DOE, NSF and other funding as detailed in ref. [10], and computational resources provided by the National Energy Research Scientific Computing Center.
REFERENCES
- [1] W. Reisdorf and H.G. Ritter, Annu. Rev. Nucl. Part. Sci. 47, 663 (1997); N. Herrmann, J.P. Wessels and T. Wienold, ibid. 49, 581 (1999).
- [2] C.M. Hung and E.V. Shuryak, Phys. Rev. Lett. 75, 4003 (1995).
- [3] D.H. Rischke, S. Bernard, and J.A. Maruhn, Nucl. Phys. A595, 346 (1995); D.H. Rischke and M. Gyulassy, ibid. A597, 701 (1996).
- [4] J. Brachmann et al., Phys. Rev. C 61, 024909 (2000).
- [5] N.S. Amelin et al., Phys. Rev. Lett. 67, 1523 (1991).
- [6] C. Spieles, H. Stöcker and C. Greiner, Phys. Rev. C 57, 908 (1998).
- [7] L.P. Csernai and D. Röhrich, Phys. Lett. B458, 454 (1999).
- [8] B.-A. Li and C.M. Ko, Phys. Rev. C 58, R1382 (1998).
- [9] P. Danielewicz et al., Phys. Rev. Lett. 81, 2438 (1998).
- [10] E895 Collaboration, C. Pinkenburg et al., Phys. Rev. Lett. 83, 1295 (1999).
- [11] P.K. Sahu et al., LANL preprint nucl-ex/9907002.
- [12] Y. Pang, T.J. Schlagel, and S.H. Kahana, Phys. Rev. Lett. 68, 2743 (1992).
- [13] G. Rai et al., IEEE Trans. Nucl. Sci. 37, 56 (1990); proposal, LBL-PUB-5399 (1993).
- [14] EOS Collaboration, S. Wang et al., Phys. Rev. Lett. 74, 2646 (1995); ibid. 76, 3911 (1996); M.A. Lisa et al., ibid. 75, 2662 (1995); J. Chance et al., ibid. 78, 2535 (1997); J.C. Kintner et al., ibid. 78, 4165 (1997).
- [15] EOS Collaboration, M.D. Partlan et al., Phys. Rev. Lett. 75, 2100 (1995).
- [16] P. Danielewicz and G. Odyniec, Phys. Lett. 157B, 146 (1985).
- [17] H.A. Gustafsson et al., Phys. Rev. Lett. 52, 1590 (1984).
- [18] A. Poskanzer and S. Voloshin, Phys. Rev. C 58, 1671 (1998).
- [19] E877 Collaboration, J. Barrette et al., Phys. Rev. C 56, 3254 (1997); the reproduced point is based on identified protons in the E877 spectrometer.
- [20] N. Balazs, B. Schürmann, K. Dietrich, and L. P. Csernai, Nucl. Phys. A424, 605 (1984); A. Bonasera and L. P. Csernai, Phys. Rev. Lett. 59, 630 (1987); A. Bonasera, L. P. Csernai, and B. Schürmann, Nucl. Phys. A476, 159 (1988).
- [21] H. Liu, S. Panitkin, and N. Xu, Phys. Rev. C 59, 348 (1999)
- [22] NA49 Collaboration, H. Appelshäuser et al., Phys. Rev. Lett. 80, 4136 (1998).
- [23] H. Sorge, Phys. Rev. C52 3291 (1995).
- [24] S.A. Bass et al., Prog. Part. Nucl. Phys. 41, 225 (1998).
- [25] E895 Collaboration, G. Rai et al., Proc. Quark Matter ’99, Nucl. Phys. A661 162c (1999).