Very high rotational frequencies and band termination in 73Br
Abstract
Rotational bands in 73Br have been investigated up to spins of = 65/2 using the EUROBALL III spectrometer. One of the negative-parity bands displays the highest rotational frequency = 1.85 MeV reported to date in nuclei with . At high frequencies, the experimental dynamic moment of inertia for all bands decrease to very low values, 10 MeV-1. The bands are described in the configuration-dependent cranked Nilsson-Strutinsky model. The calculations indicate that one of the negative-parity bands is observed up to its terminating single-particle state at spin 63/2. This result establishes the first band termination in the 70 mass region.
23.20.lv, 23.20.En, 21.60.Ev, 27.50.+e
Exploring nuclei at very high excitation energies and angular momentum is of fundamental importance for our understanding of many-body systems. Under such extreme conditions, one of the most interesting quantum phenomena is the termination of rotational bands. This means that a specific configuration manifests itself as a collective rotational band at low spin values, but gradually loses its collectivity with increasing spin and finally terminates at the maximum spin in a fully aligned state of single-particle nature [1, 2, 3]. The origin of this phenomenon lies in the limited angular momentum content of the fixed configuration. Experimentally, terminating bands were first observed in 158Er [4], then in the mass region [2, 5] and recently in several other mass regions [3]. In a terminating band, the nuclear shape gradually traces a path through the triaxial plane, starting as collective (often at near-prolate shape, ) and evolving over many transitions to a non-collective state at oblate (), spherical or prolate () shape [1]. In the experiment, this has been most clearly demonstrated in the 110 and 60 mass regions [6, 7].
The A 70-80 mass region displays a large variety of structural effects. At low spins, there is a competition between prolate and oblate configurations due to the existence of the deformed shell gaps at different particle numbers and deformations [8]. At higher spins, there is a shell gap at near-prolate and near-oblate collective shapes at neutron number 38 [8]. A further interesting observation is that the bands in 81Sr [9] show features which are generally associated with terminating bands [3, 10], even though they do not appear to become fully non-collective. It is now an interesting question whether bands can be observed up to termination in the somewhat lighter nuclei in the mass region. This is the motivation behind the present study of the Br38 nucleus at very high rotational frequencies.
High-spin states in 73Br were populated in the reaction 40Ca(40Ca,), using the 185 MeV beam delivered by the XTU Tandem accelerator of the Laboratori Nazionali di Legnaro. The experiment was performed using an enriched (99.96 %) 40Ca target with a thickness of 0.9 mg/cm2. -rays were registered with 15 Cluster [11] and 26 Clover [12] detectors of the EUROBALL III array. Charged particles were detected with the Italian SIlicon Sphere (ISIS) consisting of 40 Si telescopes [13]. At forward angles, 15 segmented detector units filled with BC501A liquid scintillator were mounted to detect neutrons [14].
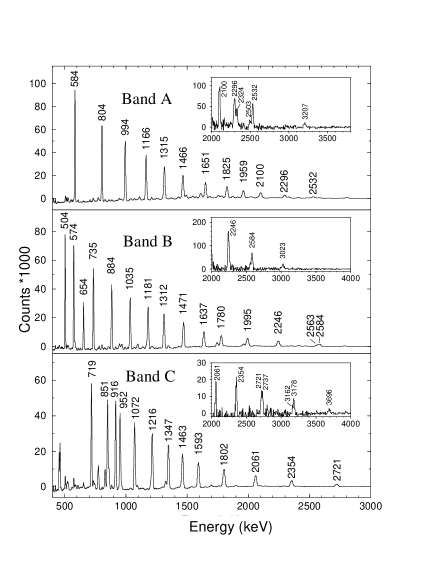
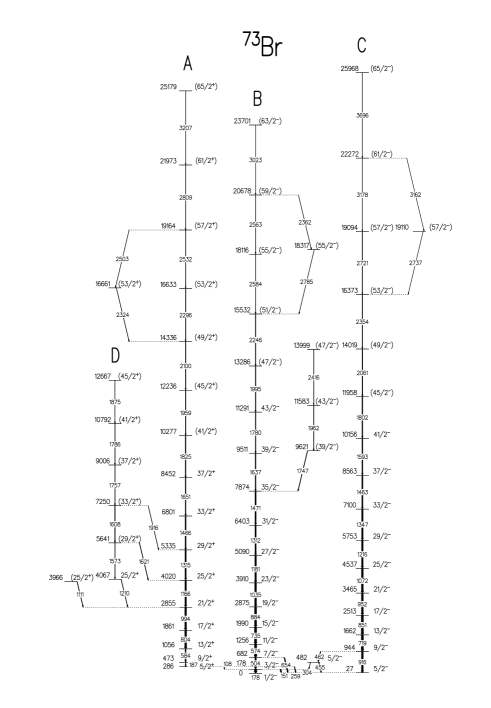
A total number of 2109 events were recorded. The exit channel leading to 73Br is predicted to 3.4% of the total cross section, according to PACE calculations [15]. -particle coincidences and coincidences were sorted into two-dimensional matrices and three-dimensional cubes. Examples of doubly-gated coincidence spectra are shown in Fig. 1. These coincidence data were analysed using the Radware package [16]. The resulting level scheme of the 73Br nucleus is presented in Fig. 2. The sequences A, B and C have been known from previous studies [17, 18] up to the states of spins and parities = (45/2+), (47/2-) and (49/2-), respectively. In this work, these rotational bands were extended up to states with = (65/2+), (63/2-) and (65/2-), respectively, at excitation energies 26 MeV. Moreover, a new sequence D was established, which feeds the 2855 keV, 4020 keV and 5335 keV states of band A.
An analysis of the directional correlations from oriented states (DCO) was performed to assign spins to the newly observed states. The coincidence data were added up for the 35 most backward-angle detectors, located at an average angle of 156∘ (149∘, 155∘, 157∘, 163∘) to the beam and the 108 detectors near 90∘ (72∘, 81∘, 99∘, 107∘). A 156∘ versus 90∘ matrix was created in coincidence with particles. From this matrix we extracted DCO-ratios defined as:
| (1) |
where denotes the efficiency-corrected intensity of the transition observed at 156∘ when gating on at 90∘. According to the calculations for the DCO-ratios by Krane et al. [19], values of about 0.5 and 1 are expected for stretched and pure transitions of multipole order 1 and 2, respectively, if the gate is set on an 2 transition. The DCO-ratios of transitions in 73Br are plotted in Fig. 3. There are two clearly separated groups of transitions around DCO-ratios of 0.6 and 1, which are assigned as dipole and quadrupole transitions, respectively. The DCO-ratio very close to 1 for the 455 keV M1 transition is related to the spin difference between the initial and final states (see Fig. 2) . On the basis of the DCO-ratios we confirmed the character of all previously known transitions. We furthermore firmly derived an E2 character for the 1651 keV -ray in band A, for the 1471 keV, 1637 keV, 1780 keV -rays in band B, for the 462 keV and 1593 keV -rays in band C, and for the 1210 keV -ray depopulating the lowest observed state in band D. Hence, band D has the same signature and parity as band A.
The rotational bands in 73Br display very high -ray energies (see Fig. 2). For example the -ray energy on the top of sequence C is 3696 keV. This corresponds to a rotational frequency of = /2 = 1.85 MeV. This is the highest frequency ever observed in a rotational cascade in nuclei with . For comparison, the highest rotational frequencies reported so far are = 1.82 MeV in the 60Zn nucleus [7] and = 1.4 MeV in the 109Sb nucleus [20].
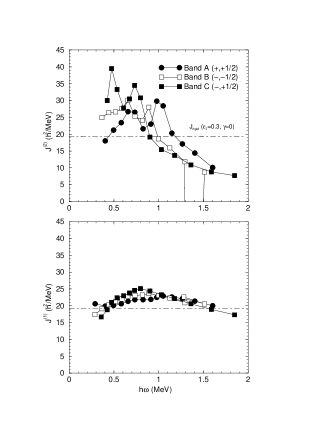
A collective parameter which is very sensitive to the changes in the nuclear structure is the dynamic moment of inertia, . In Fig. 1 a gradual increase in the -ray energy spacings as the -ray energies increase within the bands can be clearly seen. This implies a corresponding decrease of the dynamic moments of inertia , which are presented in Fig. 4-top. For 1 MeV, the irregularities of are signaling band crossings. For each band there are mainly two irregularities in which could be caused by proton and neutron alignments. In contrast, for frequencies higher than 1 MeV, the dynamic moments of inertia of the bands converge and decrease to approximately 40 % of the value of a rigid rotor. This smooth down-sloping of the dynamic moment of inertia may indicate that, starting at MeV, the configurations of bands A and C do not change up to the highest rotational frequency, and that the rotational band is gradually losing its collectivity. For band B a negative spike in occurrs at = 1.28 MeV and is caused by the decrease of the transition energy which indicates a band crossing. This behavior is reminiscent of 158Er where a band terminating at crosses the more collective yrast band at [4]. The bottom graph of Fig. 4 shows the kinematical moment of inertia = . The latter stays close to the rigid-body value. For high rotational frequencies the relation indicates that pairing correlations play no important role.
In order to assign configurations to bands A, B and C we have used the configuration-dependent Cranked Nilsson-Strutinsky (CNS) approach [21, 22] based on the cranked Nilsson potential. Since we are interested in the high-spin properties, the pairing correlations have been neglected in the calculations. The calculations minimize the total energy of a specific configuration for a given spin with respect to the deformation parameters (). Thus, the total energy and the shape trajectory (the evolution of the minimum of the total energy in the () plane as a function of spin) are obtained for each configuration. The configurations of interest can be described by excitations within the , , and the orbitals. Thus, there are no holes in the subshell and no particles in the orbitals above the spherical shell gap at 50. In the Ref. [8] it was shown that at the deformation of = 0.35 the lowest neutron intruder orbital from the subshells comes down and crosses the Fermi surface at = 1.4 MeV. However, the CNS calculations including one neutron in the orbital result in bands which behave very differently from the observed bands.
Furthermore, the highest orbital will not become occupied in the low-lying configurations of 73Br; therefore we can omit in the labeling. Note also that all orbitals are treated on the same footing in the cranking calculations, which means that, for example, the polarization of the core is taken care of.
In the following, the configurations will be specified with respect to a Ni28 core as having 7 active protons and 10 active neutrons. They will be labeled by the shorthand notation [], where stands for the number of protons (neutrons) in the () orbitals and stands for the number of protons (neutrons) in orbitals. In addition, the sign of the signature of the last occupied orbital (given as a subscript) is used if the number of occupied orbitals in the specific group is odd.
Considering that the bands A, B and C extend to high spins of or , we will first outline the possible proton and neutron configurations using their maximum spins as criteria. The maximum spin is defined from the distribution of particles and holes over the -shells at low spin. Including 2 protons in the orbital, there are 5 protons, which lead to a maximum proton spin of or 29/2 for the proton subsystem depending on signature. The maximum proton spin becomes 33/2 for proton configurations with 3 protons if the last proton occupies the favoured () signature. Including 3 neutrons in the orbital, the maximum neutron spin is 15 or 16 depending on the signature for the 7 neutrons. Adding one more neutron to the orbital, the maximum neutron spin is . The occupation of additional orbitals adds only marginally to the maximum spin, but costs a lot of energy. Thus, it is reasonable to expect that such configurations will be considerably above the yrast line in the spin range of interest. There are five out of all possible combinations, where the proton and the neutron spins add to a maximum total spin of . The calculations show that one of these configurations, [43+,7-3+], does not build any ‘collective band’ for spin values . Therefore, only four configurations, namely [43+,64], [5+2,64], [5-2,64] and [43+,7+3+], are left as possible candidates for the observed bands.
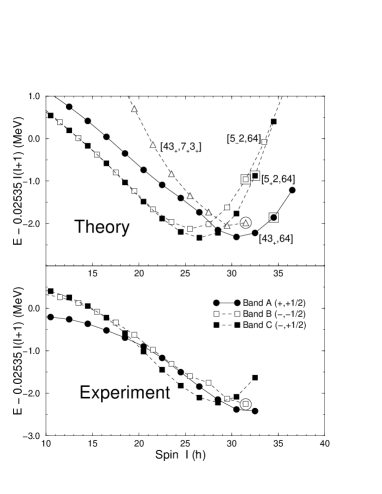
In Fig. 5 the calculated energies relative to a rigid rotor reference of the above mentioned configurations are compared with the experimental data. The CNS calculations indicate that these configurations are indeed the lowest-lying ones capable of building angular momentum up to the values observed. Since pairing correlations have been neglected, the calculated energies are expected to be realistic only at high spin of . In the calculations, the configurations are following a parabola-like energy curve. As seen in Fig. 5, the [43+,64] configuration has its minimum around spin 61/2, while band A seems to approach the minimum at 65/2. Amongst the considered configurations, the [5+2,64] configuration is calculated to be lowest up to spin , which reproduces the experimental situation with band C. Moreover, the minimum in occurs at similar spin values, 57/2 in band C and at 53/2 in the [5+2,64] configuration. Based on this comparison of theoretical and experimental energies we assign the [43+,64] and [5+2,64] configurations to bands A and C, respectively.
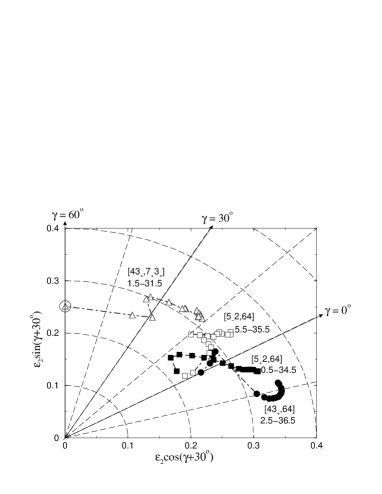
Band B is observed up to = (63/2). The calculations suggest that the [5-2,64] configuration can be assigned to this band at low and medium spin. It is the signature partner of the [5+2,64] configuration assigned to band C. These configurations reproduce well the slope of experimental curves for bands B and C, but underestimate the signature splitting between them. The [5-2,64] configuration is crossed at spin 57/2 by the [43+,7+3+] configuration (see Fig. 5). The predicted crossing is indeed observed in band B at spin (55/2-) (Fig. 2). Thus, the latter configuration can be related to band B above the band crossing. In the calculations, the band built on the [43+,7+3+] configuration terminates at the maximum spin of the particle configuration, i.e. at 63/2. This can be seen in the shape trajectories, which are presented in Fig. 6. Whereas the trajectories related to bands A and C include collective near-prolate deformations over the whole spin range, the configuration assigned to band B after the band crossing at 55/2 (empty triangles) undergoes a shape change from a collective shape to a non-collective oblate shape between spins 55/2 and 63/2. Thus, the band built on this configuration terminates at the maximum spin . Since this coincides with the maximum spin observed in band B, we have observed this band up to its termination. Our interpretation of band B requires a relatively strong interaction between two configurations which differ in their occupation of the -shells for both protons and neutrons. This might appear unlikely but one could also note that a high-spin crossing in a terminating band in 108Sn has been interpreted [24] as built from configurations which differ in an analogous manner.
In band A a branching at spin = (53/2) is experimentally seen (see Fig. 2). The configuration assigned to this band shows a shape change from to (see Fig. 6) between = 53/2 and 57/2. This suggests that in each minimum, there is a smooth configuration and the calculated yrast configuration jumps from one minimum to the other with increasing spin. Thus, the two states at (53/2) might belong to these different minima. A similar branching is also observed for the band C, but appears even more difficult to describe in the calculations even though the irregularities in the shape trajectories (Fig. 6) suggest the possibility of competitions between different minima in all configurations shown in Figs. 5 and 6. However, these branchings remain an interesting experimental result and a challenge to theory.
In summary, we observed in the 73Br nucleus the highest rotational frequency in a cascade in nuclei with . Out of the four observed rotational bands could be followed up to its termination. Moreover, we give arguments on the particle structure of this band. According to the calculations the other two high-spin bands are not terminating; instead they stay collective beyond the maximum spin defined from the distribution of particles and holes over the -shells at low spin. These results establish the phenomenon of band termination in the mass region for the first time. The predicted decrease in the quadrupole moment along the terminating band should be observable via Doppler shift lifetime measurements. Further studies will be important in order to obtain greater insight into the systematics of the physical observables in connection with band termination in this mass region.
This work was supported by the German Ministry of Education and Research under contracts 06 DR 827, 06 OK 862, 06 GOE 851, by the Swedish Natural Science Research Council, by the UK EPSRC, and by the European Union within the TMR project. A.V. Afanasjev acknowledges the support by the Alexander von Humboldt Foundation.
REFERENCES
- [1] T. Bengtsson and I. Ragnarsson, Phys. Scr. T5, 165 (1983).
- [2] I. Ragnarsson et al., Phys. Rev. Lett. 74, 3935 (1995).
- [3] A.V. Afanasjev et al., Phys. Rep. 322 , 1 (1999).
- [4] I. Ragnarsson et al., Phys. Scr. 34, 651 (1986).
- [5] V.P. Janzen et al., Phys. Rev. Lett. 72, 1160 (1994).
- [6] R. Wadsworth et al., Phys. Rev. Lett. 80, 1174 (1998).
- [7] C. E. Svensson et al., Phys. Rev. Lett. 82, 3400 (1999).
- [8] W. Nazarewicz et al., Nucl. Phys. A435, 397 (1985).
- [9] F. Cristancho et al., Phys. Lett. B 357, 281 (1995).
- [10] I. Ragnarsson and A.V. Afanasjev, in Proc. Conf. on Nucl. Structure at the Limits, Argonne, USA, ANL/PHY-97/1, p. 184 (1996).
- [11] J. Eberth, Nucl. Instr. Methods Phys. Res., A 369, 135 (1996).
- [12] F.A. Beck et al., in Proc. Conf. on Physics from Large -ray Detector Arrays, Berkeley, 1994, LBL 35687, CONF 940888, UC 413, p154.
- [13] E. Farnea et al., Nucl. Instr. Methods Phys. Res., A 400, 87 (1997).
- [14] Ö. Skeppstedt et al., Nucl. Instr. Methods Phys. Res., A 421, 531 (1999).
- [15] A. Gavron, Phys. Rev. C 21, 230 (1980).
- [16] D.C. Radford, Nucl. Instr. Methods Phys. Res., A 361, 297 (1995).
- [17] J. Heese et al., Phys. Rev. C 36, 2409 (1987).
- [18] J. Heese et al., Phys. Rev. C 41, 1553 (1990).
- [19] K.S. Krane, R.M. Stephen and R.M. Wheeler, Nucl. Data Tables 11, 351 (1973).
- [20] H. Schnare et al., Phys. Rev. C 54, 1598 (1996).
- [21] T. Bengtsson and I. Ragnarsson, Nucl. Phys. A436 (1985).
- [22] A.V. Afanasjev and I. Ragnarsson, Nucl. Phys. A591, 387 (1995).
- [23] D. Galeriu, D. Bucurescu and M. Ivaşcu, J. Phys. G 12, 329 (1986).
- [24] R. Wadsworth et al., Phys. Rev. C 53, 2763 (1996).