Nuclear multifragmentation, percolation and the Fisher Droplet Model: common features of reducibility and thermal scaling
Abstract
It is shown that the Fisher Droplet Model (FDM), percolation and nuclear multifragmentation share the common features of
reducibility (stochasticity in multiplicity distributions) and thermal scaling (one-fragment production probabilities are
Boltzmann factors). Barriers obtained, for cluster production on percolation lattices, from the Boltzmann factors show a
power-law dependence on cluster size with an exponent of . The EOS Au multifragmentation data yield barriers
with a power-law exponent of . Values of the surface energy coefficient of a low density nuclear system are
also extracted.
pacs:
25.70 Pq, 64.60.Ak, 24.60.Ky, 05.70.JkSince the earliest observations of nuclear multifragmentation (the break up of excited nuclei), the Fisher Droplet Model (FDM) [1] and percolation models [2] have been employed in attempts to understand this phenomenon. The FDM enjoyed early success in predicting power-law distributions in fragment masses at the critical point in a liquid-vapor diagram [3]. Percolation models also predicted a power-law distribution in fragment sizes near the critical point [4], [5]. Both models still enjoy great popularity and have been employed in the analysis of Au multifragmentation data obtained by the EOS Collaboration [6],[7],[8],[9],[10].
Other analyses of multifragmentation data have shown two empirical properties of the fragment multiplicities which have been named reducibility and thermal scaling [11],[12],[13],[14]. Reducibility refers to the observation that for each energy bin, , the fragment multiplicities, , are distributed according to a binomial or Poissonian law. As such, their multiplicity distributions, , can be reduced to a one-fragment production probability , according to the binomial or Poissonian law:
| (1) | |||||
| (2) |
where is the total number of trials in the binomial distribution. The experimental observation that could be constructed in terms of was considered evidence for stochastic fragment production, i.e. fragments are produced independently of each other. Experimental fragment multiplicity distributions were observed to change from binomial to Poissonian under a redefinition of fragment from to individual charges, [12].
Thermal scaling refers to the feature that behaves with temperature as a Boltzmann factor: . Thus a plot of vs. , an Arrhenius plot, should be linear if is a Boltzmann factor. The slope is the one-fragment production barrier. Analyses of multifragmentation distributions along these lines have demonstrated the presence of these features [11] and have led to the extraction of barriers [12]. Controversy has surrounded this type of analysis regarding both the physical existence of these features and their significance, mostly within the framework of dynamical vs. statistical origins of multifragmentation [13].
In this work several important points will be made: The FDM inherently contains reducibility and thermal scaling. Since percolation reduces to the FDM, it exhibits reducibility and thermal scaling. Thus percolation provides a simple mathematical model that fully manifests these two features. Arrhenius plots for percolation can be used to extract barriers. The barriers have a power-law dependence on cluster size. Analysis of the EOS Au multifragmentation data verifies reducibility and thermal scaling. The extracted barriers also obey a power-law dependence on fragment mass.
The FDM and its forerunners [15], [16] are based on the equilibrium description of physical clusters or droplets. The mean number of droplets of size was written as:
| (3) |
where and and are the actual and liquid chemical potentials respectively. For (gas), falls to zero with increasing . For (liquid), increases with . To better describe the distribution for intermediate values of , Eq. (3) was modified to include the surface of the droplets:
| (4) |
where is the surface free-energy density. For , falls to zero with increasing . For , the terms in the exponential compete, leading to an early decrease in with , followed by an increase.
To account for the properties near criticality, Fisher introduced an explicit expression for the surface free energy and a topological factor resulting in an expression for the normalized droplet distribution:
| (5) |
where: is the size of the system; is a normalization constant depending only on the value of [17]; , the topological critical exponent, depends on the dimensionality of the system with origins that lie in considerations of a three dimensional random walk of a surface closing on itself, for three dimensions ; is the surface free energy of a droplet of size ; is the surface energy coefficient; is the critical exponent related to the ratio of the dimensionality of the surface to that of the volume; and is the control parameter, a measure of the distance from the critical point, .
From this outline it is apparent that the FDM exhibits the features of reducibility and thermal scaling. The distribution in droplet size is Poissonian by construction: in the FDM each component of droplet size is an ideal gas without the canonical constraint of overall constituent number conservation. The resulting grand canonical distribution is Poissonian. Thus, , i.e. Poissonian reducibility.
Thermal scaling is obvious in the FDM when Eq. (5) is written as follows:
| (6) |
It is clear that linearity with (thermal scaling in an Arrhenius plot) extends to and beyond the critical point, and the slope of the Arrhenius plot gives the surface energy coefficient of the droplet.
Percolation models are characterized by a constant energy per bond. The bond-breaking probability, , is amenable to a straightforward statistical mechanics treatment. Such a treatment reveals that in the limit of , , indicating that the range of covered by Eq. (5) is half the usual range discussed in percolation theory; . Such a literal thermodynamical treatment therefore excludes the critical point, , of many types of percolation systems from thermodynamic consideration.
However, percolation phenomena, with a geometrical phase transition, share with thermal critical phenomena the important features of scaling, universality and renormalization group as well as other deep connections [18]. For example, the scaling behavior observed in percolation clusters can be described by the FDM when replaces in Eq. (5) and the control parameter becomes [2].

To demonstrate the scaling of percolation clusters a plot is made of the scaled cluster distribution, , as a function of the scaled control parameter, . See the left panel of Fig. 1. Data over a wide range in and are seen to collapse. Cluster distributions used in this analysis were generated on a simple cubic lattice of side six [19].
Fitting as a function of for and leaving and as free parameters in Eq. (5) gives and , i.e. the bulk factor is unity. At the critical point, , the collapsed distribution takes the value of one indicating that the cluster distribution follows a power law. Away from the critical point, the cluster distribution predominantly follows the surface term in Eq. (5). The FDM does not describe the behavior of clusters for . Other forms for the FDM’s surface factor have been suggested to describe cluster behavior on both sides of the critical point [2], [19].
Also shown in Fig. 1 is a plot of the EOS Au multifragmentation data [6], [7], [8], [9], [10]. Here the substitution of for has been made resulting in a control parameter of , which for a degenerate Fermi gas reduces to . The excitation energy normalized to the mass of the fragmenting remnant, in MeV/nucleon, excludes collective effects [9]. The location of the critical point, , and values of the critical exponents, and , were determined previously [6], [7], [8], [9], [10]. Fitting as a function of for and leaving and as free parameters in Eq. (5) gives MeV (via with ) and , i.e. the bulk term is consistent with . The surface energy coefficient is of a somewhat different nature than the semiempirical mass formula parameter ( MeV for , ) or estimates for low density nuclear systems ( MeV for MeV, ) [20]. The coefficient is temperature independent; the temperature dependence is given as .
Since the FDM has been shown to contain the features of reducibility and thermal scaling and since the scaling inherent in the FDM describes percolation, it should be possible to observe reducibility and thermal scaling in percolation cluster distributions.

To address the question of reducibility in percolation, cluster multiplicity distributions for bins in are considered. The ratio of the variance to the mean, , of the multiplicity distribution for each cluster of size is an indicator of the nature of the distribution. In Fig. 2, such a ratio is shown as a function of . The observed ratio is near one (Poissonian limit) over the range of . Within experimental errors, similar behavior is observed for the Au multifragmentation data.
Examples of multiplicity distributions with Poissonian curves calculated from percolation are shown in the left panel of Fig. 3. Poissonian distributions reproduce percolation cluster distributions over two or three orders of magnitude for all values; Poissonian reducibility is present in percolation.
Fig. 3 also shows the multiplicity distributions for Au multifragmentation compared to the calculated Poissonian curves. The agreement between the measured and computed distributions confirms the presence of reducibility in the Au multifragmentation data.

To verify thermal scaling in percolation, the average yield of clusters of size and its dependence on are considered. The presence of thermal scaling should manifest itself through a Boltzmann factor. Again, the substitution for is made in accordance with standard percolation theory and is plotted as a function of (Arrhenius plot). See Fig. 4. In most cases the Arrhenius plots for individual clusters of size are linear over two orders of magnitude. Thus, thermal scaling is verified for percolation. The observations that reducibility and thermal scaling are already present in such a simple model suggest that they are deeply rooted fundamental features of multifragmentation processes rather than being epiphenomena of complex systems.
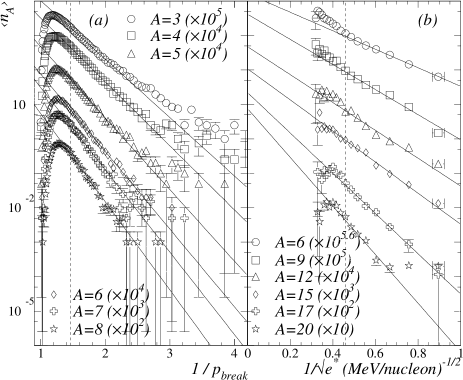
The Boltzmann factor indicates that the slope of an Arrhenius plot represents the barrier associated with the production of a cluster. For an interpretation of in percolation, the Boltzmann factor is equated with Eq. (5) yielding a power law relating to the size of a cluster: when . Fitting the extracted barriers (slopes in Fig. 4) as a function of gives an exponent equal to in agreement with the accepted value of for D percolation. See Fig. 5. The constant of proportionality of the power law gives another measure of the surface energy coefficient .
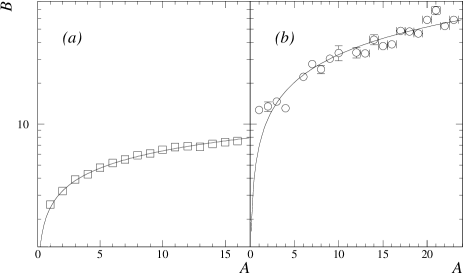
When the Arrhenius analysis is performed on the Au multifragmentation data, the results are qualitatively similar, but quantitatively distinct. Arrhenius fits of , now plotted against , are linear over an order of magnitude or more. See Fig. 4. The barriers extracted here can be converted into units of MeV via the energy-temperature relation for a degenerate Fermi gas. Following the same analysis as for percolation, a fit was made of vs. (see Fig. 5) which yielded , in agreement with previously determined EOS Au multifragmentation values [7], [10], [21] and MeV.
In summary, the above effort illustrates:
-
the presence of reducibility and thermal scaling in the FDM, percolation and the EOS Au multifragmentation data (the latter two shown empirically);
-
the relationship between the FDM and percolation via a scaling analysis that also yields an estimate of the surface energy coefficient;
-
that the barriers obtained from percolation follow a power-law dependence on cluster size with an exponent that agrees with the accepted D percolation value and gives another (consistent) estimate of the surface energy coefficient;
-
the collapse of the EOS Au fragment distributions in accordance with the FDM yielding an estimate of the surface energy coefficient of a low density nuclear system;
-
that the barriers obtained from EOS Au multifragmentation data follow a power-law dependence on fragment mass with an exponent near the expected value () and close to the 3D Ising universality class value () and gives another (consistent) estimate of the surface energy coefficient.
This work was supported in part by the U.S. Department of Energy and by the National Science Foundation.
REFERENCES
- [1] M. E. Fisher, Physics 3, 255 (1967).
- [2] D. Stauffer and A. Aharony, “Introduction to Percolation Theory”, 2nd ed. (Taylor and Francis, London, 1992).
- [3] J. E. Finn et al., Phys. Rev. Lett. 49, 1321 (1982).
- [4] X. Campi, Phys. Lett. B 208, 351 (1988).
- [5] W. Bauer et al., Phys. Lett. B 150, 53 (1985).
- [6] M. L. Gilkes, et al., Phys. Rev. Lett. 73, 1590 (1994).
- [7] J. B. Elliott et al., Phys. Lett. B, 381, 24 (1996).
- [8] J. A. Hauger et al., Phys. Rev. Lett. 77, 235 (1996).
- [9] J. A. Hauger et al., Phys. Rev. C 57, 764 (1998).
- [10] J. B. Elliott et al., Phys. Lett. B. 418, 35 (1998).
- [11] L. G. Moretto et al., Phys. Rep. 287, 249 (1997).
- [12] L. Beaulieu et al., Phys. Rev. Lett. 81, 770 (1998).
- [13] J. Toke et al., Phys. Rev. C 56, R1683 (1997).
- [14] L. G. Moretto et al., Phys. Rev. C 60, 031601 (1999).
- [15] J. Frenkel, “Kinetic Theory of Liquids”, Oxford University Press (1946).
- [16] J. E. Mayer and M. G. Mayer, “Statistical Mechanics”, John Wiley, New York (1940).
- [17] H. Nakanishi and H. E. Stanley, Phys. Rev. B 22, 2466 (1980).
- [18] H. E. Stanely et al., Physica A 266, 5 (1999).
- [19] J. B. Elliott et al., Phys. Rev. C 55, 1319, (1997).
- [20] A. S. Hirsch et al., Phys. Rev. C 29, 508 (1984).
- [21] J. B. Elliott et al., in progress.