Exponential Recovery of Low Frequency Fluctuations in a Diode Laser with Optical Feedback
Abstract
We show that the recovery after each power drop on the chaotic Low Frequency Fluctuations in a semiconductor laser with optical feedback follows an exponential envelope. The time constant for such exponential behavior was experimentally measured. This recovery time constant and the average time interval between consecutive drops are shown to have different dependences when measured as function of the pump current.
keywords:
chaos , diode lasers , low frequency fluctuations , recovery timePACS:
42.60.Mi , 05.45.Jn , 42.65.Sf1 Introduction
Nearly three decades ago, Mrk et al. (1988) reported that diode lasers submitted to moderate optical feedback show chaotic Low Frequency Fluctuations as drops in their power output. Controlled studies are done using a reflecting mirror and making the so called external cavity that feeds back a delayed optical field into the very small laser chip cavity. Thus, the feedback delay time, , corresponds to the roundtrip time of the external cavity. The time, , is in the range of tens of nanoseconds when the reflecting surface is located a few meters from the laser. The irregular variation of time interval between power drops, , is the main indicator of the chaotic LFF pulsations of the laser, as seen in figure 1.

Typically, the average value of changes with the values of the feedback level and the laser pump current, going from the order of microseconds down to hundreds of nanoseconds. Simultaneously, underneath these slow time scale events, the laser dynamics has very fast (picosecond range) pulsations in its power output and population inversion Sano (1994); van Tartwijk and Lenstra (1995); Fischer et al. (1996); Vaschenko et al. (1998); Sukow et al. (1999); Gavrielides et al. (1999). Averaged in a time scale of nanoseconds, the LFF events reported to date have the shape of a sharp drop followed by a stepwise recovery Mrk et al. (1988); Liu et al. (1999); Hegarty et al. (1998). The deterministic and random contributions to the origin of the LFF drops is still subject of studies and many works have been dedicated to the measurement and calculation of the properties of Hohl et al. (1995); Lam et al. (2003); Sukow et al. (1997); Mrk et al. (1999). Sukow et al. (1997) have clearly established that the drops and recoveries within a LFF series are nearly constant, while T fluctuates. Liu et al. (1999) studied the recovery process and established that the time interval between steps during the LFF recovery correspond to the external round trip or feedback time delay, . Their work also shows that within LFF time series, while the time between drops had a wide variance, the number of steps in the recovery was nearly constant. They study the number of steps within consecutive drops (that is, within the time ) as function of the current and external cavity length. Hegarty et al. (1998) also reported that the fast population relaxation oscillations in diode lasers with optical feedback have the same repeated shape while the interdrop time, , have large chaotic fluctuations. They define as recovery time the time interval between switch-off and switch-on of the first peak on the ultrafast (subnanoseconds) dynamics and show the analogy with the turning-on of the laser. However, details or measurements for the early stage after each drop within nanoseconds averaged time are missing in the literature. In this time scale the ultrafast highly irregular pulses are not detectable and their effect merges within the noise that eventually drives the LFF. The resulting averaged LFF signal still have important physical behavior to be studied quantitativelly as function of its parameters.
The aim of this communication is to define and present quantitative measurements on this averaged stepwise recovery of LFF in a semiconductor lasers with delayed feedback. A typical segment of the laser power time series of our experiments, filtered with ns time window, is shown in figure 1. With the averaged signal we show that the LFF recovery occurs with an exponential time dependent envelope, having a time constant . A recovery time of the LFF events is defined as the time constant of these exponentials. This is directly measured and is shown to be dynamically independent of the time between drops. Such results can be foreseen in figure 2. To our knowledge, this exponential envelope and its time constant are proposed and systematically measured for the first time herein.
2 Experiments
The laser in the experiments was an SDL 5401 GaAlAs, thermally stabilized to 0.01 K, and emitting at nm. Its solitary threshold current was mA. An external flat mirror distant between m to m was placed to create the optical feedback. Collimating lenses fixed the amount of feedback, which was measured by the threshold reduction parameter, van Tartwijk and Lenstra (1995). The intensity output is detected by a 1.5 GHz bandwidth photodiode and the power data series were filtered with the time averaging of ns by a digital oscilloscope. Very long data series were also stored in a computer memory with a bits acquisition system running at MHz. Despite the filtering time of ns the use of large round trip time delay permitted the distinct manifestation of the steps on the recovery of the LFF. This is seen in the short segments of the power series of figure 2 where is ns.
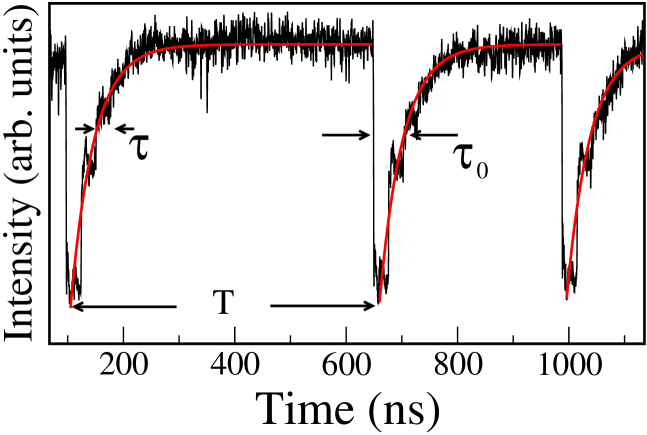
Within figure 2 are indicated the external cavity round trip time, , the time between drops, , and the recovery time constant of the drop envelope, . To verify phenomenologically the exponential behavior on the recovery, after time when a sharp drop occurs, the experimental laser power is fitted to the expression
| (1) |
where is the minimum value of the laser power, just after the drop at time and the value just before the drop . Figure 2 shows the fittings of exponentials curves (color on line), following equation 1 drawn over the experimental data. It is relevant to emphasize that a single value of was used to fit the three consecutive drops presented in figure 2. Such is going to be our definition of recovery time in a LFF drop event.
For a quantitative study of the experimental value of , a best fitting computer program for the parameters of equation 1 was run over long experimental series. The program first found the value of a minimum then determined , and finally searched for the best . From data series having more than LFF drops, at each value of the injection current, the computer routine found the average of the recovery time, , which is shown in figure 3.

For currents just above the solitary laser threshold the time constant shows small variation with the current and a value close to . Then, it decreases almost linearly with the current until the laser enters coherence collapse. The average time between drops, , was also extracted from the same experimental data series. The results are shown in figure 4. Our measured , has a value on the order of for low current, and behaves as described in previous work Liu et al. (1999).

With external cavity of 0.9 m, which corresponds to =6 ns, the results obtained for and are shown in figures 5 and 6.


The two quantities, and , are clearly distinct in their dependences on the pump current. Not only their order of magnitude, but mainly their rate of change with the current, given by the concavity of their dependences, are different. The most important difference appears for low currents. Near the solitary laser threshold current the average time between drops is known to have a sharp variation with the value of the pump current Hohl et al. (1995).
Further differences appear between the physical behavior of and when their variances are obtained as functions of the current. The results in figure 7 and 9 show the normalized variance, =, for the average time between drops. It has been previously studied Avila et al. (2004) and present a minimum for intermediate values of the pump current. This can be interpreted as a manifestation of deterministic coherence resonance Avila et al. (2004).

The value of and the variance of are strongly dependent on the noise in the system Hohl et al. (1995); Eguia et al. (1998). For low pump currents the main noise contribution is attributed to external or spontaneous emission origin Hohl et al. (1995); Lam et al. (2003), while deterministic noise, resulting from the fast chaotic dynamics, dominates at higher currents Sano (1994); Avila et al. (2004). These regimes are seen in figures 6 and 9. The corresponding normalized variances for the recovery time constant are shown in figure 8 and 10. In contrast with the relative variance of , the relative variance of the time constant is nearly constant. From this we infer that noise does not appear to affect . This is consistent with the definition of a quantity that is characteristic of the slow deterministic dynamics of the system.


Measurements done for external cavity lengths with =6 ns, 9 ns, 15 ns, 30 ns and 60 ns give approximately the same behavior for the relation between the recovery time constant and the time between drops. The value of remains nearly constant, below 30%, through the whole range of cavity lengths and pump currents investigated. A small concavity is observed only for relative variance of with pump current in the data for cavity delay time of 30 ns (figure 8). For pump current near solitary threshold we have measured 3 to 10 and .
3 Conclusions
To summarize, a new experimental quantity on the dynamics of a diode laser with optical feedback was introduced and studied: a time constant for the exponential recovery of the power drops in the Low Frequency Fluctuations. It is defined for the LFF signal averaged on a nanosecond time scale. The ultrafast pulsations present in the LFF is filtered out and this recovery definition is related to the slow dynamics (time scale longer than nanoseconds) of the system. The recovery time has specific dependence on the laser parameters, as shown here for the measurements as function of the pump current. Its variance is almost constant throughout the range of currents from threshold up to the onset of Coherence Collapse van Tartwijk and Lenstra (1995). For comparison, the well studied Hohl et al. (1995); Liu et al. (1999); Lam et al. (2003); Sukow et al. (1997); Mrk et al. (1999) average time between drops, was also obtained for the same laser. Our results for low pump current confirm that the recovery is very insensitive to the effects of noise, in contrast to the average time between drops. The recovery envelope time constant, , may be useful as a relevant measurable quantity to be accounted for in calculations from theoretical models for the Low Frequency Fluctuations in chaotic diode lasers. A comparative study with numerical solutions of the Lang-Kobayahi equations Lang and Kobayashi (1980) will be presented in a forthcoming publication Avila et al. (2005).
Acknowledgments
The authors acknowledge useful discussions with J. Tredicce and M. Giudici. Work partially supported by Brazilian Agencies Conselho Nacional de Pesquisa e Desenvolvimento (CNPq) and Fundação de Ciência de Pernambuco (FACEPE) and by a Brazil-France, Capes-Cofecub project 456/04.
References
- Mrk et al. (1988) J. Mrk, B. Tromborg, and P. L. Christiansen, IEEE Journal of Quantum Electronics 24, 123 (1988).
- Sano (1994) T. Sano, Physical Review A 50, 2719 (1994).
- van Tartwijk and Lenstra (1995) G. H. M. van Tartwijk and D. Lenstra, Quantum and Semiclassical Optics 7, 87 (1995).
- Fischer et al. (1996) I. Fischer, G. H. M. van Tartwijk, A. M. Levine, W. Elsäer, E. Göbel, and D. Lenstra, Physical Review Letters 76, 220 (1996).
- Vaschenko et al. (1998) G. Vaschenko, M. Giudici, J. J. Rocca, C. S. Menoni, J. R. Tredicce, and S. Balle, Physical Review Letters 81, 5536 (1998).
- Sukow et al. (1999) D. W. Sukow, T. Heil, I. Fischer, A. Gravielides, A. Hohl-AbiChedid, and W. Elsäer, Physical Review A 60, 667 (1999).
- Gavrielides et al. (1999) A. Gavrielides, T. C. Newell, and V. Kovanis, Physical Review A 60, 1577 (1999).
- Liu et al. (1999) Y. Liu, P. Davis, and T. Takiguchi, Physical Review E 60, 6595 (1999).
- Hegarty et al. (1998) S. P. Hegarty, G. Huyet, P. Porta, and J. G. McInerney, Optics Letters 23, 1206 (1998).
- Hohl et al. (1995) A. Hohl, H. J. C. van der Linde, and R. Roy, Optics Letters 20, 2396 (1995).
- Eguia et al. (1998) Manuel C. Eguia and G. B. Mindlin and M. Giudici, Physical Review E 58, 2636 (1998).
- Lam et al. (2003) W.-S. Lam, O. N. Gudar, and R. Roy, International Journal of Modern Physics B 17, 4128 (2003).
- Sukow et al. (1997) D. W. Sukow, J. R. Gardner, and D. J. Gauthier, Physical Review A 56, R3370 (1997).
- Mrk et al. (1999) J. Mrk, H. Sabbatier, M. P. Srensen, and B. Tromborg, Optics Communications 171, 93 (1999).
- Avila et al. (2004) J. F. M. Avila, H. L. D. de S. Cavalcante, and J. R. Rios Leite, Physical Review Letters 93, 144101 (2004).
- Lang and Kobayashi (1980) R. Lang and K. Kobayashi, IEEE Journal of Quantum Electronics QE-16, 347 (1980).
- Avila et al. (2005) J. F. M. Avila, H. L. D. de S. Cavalcante, and J. R. Rios Leite, Unpublished (2005).