An ant-based algorithm for annular sorting
Abstract
In this paper we describe a minimal model for annular sorting by Leptothorax ants. Simulation results are consistent with the structures observed in actual ant colonies.
1 Introduction
The ability of social insects to collectively solve problems has been well-studied and documented [1]. The behaviour of foraging ants, for example, has been abstracted to provide algorithmic solutions that are robust, distributed and flexible [3, 4]. The particular behaviour that we will focus on is the clustering or sorting of ant corpses or larvae [2]. Abstract models of these behaviours have been successfully applied to, amongst other problems, numerical data analysis, data mining and graph partitioning [6]. In this paper, we focus on the task of brood sorting. This behaviour, when observed in Leptothorax unifasciatus [5], leads to the formation of a single cluster of offspring made up of concentric rings of brood items, with the youngest items (eggs and micro-larvae) being tightly packed at the centre, and successively larger larvae arranged in increasingly wider-spaced bands moving out from the centre of the cluster.
In this paper we investigate an intriguing hypothesis by Franks et al. concerning the biological mechanisms underlying annular sorting. In their article, the authors state that “The mechanism that the ants use to re-create these brood patterns when they move to a new nest is not fully known. Part of the mechanism may involve conditional probabilities of picking up and putting down each item which depend on each item’s neighbours …The mechanisms that set the distance to an item’s neighbour are unknown. They may be pheromones that the brood produce and which tend to diffuse over rather predicable distances …” [5]
We have constructed a corresponding minimal model, using only stochastic ant behaviour and pheremone concentrations, that appears to account for the emergence of annular clusters of objects in simulated Leptothorax colonies. In Section 2 we present the background to the problem, before describing our model in Section 3. We conclude with a summary of our results and discussion of their implications.
2 Annular sorting
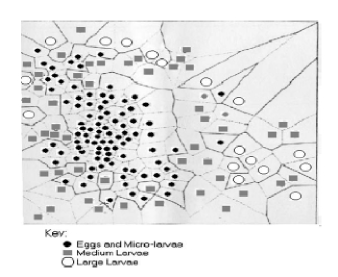
Franks et al. [5] carried out an observational biological study of the brood sorting behaviour of Leptothorax ants. The nesting behaviour of this species made them particularly suitable for study as they nest in single clusters in flat rock crevices, a situation that is easy to replicate and monitor in a laboratory. Photographs were taken of the ants’ brood cluster and individual items in the cluster were classified, before a tessellation was applied to determine density and distance from the cluster centroid. This study showed that Leptothorax ants placed smaller brood items at the centre of the cluster with a greater density, forming an annular cluster. This arrangement reasserted itself when the ants were forced to migrate to a new nesting site, and proved to be an ongoing process. This structure is illustrated in Figure 1, where three different types of brood item are arranged in roughly-sorted concentric rings.
Wilson et al. have recently proposed the first model of “ant-like annular sorting” to simulate the behaviour of Leptothorax ants using minimalist robot and computer simulations [9]. Three models for annular sorting were presented: “Object clustering using objects of different size”, “Extended differential pullback” and “ Combined leaky integrator. The first was run exclusively as a computer simulation, since modifying robots to allow them to move objects of different sizes proved to be too complex. Despite this, the computer simulation modelled physical robot behaviour faithfully, preserving the limitations of movement inherent in simple robots, and even going so far as to build in a 1% sensor error that matched the rate seen in the machines.
The first model explored the theory that annular sorting occurs solely due to the different sizes of the objects involved, Wilson et al. compared this to the manner in which muesli settles in transit, with smaller clusters falling to the bottom, leaving the larger ones on top. The simulation modelled agents who picked up the first object they encountered while unladen and deposited it at the next object they encountered. The results displayed a slight increase in the quality of clusters when there was a greater number of different object sizes; however, clusters tended to form at the edge of the area and were often “inside out”, i.e. with larger objects at the centre surrounded by smaller objects. This lead Wilson et al. to conclude that merely using objects of different sizes did “not create a sufficient muesli effect”.
The second and third models attempted to recreate ant brood clustering behaviour by assigning more complex behaviour to the ants. Wilson et al. hypothesised that ants were able to recognise inherent differences in larval growth, and created annular clusters by depositing different objects at different differences away from each other depending on size. Due to the limitations of the robots, this was implemented by having the agents reverse a distance depending on the kind of object carried before depositing it. Initial results with this approach were not good. As a result Wilson et al. proposed a third model, calling it the “Leaky integrator”. This allowed the agents to have an adaptive amount of “pullback” that varied according to how many objects of the same kind had been encountered in the last seconds. Initial tests with this system produced poor results but results improved when a genetic algorithm was used to select parameter values.
3 Our proposed model
We now propose an alternative model to explain the phenomenon of annular clustering. Ants are represented as “agents”, and brood items of different sizes are represented by “objects”. Agents and objects are spatially-distributed randomly on a two dimensional “board” of fixed dimensions.
Each object has a placement score; agents move randomly across the board, and when they collide with an object they calculate its placement score. This score is then used to probabilistically determine whether the agent should pick up the object and become laden. Laden agents carry objects around the board, and at every timestep they evaluate what placement score the carried object would have if it were to be deposited at the current point. This score is then used to probabilistically determine whether the object should be deposited.
Each category of object to be clustered posses three attributes: size, minimum perimeter and maximum perimeter. Size is important, as objects may not overlap, the other two attributes are both functions of the object’s size. Minimum and maximum perimeter are used in the calculation of the object’s placement score: When evaluating the placement score of an object, the agent counts how many nearby objects fall within the minimum perimeter (these count towards a weighted penalty), and how many fall within the maximum perimeter (these count towards a weighted bonus).
It is important to note that the maximum and minimum perimeters are only calculated for the object whose placement score is currently being evaluated. Agents take no account of whether a placement results in a good or bad score for neighbouring objects, thus small objects with smaller minimum perimeters will frequently be placed quite close to larger objects, resulting in a penalty score for those larger objects. As a result groups of smaller objects will tend to “force out” larger objects. It could be argued that this process implements a stronger version of the size-based muesli analogy proposed by Wilson et al. [9] As stated earlier, the minimum and maximum perimeter values are a function of an object’s size (we describe the exact function shortly). The minimum perimeter of an object acts as a “repulsive” force, whereas the maximum perimeter acts as an “attractive” force. These coupled forces ensure that objects maintain a proportional “exclusion zone”, around themselves, whilst ensuring the coherence of a single cluster around some centroid (“centre of gravity”). We now illustrate this with an example, depicted in Figure 2.

This example shows how larger objects are “forced” out of clusters by their proximity to other objects. The large object in Figure 2 has its minimum perimeter depicted as a dotted line, and its maximum perimeter as a solid line. In Figure 2(a), the object has a high-scoring placement score, as it has no objects within its minimum perimeter (which would attract a penalty), and several objects in its maximum perimeter (attracting a bonus score). However, if several objects are later deposited in the central object’s immediate vicinity (Figure 2(b), its placement score changes for the worse, as these objects contribute a significant penalty. As a result, the next time this object is encountered by an agent it will be carried until it once again has a beneficial placement score (Figure 2(c), where it will be deposited. As we can see, this calculation of placement scores has the effect of moving larger objects away from clusters of smaller objects, whilst maintaining relative proximity.
Before embarking on a full implementation of our algorithm, we carried out test runs using a prototype system. This highlighted two, previously unforseen, effects that we deal with in the full algorithm. Early investigations showed that ants had a tendency to construct good annular clusters, but would then deconstruct them at the outer edge, as there was no termination criterion defined for the algorithm. We solved this problem by introducing the notion of “energy”; each ant starts with a fixed amount of energy, represented as an integer value, which is decremented every time the ant picks up an object. Once the agent’s energy level reaches zero is is removed from the system, and the simulation terminates when there are no more agents left. This prevents the simulation from ending when objects are still being carried, but also has the beneficial effect of smoothly and gradually reducing the overall activity within the system as the simulation approaches termination. The biological validity of this approach is unclear, but it appears to make the clustering of outer objects much more realistic.
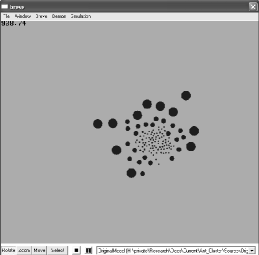
Another problem that was highlighted by the prototype algorithm was that of “chaos”; ants would frequently deposit an object and then immediately pick it up again, as they were still in contact with it. Conversely, ants would also frequently deposit objects after taking a single “step”, particularly if the placement score was moderately good. This behaviour creates clusters in which overall placement was quite poor, as large objects were rarely removed from the centre of the cluster (Figure 3). In order to deal with this problem, a “cooling down” delay period was introduced; agents must wait a set number of steps after picking up or depositing an object before they carrying out any further placement calculations. This appeared to solve the problem; different (non-zero) values for the delay variable impacted only on the run-time of the simulation, and did not affect the quality of clusters generated. A delay value of 4 was chosen for what follows.
3.1 The algorithm
We now describe in detail our algorithm for annular sorting. Ants are modelled by agents, each of which has the following attributes:
-
•
Location (application representation)
-
•
Laden (true/false)
-
•
Object (application representation of object carried if Laden == true)
-
•
Energy (integer)
-
•
Delay (integer)
Objects are modelled as spheres, and have a single attribute, from which their minimum and maximum perimeters are calculated:
-
•
Size (real from the set , corresponding to small, medium or large)
The following variables are defined to deal with objects (all distances are measured from the edge of objects, rather than from their centre):
-
•
BASESCORE (real)
-
•
BONUS (real)
-
•
PENALTY (integer)
-
•
BONUSMULTIPLIER (real) (to calculate maximum perimeter)
-
•
PENALTYMULTIPLIER (real) (to calculate minimum perimeter)
There are objects and ants initially distributed at random on a two-dimensional “board” of fixed size. The number of ants and numbers of objects of each size may be specified in advance. Ants may move over other ants or over objects; there are no spatial restrictions other than those imposed by collisions between unladen ants and objects.
The pseudo-code expression of the algorithm is as follows:
| while (agents exist) | |||||
| for all agents () do | |||||
| // Remove ant if “dead” | |||||
| if (.Energy == 0) | |||||
| remove from system | |||||
| break // i.e. go to next ant, if possible | |||||
| end if | |||||
| // Check delay | |||||
| if (.Delay 0) | |||||
| .Delay = .Delay -1 | |||||
| else | |||||
| // Unladen ant collides with object | |||||
| if (.Laden == false and (.Location == some .Location)) | |||||
| Score = CalculatePlacement() | |||||
| Probability = random) | |||||
| if (Score Probability) | |||||
| .Delay = 4 | |||||
| .Object = | |||||
| .Laden = true | |||||
| .Energy = .Energy - 1 | |||||
| end if | |||||
| end if | |||||
| // Laden ant in free space | |||||
| if (.Laden == true and (.Location == empty)) | |||||
| Score = CalculatePlacement(.Object) | |||||
| Probability = random) | |||||
| if (Score Probability) | |||||
| Place .Object at .Location | |||||
| .Delay = 4 | |||||
| .Laden = false | |||||
| end if | |||||
| end if | |||||
| end if | |||||
| Move to randomly selected adjacent location | |||||
| end for | |||||
| end while |
We now describe the CalculatePlacement() function:
| CalculatePlacement(Object) | ||
| Score = BASESCORE | ||
| for each neighbouring Object | ||
| // “within” calculates Cartesian proximity | ||
| if (.Location within (PENALTYMULTIPLIER * Object.Size)) | ||
| Score = Score - PENALTY | ||
| else | ||
| if (.Location within (BONUSMULTIPLIER * Object.Size)) | ||
| Score = Score + BONUS | ||
| end if | ||
| end for | ||
| return (Score) |
3.2 Implementation
The pseudo-code above was implemented using the Breve111Available at http://www.spiderland.org/breve/ multi-agent system environment [7]. This package facilitates the simulation of decentralised systems, in a similar fashion to the well-known Swarm 222http://www.swarm.org system. The benefits of using such a framework are derived from the fact that it automatically handles issues such as collision detection, construction of object neighbourhoods, and the user interface. This allows the programmer to concentrate effort on the important aspects of the model’s implementation, rather than on “house keeping” issues. All simulations were run on an Apple Macintosh under MacOS, although the code runs equally well on both Linux and Windows machines. An additional Java application was written to deal with post-processing of object coordinates. All code is available, on request, from the corresponding author (MA).
4 Results
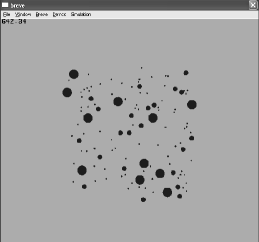
We found that the simulation consistently generated final cluster patterns that are strongly reminiscent of those observed in real colonies by Franks et al. [5]. A typical final pattern is depicted in Figure 4; note the densely-packed core of smaller items at the centre of the cluster, followed by successive “rings” of increasingly larger and more widely-spaced items, as observed in Figure 1.
In order to compare our simulation results with those of Franks et al. [5], we carried out two experiments. In Experiment 1 we ran the simulation 50 times with the following parameter values:
-
•
Number of small brood items = 25
-
•
Number of medium brood items = 25
-
•
Number of large brood items = 25
-
•
BONUSMULTIPLIER = 4.0
-
•
PENALTYMULTIPLIER = 0.4
-
•
Base score = 0
-
•
PENALTY = -50
-
•
BONUS = 0.1
In Experiment 2, we carried out an additional 50 runs, replacing the following parameter values to reflect the object distribution of Colony A in [5]:
-
•
Number of small brood items = 85
-
•
Number of medium brood items = 22
-
•
Number of large brood items = 11
For each experiment, we calculated the mean distance from centroid for each object type. Direct comparisons with the biological study were not possible, due to the different spatial units used; however, dividing the results for distance from centroid by the value of the smallest object gives the ratios described in Table 1. Values for Franks 1 refer to Colony A before migration, and Franks 2 refers to Colony A after migration.
| Size | Franks 1 | Franks 2 | Exp. 1 | Exp. 2 |
|---|---|---|---|---|
| Small | 1 | 1 | 1 | 1 |
| Medium | 1.429 | 1.668 | 1.371 | 1.760 |
| Large | 2.679 | 2.047 | 2.391 | 2.533 |
4.1 Discussion
Comparing the values, we see that the model achieves values for distance from centroid that are very close to those observed in the biological study. The difference between the simulation and reality is about the same as the difference due to migration in the two biological studies.
We also carried out tile size analysis of our results, in order to assess the distribution of objects of different types. However, the only Voronoi tesselation software available to us (VpPlants333http://pages.cpsc.ucalgary.ca/ marina/vpplants/) did not allow the imposition of a bounding box, so we were unable to obtain meaningful comparisons with the tiling results described by Franks et al. [5].
This study has demonstrated a minimalistic model that can consistently sort objects into annular clusters. There are real world examples where this might be useful, particularly when one has objects that may change over time and require different amounts of separation. Some of the aspects that set this study apart from others such as Wilson et al. [9] also make it harder to create a physical implementation. In particular the model relies on the fact that agents are able to pull poorly placed objects out of the centre of a cluster without disturbing other objects or risking collision, something that is hard to do with simple robotics. These difficulties will become less significant as the state of the art advances.
The model proposed in this study works well as an explanation of the sorting behaviour observed in Leptothorax ants. Unfortunately it is not possible to compare the results with those given by Wilson et al. [9] directly as a different performance metric was used. However the model described in this paper does not make use of a complex “leaky integrator” system, or have the unrealistic constraints on movement that were introduced by the robotic implementation used by Wilson et al. [9].
Towards the end of this study an additional paper by Sendova-Franks et al. [8] became available. It presented a further biological study of brood sorting by Leptothorax Ants. As with the previous study [5], ants were induced into nest migration and observed. This time the focus was on the behaviour of the ants and the authors were able to observe two distinct phases. During the “clustering” phase, ants carried brood from the old hive to the new one. During this phase carrying distance was determined by brood size. Ants formed a small cluster inside the new hive with small objects furthest from the entrance and large objects closest. In the second phase the ants spread out the pre-clustered brood items to achieve an annular cluster. This work naturally has some impact on the model proposed in this study but it does not necessarily invalidate it. The behaviour described in this paper could well explain what occurs during the clustering phase seen in [8], the only difference being that the ants start the second phase with the brood already partially clustered. At present it is not clear whether the first phase is actually essential to the process.
5 Conclusions
In this paper we have described a minimal model of annular brood sorting in Leptothorax ants. Simulation results are consistent with the structures observed in actual ant colonies. Our model uses only stochastic ant behaviour and a brood item “repulsion” and “attraction” mechanism, which supports the previous argument that this emergent behaviour may well be linked to pheromone deposition. Further work in this area will include a more detailed analysis of the results in terms of object distribution, as well as continued experimental investigations into the underlying biological mechanisms.
References
- [1] S. Camazine, J.-L. Deneuborg, N. R. Franks, J. Sneyd, G. Theralaz, and E. Bonabeau. Self-organization in biological systems. Princeton University Press, 2001.
- [2] J.-L. Deneubourg, S. Goss, N. Franks, A. Sendova-Franks, C. Detrain, and L. Chretien. The dynamics of collective sorting: Robot-like ants and ant-like robots. In J.-A. Meyer and S. Wilson, editors, Proceedings of the First International Conference on Simulation of Adaptive Behaviour: From Animals to Animats 1, pages 356–365. MIT Press, 1991.
- [3] M. Dorigo, G. Di Caro, and L. M. Gambardella. Ant algorithms for discrete optimization. Artificial Life, 5(2):137–172, 1999.
- [4] Marco Dorigo and Thomas Stutzle. Ant colony optimization. MIT Press, 2004.
- [5] N.R. Franks and A.B. Sendova-Franks. Brood sorting by ants: distributing the workload over the work-surface. Behavioural Ecology and Sociobiology, 30:109–123, 1992.
- [6] J. Handl, J. Knowles, and M. Dorigo. Ant-based clustering: a comparative study of its relative performance with respect to k-means, average link and 1d-som. Technical Report TR/IRIDIA/2003-24, IRIDIA, Universite Libre de Bruxelles, July 2003. http://www.handl.julia.de.
- [7] J.Klein. breve: a 3D simulation environment for the simulation of decentralized systems and artificial life. In Proceedings of Artificial Life VIII, the 8th International Conference on the Simulation and Synthesis of Living Systems, pages 329–334. The MIT Press, 2002.
- [8] Ana B. Sendova-Franks, Samuel R. Scholes, Nigel R. Franks, and Chris Melhuish. Brood sorting by ants: two phases and differential diffusion. Animal Behaviour, 68:1095–1106, 2004.
- [9] Matt Wilson, Chris Melhuish, Ana B. Sendova-Franks, and Samuel Scholes. Algorithms for building annular structures with minimalist robots inspired by brood sorting in ant colonies. Autonomous Robots, 17:115–136, 2004.