Measurement of Mean Flows in Faraday Waves
Abstract
We measure the velocities of the mean flows which are driven by curved rolls in a pattern formation system. Curved rolls in Faraday waves are generated in experimental cells consisting of channels with varying widths. The mean flow magnitudes are found to scale linearly with roll curvatures and squares of wave amplitudes, agreeing with prediction from the analysis of phase dynamics expansion. The effects of the mean flows on reducing roll curvatures are also seen.
Mean flows in pattern formation systems [1] are the large scale flows whose length scales are much longer than the pattern wavelengths. As the patterns are convected by the mean flows, the latters play important roles in shaping the patterns. In fluids with two dimensional patterns, mean flows arise when vertical vorticities are driven by the roll curvature and amplitude modulation [2]. In this paper we present first direct measurement of magnitudes of such mean flows and their relationship with the spatial inhomogeneity of patterns.
In the canonical example of pattern formation, the Rayleigh-Bénard convection (RBC), mean flows are believed to play essential roles in at least three kinds of patterns. The first is the appearance of chaotic states close to onset in a large-aspect-ratio cylindrical cell with a low Prandtl number fluid [3]. It was shown that a key element for understanding these results is the generation of mean flows, as modeled in the Swift-Hohenberg type model equations [4].
In the second case, a non-Boussinesq fluid was observed to undergo a transition from hexagonal patterns to roll states further away from the threshold. However the roll states tend to form rotating spiral patterns in the cylindrical cells, with different possible numbers of arms [5]. Again simulations coupling the Swift-Hohenberg equation for non-Boussinesq fluids with mean flows were found to produce similar rotating spiral states [6].
Finally, chaotic patterns consisting of many rotating spirals and other defects were seen in RBC [7] and termed spiral defect chaos (SDC). Three studies have strongly implied the importance of mean flows. Simulations of the Swift-Hohenberg equation coupled with mean flows have reproduced chaotic states similar to SDC [8]. Experimentally, with fluids of different Prandtl numbers , it was shown that the onset of SDC increases linearly with [9]. This suggests the essential role of the mean flows whose magnitudes are decreasing with . Recently a procedure was devised to suppress mean flows in numerical simulations of full fluid equations [10]. The results showed the collapse of SDC to stationary textures of stripes with angular bends when the mean flows are suppressed.
So it is well established that the mean flows are important in the formation and dynamics of many interesting patterns in RBC. However direct measurement of mean flows in RBC has been difficult, due largely to the fact that the mean flow velocity is very small. Although the phase dynamics expansion analysis [11, 12] has given predictions about dependence of the mean flow magnitudes on pattern inhomogeneity, confirmation of these predictions are lacking without direct measurement. One experiment has confirmed the existence of the large scale flows [13] in a distorted target pattern. However the results were very qualitative and the information for mean flow strength is lacking.
In this paper, we measure mean flows in a different pattern formation system, the so called Faraday waves [14]. In a fluid with a free surface being vibrated vertically, surface waves are excited when the vibration amplitude exceeds a frequency-dependent critical value. Subharmonic standing waves usually have the lowest threshold driving amplitudes, i.e., the wave frequency being half of the driving frequency. By using a suitable cell geometry, we generate waves with curved wavefronts. Furthermore the patterns are semi-static, namely the only pattern dynamics is the convection by steady mean flows. Detail measurement then becomes feasible.
Singular expansion of phase dynamics in RBC [11, 12] has predicted that near threshold the mean flows are linear to the wavefront curvatures and the square of wave amplitudes. We will argue that these predictions should also be true in Faraday waves. We test our measured mean flow velocities with these predictions and find good agreements.
It is noted that in Faraday waves, coupled amplitude-mean flow equations are derived for patterns consisting of multi-mode plane waves [15]. The formulations predict non-vanishing coupling between the mean flows and patterns when the patterns satisfy some symmetry requirements.
Mean flows also appear in other non-fluid pattern formation systems, for example in lasers [16]. It was shown that an asymptotic expansion on the small detuning parameter of the Maxwell-Bloch laser equations in the so-called class B lasers leads to the coupled Swift-Hohenberg-mean flow equations. In this case, the role of mean flows is played by the density of population inversion.
We setup a typical Faraday wave system where a cell made of acrylic plastic is mounted on a mechanical vibrator. Distilled water is used as the working fluid and driving frequencies are in the range of 150 and 350 Hz. An accelerometer is mounted on the cell for the monitoring of sinusoidal oscillations.
In the range of experimental parameters we use, it is known that the patterns appearing near threshold in an infinite system are square patterns which consist of two sets of plane standing waves with perpendicular wavevectors [17]. However regular roll states could be prepared in rectangular cells with rolls parallel to the short sides. For example, accurate measurement of wave amplitudes is done using this technique [18].
It is also well-known that rolls like to approach cell boundaries perpendicularly. This is seen most dramatically in the Rayleigh-Bénard convection in a circular cell [1], where rolls form two loci approximately opposite to each other on the boundary.
These two properties are exploited in our experiments to produce regular curved rolls. Two types of cells are used as shown in Fig. 1 and 2. Both cells basically consist of close-loop channels and, more importantly, the channel widths are not uniform. When the rolls in the converging segments try to align perpendicularly to the non-parallel side walls, they become curved. Furthermore, the converging segments make rolls curving toward the same direction in terms of transversing the channel loop. Mean flows driven by curved rolls then form circulating flows.

Cell A has a rotating central divider whose tilting angle can be continuously adjusted. Parallel (to the cell boundary) central divider produces steady straight standing waves. Tilted divider causes curved rolls which are seen to be convected by the mean flow. (Clockwise direction in Fig. 1.) At larger titling angles, near the cell end with the larger opening some irregular wave patterns are present. Two cell B’s with and are used. Roll patterns in cell B’s are regular in the whole cell with straight rolls in fixed-width segments.
For the data shown in this paper, cell A is filled with 15 ml of water and driven at the frequency of 200 Hz. Cell B has 10 ml of water and is driven at 303 Hz.
The mean flow velocity would be given by the balance between the cell converging angles, roll curvatures and flow drags. Flow resistances could come from the side walls and the dissipation cost of turning around the two ends. It is a nice surprise to see that in cell B the waves maintain straight rolls at the cell ends. Perhaps this is due to the strong tendency of the roll to align perpendicular to side walls and strong correlation between rolls.
A laser deflection method is used to measure the mean flow velocity. A laser light is shining through the experimental cell vertically and the sloping fluid surface deflects the light. The light spot forming on a screen beneath the cell oscillates due to the changing slope of the fluid surface produced by the wave motion. Because the wave frequencies we use are much larger than the sampling rates of both the human eyes and standard video recording (1/30 second), a light track with a particular length appears on the screen.
With a fixed standing wave, the length of light track depends on where in the wave the light is shining through. If the light is exactly at the wave peak (which becomes trough half the wave period later), the light will not be deflected at all because the fluid surface is always locally flat. The light track becomes a spot. On the other hand if the light is on the nodal position of the waves, the changing slope will be the largest and so is the light track length.
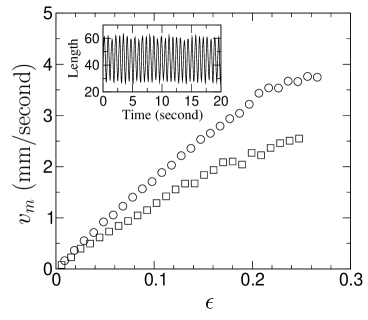
When the wave pattern is convected by the mean flow, the length of light track on screen changes periodically as the wave is passing through the laser light. One example is shown in the inset of Fig. 3. Since the wavelength is known, the temporal periods of light track length modulations then correspond to the mean flow velocities.
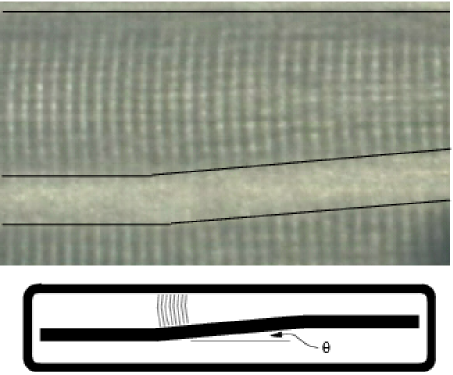
Images as shown in Fig. 2 are taken by the shadow graph method in which parallel lights shining through the transparent cell from bottom cast an image on a screen placed horizontally on top of the cell. Such images are used to measure roll curvatures.
The phase dynamics expansion [11] predicts that near threshold the mean flow is proportional to , with the local wavevector and the wave amplitude. Physically, mean flows are driven by the large scale (compared to the roll periodicity) pressure field , which arises from the inhomogeneity of patterns. Here the superscript denotes the zero order term on the expansion of the small expansion parameter , taken as the ratio between the wavelength and system size.
Following Eq. (A.26) and (A.27) of Cross and Newell [11], the pressure gradient is driven by the average , here is the zeroth order velocity field of rolls. The average is taken over one wavelength. For inhomogeneous roll states, large scale components then arise from . This leads to the conclusion that the mean flow becomes , with representing an integral over one period of the periodic straight roll solutions.
Similar formulation in Faraday waves has not been derived. However, if a similar expansion analysis is carried out, we expect that the mean flow should follow a similar form, , with the proportional constant an integral over a wavelength as well as a temporal wave period of the velocity field in Faraday waves roll solutions. The conclusions are that the mean flow will be proportional to the roll curvature () and the square of the wave amplitude . Our measured flow velocity will be tested against these dependences.
A picture of roll patterns is shown in Fig. 2. Direction of the mean flow is clockwise and in such direction the flow is opposing the roll curvature. As the waves are seen to be convected uniformly in the whole cell, this implies that the mean flow is uniform along the channel. This seems contradicting the mass conservation since the channel width is varying. However the dependence of the mean flow on the vertical coordinate can ensure both the mass conservation and a constant velocity near the fluid surface.
The mean flows measured from the convection of rolls are shown in Fig. 3 and Fig. 4 as functions of the reduced driving amplitudes , defined as . Here is the critical driving amplitudes and determined by fitting the data with at small , given and as the fitting parameters. The fittings are drawn as solid lines in Fig. 4. We see the mean flows scale linearly with , at least for small . In cell B the linear relations extend to fairly large ’s, probably because the cell B does not generate irregular wave patterns near the cell ends. It is well established that the wave amplitudes scale linearly with , for example, as measured in Faraday waves [18]. Our wave amplitude data (not shown here) from the light track length measurement also confirm this. Thus we first conclude that that is proportional to as predicted.

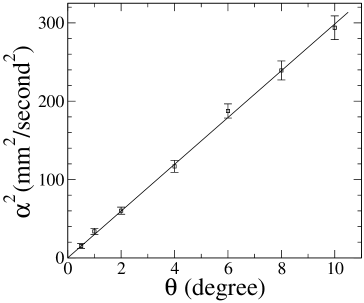
Next we want to establish the relationship between the mean flows and roll curvatures. In Fig. 5 we plot from cell A the slope of the fitting between and , with respect to the channel converging angles in the experimental cell. The geometry of the cell limits the maximum angle at about 10 degrees. The data show a good fit with the relation
| (1) |
From geometrical consideration of the converging channels, if the rolls are truely perpendicular to the side walls, the roll curvatures should be proportional to : . Since it is predicted that the mean flow is proportional to , this seems contradicting the data. However we believe that the data are also reflecting another effect, namely that the mean flows are flowing in the direction of opposing roll curvatures. With and have opposite effects on curvatures, in the lowest order we might expect the dependence,
Combining with leads to .
This relation of course can be directly checked by the measurement of roll curvatures. However their accurate measurements from shadow-graph images are difficult, mainly because the curved rolls are relatively short compared to . There are also further complication that the curvatures are not uniform in the whole cell. We did test the curvatures in cell B. In cell B, since maximum curvatures are observed to be at the beginning of the converging segments, the following procedure is used to determine a curvature for each image: Eight arcs of the same curvature are used to fit the patterns, as illustrated in the bottom graph of Fig. 2. Best match to the patterns gives an averaged curvature value. For the two B cells used, the ratios are found to be (in an arbitrary unit) for and for . These values are consistent with a linear relation between and . However the errors are relatively large.
In conclusion, we have measured the mean flow velocities driven by curved rolls in Faraday waves. The dependence of the mean flow on wave amplitudes and roll curvatures as predicted by the phase dynamics expansion are confirmed. The effects of the mean flows on reducing roll curvatures are also seen in our data.
This work is supported by National Science Council of Taiwan.
References
- [1] M. C. Cross and P. C. Hohenberg, Rev. Mod. Phys. 65, 851 (1993).
- [2] E. D. Siggia and A. Zippelius, Phys. Rev. Lett. 47, 835 (1981); A. Zippelius and E. D. Siggia, Phys. Rev. A 26, 1788 (1982).
- [3] G. Ahlers and R. P. Behringer, Phys. Rev. Lett. 40, 712 (1978); G. Ahlers and R. P. Behringer, Prog. Theor. Phys. Suppl. 64, 186 (1978).
- [4] H. S. Greenside, M. C. Cross, and W. M. Coughran, Jr., Phys. Rev. Lett. 60, 2269 (1988).
- [5] E. Bodenschatz, J. R. de Bruyn, G. Ahlers, and D. S. Cannell, Phys. Rev. Lett. 67, 3078 (1991).
- [6] H.-W. Xi and J. D. Gunton, Phys. Rev. E 45, R2987 (1993).
- [7] S. W. Morris, E. Bodenschatz, D. S. Cannel, and G. Ahlers, Phys. Rev. Lett. 71, 2026 (1993).
- [8] H.-W. Xi, J. D. Gunton, and J. Viñals, Phys. Rev. Lett. 71, 2030 (1993).
- [9] J. Liu and G. Ahlers, Phys. Rev. Lett. 77, 3126 (1996).
- [10] K.-H. Chiam, M. R. Paul, M. C. Cross, and H. S. Greenside, Phys. Rev. E 67, 056206 (2003).
- [11] M. C. Cross and A. C. Newell, Physica (Amsterdam) 10D, 299 (1984).
- [12] A. C. Newell, T. Passot, and M. Souli, Phys. Rev. Lett. 64, 2378 (1990).
- [13] V. Croquette, P. Le Gal, A. Pocheau, and R. Guglielmetti, Europhys. Lett. 1, 393 (1986).
- [14] H. W. Müller, R. Friedrich, and D. Papathanassiou, in Evolution of Spontaneous Structures in Dissipative Continuous Systems, edited by F. Busse and S. C. Müller (Springer, New York, 1998), p. 230.
- [15] M. J. Higuera, J. M. Vega, and E. Knobloch, in Coherent Structures in Complex Systems, edited by D. Reguera, L. L. Bonilla, and J. M. Rubi (Springer, Berlin, 2001), p. 328.
- [16] J. Lega, J. V. Moloney, and A. C. Newell, Phys. Rev. Lett. 73, 2978 (1994).
- [17] See, for example, D. Binks and W. van de Water, Phys. Rev. Lett. 78, 4043 (1997).
- [18] A. Wernet et. al., Phys. Rev. E. 63, 036305 (2001).