Spontaneous Channelization in Permeable Ground: Theory, Experiment, and Observation
Abstract
Landscapes that are rhythmically dissected by natural drainage channels exist in various geologic and climatic settings. Such landscapes are characterized by a length-scale for the lateral spacing between channels. We observe a small-scale version of this process in the form of beach rills and reproduce channelization in a table-top seepage experiment. On the beach as well as in the experiments, channels are spontaneously incised by surface flow, but once initiated, they grow due to water emerging from underground. Field observation and experiment suggest the process can be described in terms of flow through a homogeneous porous medium with a freely shaped water table. According to this theory, small deformations of the underground water table amplify the flux into the channel and lead to further growth, a phenomenon we call “Wentworth instability”. Piracy of groundwater can occur over distances much larger than the channel width. Channel spacing coarsens with time, until channels reach their maximum length.
1 Introduction
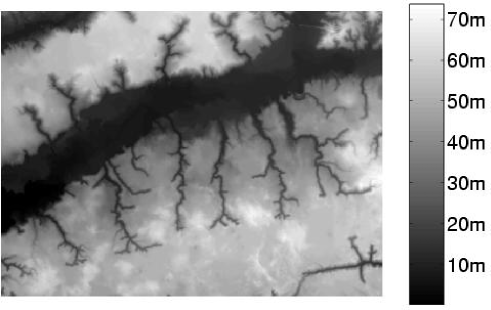
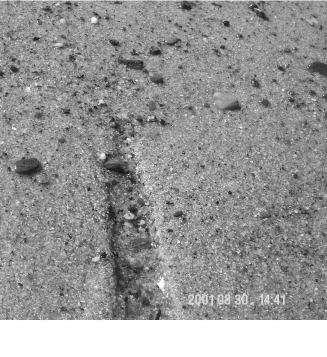
Nature frequently exhibits regularly spaced channels that are formed by fluvial erosion. Figure 1 shows one such example with approximately regularly spaced drainage outlets. The spacing in naturally occurring examples varies from tens of centimeters to tens of kilometers, spanning five orders of magnitude. Some examples are more nearly periodic than others, but in either case there is a typical length-scale for the lateral separation of streams. This length-scale is of interest not only because it determines the shape of landforms around us, but also because it sets one of the scales of variation in the heterogeneities of sedimentary deposits (Talling et al., 1997).
The ubiquity of this phenomenon further motivates its study. Periodically spaced drainage outlets are observed in various climates and geologic settings, such as mountain belts (Hovius, 1996), fault blocks (Talling et al., 1997), submarine canyons (Inman et al., 1979; Orange et al., 1994), valleys of volcanic islands (Wentworth, 1928; Kochel & Piper, 1986), sapping canyons (Howard et al., 1988; Schumm et al., 1995), and Martian gullies (Malin & Edgett, 2000). The ubiquity of the periodicity implies a common phenomenon but not a common cause. Indeed, as we now proceed to review, theoretical formulations of erosion initiated by seepage and overland flow indicate that characteristic spacings are expected, but not necessarily for the same reasons. It is unclear whether the various forms of periodic channel spacing are due to a few basically similar mechanisms or if there are many essentially different explanations. There are many conceivable explanations for the periodicity. We approach this rich phenomenology by a detailed study of one specific example that is particularly accessible to study.
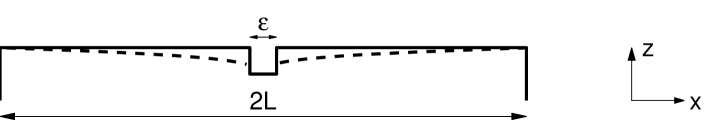
Broadly stated, two “end-members” delimit processes of channelization (Kirkby & Chorley, 1967; Dunne, 1980). At one extreme is erosion due to overland flow, wherein shear stresses imposed by a thin sheet of water flowing downhill act to erode a surface (Horton, 1945). At the other extreme is erosion due to groundwater flow (Kirkby & Chorley, 1967; Dunne, 1980, 1990). When a subsurface flow erodes a porous material as it emerges from the material, the process is called seepage erosion (or sapping). Overland flow and seepage erosion are illustrated schematically in Figure 2.
a)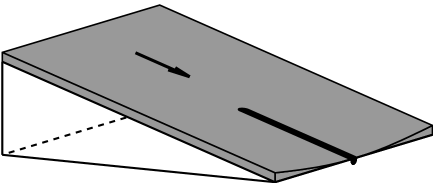
b)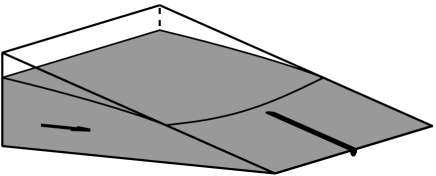
A continuum model for overland flow was given in a landmark paper by Smith & Bretherton (1972). It was shown that under certain circumstances the eroding surface is unstable to sinusoidal channel-like patterns. However they found that the most unstable wavenumber was infinite, implying that the most unstable wavelength is at the microscopic granular scale. Noting this deficiency, Izumi & Parker (1995) provided an alternative theory based on two components: a threshold condition for erosion and analysis of the full equations for shallow overland flow. The inclusion of the threshold condition yields an instability at a finite wavelength, a finite distance from the divide. This result shows that periodic channelization can occur entirely as a consequence of its own dynamics. Under different circumstances, a finite wavelength can even emerge without any threshold condition (Izumi & Parker, 2000).
The theory of seepage erosion is less well developed. As stated by Dunne (1990), “there have been no formal quantitative studies of the relation between the hydrogeologic properties [of material undergoing seepage erosion] and the average spacing of channels.” Dunne (1980, 1990), however, provides a physically appealing description. The pressure head in a horizontal or tilted plane leads to high pressure gradients at places of high local curvature, and hence presumably to enhanced erosion. This instability leads to the growth of channels. A similar but more complex situation is depicted in Figure 2b, where a channel on an inclined slope is eroded below the point where the water table intersects the surface. Once a channel forms, internal flow lines are focused toward it. As we show below, the focusing occurs over a large but finite transverse extent, which is presumably related to a characteristic channel spacing, the presence of which requires no heterogeneities in material properties.
Documented experimental studies go back at least a century (Jaggar, 1908). In the 1980’s, seepage experiments (Kochel et al., 1985; Kochel & Piper, 1986; Schumm et al., 1987; Howard, 1988; Kochel et al., 1988) were frequently concerned with analogy to Martian valleys. The question of whether ancient martian channels are created by seepage or vast amounts of surface water remains open today (Baker, 1982; Laity & Malin, 1985; Baker, 1990; Aharonson et al., 2002). Our own experiments are motivated by terrestrial analogs. Previous experimental work suggests that groundwater piracy plays a dominant role in the development of channels. Howard & McLane (1988) studied the rate of seepage erosion in a narrow two-dimensional flow tank. Howard (1994, 1995) has carried out computer simulation modeling of valley development by groundwater sapping.
The present study is a first report of our effort to conduct field studies, experiments, and theory simultaneously to address the formation of channels, and rhythmic channelization in particular, by fluvial erosion when substantial groundwater flow is present. The following three sections cover, respectively, field study, experiment, and theory. The last section contains conclusions that we are able to draw so far.
2 Field Study: Beach Rills
Beach rills (Komar, 1976) can serve as inspiration for larger-scale drainage channels forming over geologic time periods (Higgins, 1982). While incised channels are not uncommon on sand beaches, periodic channelization is rarer. Two suitable sites where small incised channels form when the tide recedes are located on Cape Cod. One is at Provincetown, Massachusetts, a few minutes walk north of the main pier, the other at Mayo Beach in Wellfleet, Massachusetts. At high tide the sand is soaked with water, which seeps out as the water recedes. The tidal difference at both locations is typically 3 meters. All channels are erased when the tide rises again and they reform at different locations during the next tidal retreat. One can observe the generation of the channels on a daily basis.
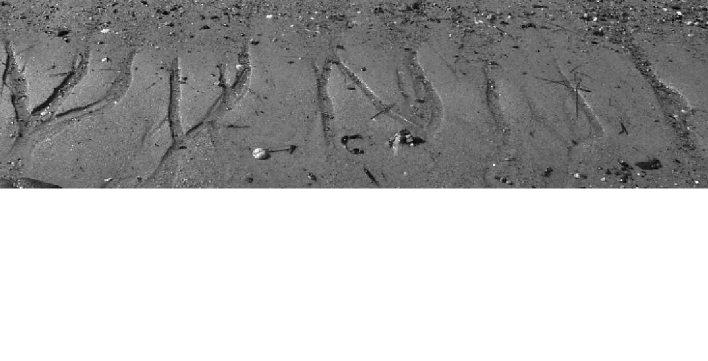
The channels found on the beach are sharply incised (Figure 3). They have steep side walls so that their cross section becomes almost rectangular and they are about one centimeter wide. The sand grains are fairly distributed in size, around a mean of about 1mm. At the Provincetown site, the average channel spacing, based on over 200 measurements, is about 40cm. The spacing is measured near the head of the rills. Depending on the height of the tide, we observe 1-5 generations (bands) of channels, with typical lengths of 0.7-2m. Many channels begin at pebbles, others start without visible perturbation. Further downhill, channels often merge and braid. The beach slope is 10-12%, terminated by a 1% slope that emerges only at low tide. At the Wellfleet site, the spacing is about 1m, based on 38 channels, and the slope is 4%, also terminated by a lower slope. There are no pebbles at this site.
We have observed channels several times during their initiation and growth at the Provincetown site. A vertical test hole allows us to monitor the ground water level as a function of time. The water table inside the beach sinks 1cm every 3 minutes during the hours before channel initiation. During the same time, the sea level sinks about three times as fast. Hence, the height difference between water table and sea level increases steadily until, about three hours after high tide, the pressure head suffices to form channels.
The channels clearly form outside the water and are not directly related to the waves that hit the beach. Waves arrive occasionally and wash water up the beach, subsequently leading to a sheet of water flowing downhill. Pebbles interfere with this flow and temporarily cause cone-like flow patterns. These disturbances in the flow can lead to an incised streak downhill of the pebble which eventually grows into a channel. The initial incision happens within seconds or less and leaves a streak on the order of 10cm long. Not all channels are initiated this way. Another frequent initiation mechanism results from “fingers” of runoff water from any sources higher up (water ponding behind stones or from higher-lying, previous channels). Areas without surface defects sometimes do not develop any channels. At other locations even tiny perturbations suffice for initiation and empty areas are “filled in” with channels. As far as one can see on the surface, the periodicity is established promptly (within a minute or so).
Once a channel has initiated it grows downhill. Sand is washed away at the lower end of the channel by water running in the channel. At the downward end of the channel, where the longitudinal extension occurs, the water appears to be fully loaded with sediment. There is mass wasting on the sides so that the channels widen slowly; they also deepen slowly. Sand grains are transported by the water flowing in the channel. The rills grow to their final size within minutes to tens of minutes.
Figure 4 shows a channel filled with water. The channel could be fed either by surface water that seeped out above the channel, or directly from groundwater provided from the bottom and sides of the channel. We found that they are directly fed by groundwater, for the following reasons. The film of water above the channel shows no movement visible to the eye. Small grains, placed by us on the surface, diffuse only slowly at speeds that are insufficient to provide the large amounts of water seen inside the channels. The channels carry water for quite some time after the initiation and long channels continue to be filled with water when the surface at its head is already dry. All this shows that the channels are fed directly by groundwater.
The beach rills provide a natural example of rhythmic channelization and the observations suggest that they require seepage for their explanation.
3 Seepage Experiments
3.1 Experimental Setup and Channels
Prior experimental studies of seepage erosion (Kochel et al., 1985; Kochel & Piper, 1986; Howard, 1988; Kochel et al., 1988) have observed a few periodic channels. Our own experimental setup is shown in Figure 5. The plexiglass box is 120cm wide and effectively 90cm long. It is filled with 0.5mm glass beads. Water is pooled in the back and kept at a constant level using an overflow tube. The water seeps through the granular medium and creates channels on the slope, observed by a CCD camera. Sideways illumination makes the channels clearly visible in the image. The experiments are carried out with a steady water reservoir, unlike the beach where the water table is receding.
A ledge protrudes at the bottom to increase the flux through the system. A minimum flux is required to dislodge a grain on an inclined surface which is below its angle of repose. The ledge makes it possible to achieve the threshold in a finite sized experimental apparatus, by allowing us to increase the height of the water column in the reservoir above the height of the granular bed. The resulting flux is also similar to that observed at the beach when channels are formed. Thus the ledge allows us to reproduce the processes observed on the beach in a finite sized experimental system. We did not observe any channels without the ledge.
The capillary height in the medium is measured to be 25mm. The permeability is determined from flow through a U-tube. A water column of height seeping through a porous medium over a distance flows with a velocity of . The seepage coefficient is 3 mm/s. Sand from the beach, with its moderately larger grain size, has a moderately higher permeability, 8 mm/s.
a)
b)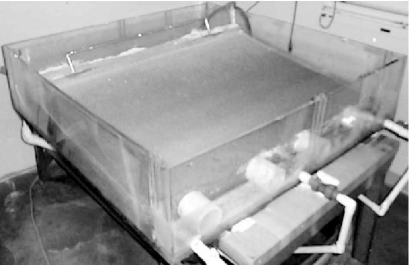
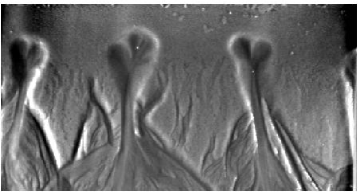
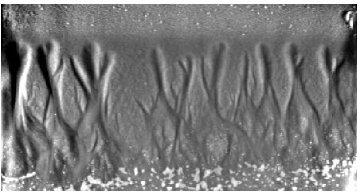
Before the beginning of each experiment a planar, sloped surface is created, then the water column in the back is filled to a prescribed height , and the camera is turned on. The height of the water column is measured from the bottom of the tank. Figure 6 shows examples of laboratory channels. These images are taken less than half an hour into the experiment. Figure 6c shows about 10 drainage channels. Figure 6d corresponds to a slump observed at high slopes. In this paper, we only report on patterns of fairly straight channels. Other erosion patterns, some of which are found by Daerr et al. (2003) in a different experimental setup, are observed in various parameter regions.
| a) hW=13.8cm, s=11%, t=28 min | b) hW=16.2cm, s=11%, t=18 min |
 |
 |
| c) hW=15.8cm, s=10%, t=18 min | d) hW=13.4cm, s=16%, t=2 min |
 |
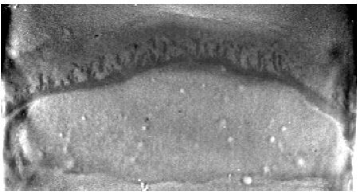 |
Channels such as those in Figure 6a-c are observed within a limited range of slopes and water column heights. Figure 7 summarizes the parameter regions for which experiments were carried out. In our early experiments, parameters were not accurately controlled, but Figure 7 corresponds to a later set of experiments conducted with a constant experimental setup. Channel formation is observed for slopes 17%. This slope is much less than the angle of repose of completely dry or saturated glass beads which is approximately 43%. For the particular level of box filling, channels are not observed below a water column height of 12cm.
The mere observation of regularly spaced channels in the experiment immediately constrains possible explanations. The medium is composed of mono-disperse, cohesionless glass beads. The fluid is clean water. This is all that is required to create periodic channels. Reproducing channelization in a clean and controlled environment is a major step in studying the phenomenon and provides the basis for theoretical modeling.
3.2 Temporal Evolution
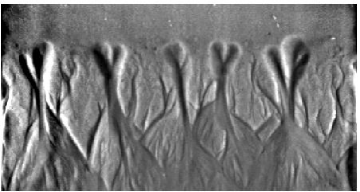
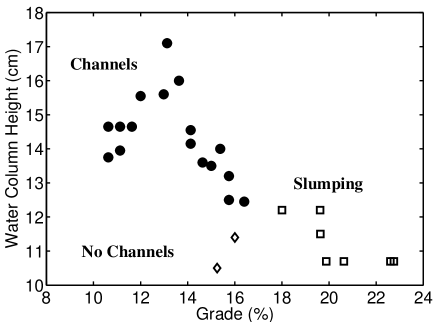
Figure 8 shows a time sequence of six images of the same experimental run. The channels are initiated after a sheet of water flows down the surface. The sheet disappears and the channels deepen, widen, and grow lengthward. This is similar to the beach rills, where channels are also initiated by surface water, then grow downhill by washing away sand at the lower end of the channel. Unlike the beach, the experimental channels, in addition to growing downward, also grow headwards until they stop at the point where the ledge ends. Channels grow initially (quickly) downwards and then slowly upwards (headward). After the channels have reached their maximum length they still widen and occasionally meander and fan at the lower end.
The spacing of initial channels, Figure 8c, is also apparently not random. It may result from an instability in the initial sheet flow (e.g. Huppert, 1982) or from the interaction of the sheet flow with the eroding surface. Any threshold for incision is likely related to the sheet flow, rather than to the force exerted on the grains by water emerging directly from underground.
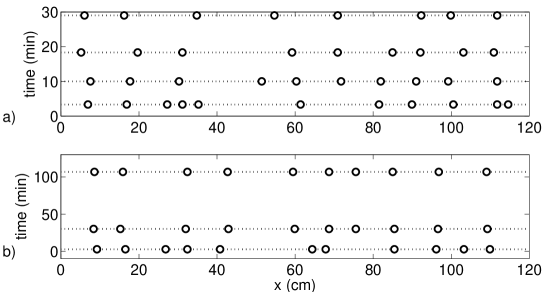
Figures 8 and 9 show spatial coarsening over the period of channel development. Only some of the initial channels grow into larger channels, while others cease their growth. For example, in Figure 8f there are several smaller channels visible that have stopped growing. This is especially the case when another channel is nearby. Growing channels tap into the groundwater supply of their neighbors, which then cease to grow due to the lack of groundwater. On the other hand, new channels still form after the initial incisions, especially when far from existing channels. Figure 8d shows two examples. Both of these processes – the competition of nearby channels and the formation of new channels away from existing ones – eventually lead to a more regular spacing.
In experiment (a) of Figure 9 there are 11 initial channels, of which 5 eventually cease to grow. The other 6 initial channels grow into major final channels along with 2 channels that formed at a later stage. In experiment (b) there are 11 initial channels, of which 3 cease to grow and two additional channels form at a later time. These numbers indicate that many of the big final channels have grown directly from small initial channels. However, the selection of which channels dry up and where new channels form is influenced by the distance to neighboring channels, so that the spacing is dynamically created or at least dynamically grown from the initial state. Channel locations have more of an imprint of the initial state than does the spacing between them. Incision behavior and groundwater piracy contribute to the final state. With more separation in time and space between initial and final configuration one would expect an even larger spacing, which has little to do with the initial state.
4 Theory and Numerical Simulation
4.1 Governing Equation
As a result of the observations on the beach and in the experiment, the problem can be formulated theoretically in terms of flow through a porous medium. After channel initiation, the supply of water to the channel is governed by groundwater flow. The erosion at the channel boundaries, especially at the lower end of the channel, is governed by the amount of groundwater collected in the channel. Our aim is to determine the extent of the groundwater piracy which limits the growth of channels.
The presence of long tubular structures in the soil, or “macropores,” could significantly influence the flux of water through the medium. We have not observed any such pores. The material is cohesionless and cohesionless grains cannot sustain voids and therefore macropores are not expected. According to the observational and theoretical evidence, we discard this possibility (no gophers). Local density variations may be possible.
In a porous medium, the velocity is given by Darcy’s law (Polubarinova-Kochina, 1962)
| (1) |
where is the seepage constant, is the pressure, the density, Earth’s acceleration constant, and the unit vector in the direction of gravity. (The permeability of the medium is directly related to the seepage coefficient through , where is the viscosity of the fluid.) Since the fluid is incompressible, , and it follows from (1) that
| (2) |
Boundary conditions are shown in Figure 10 for a stationary situation. The bottom of the tank is impermeable, the water column in the back is represented by a linearly varying pressure, and atmospheric pressure is applied at the seepage surface. At the water table there is atmospheric pressure, , and the velocity is tangential. The shape of this free surface adjusts such that both boundary conditions are satisfied simultaneously. The pressure distribution and the shape of the free surface are independent of the parameter , since neither the Laplace equation (2) nor the boundary conditions depend on . The shape of the water table is also independent of , since the boundary conditions and the Laplace equation can be written in terms of . (The limit poses no physical problem, since for every shape is permissible.) While velocities depend on and , the water table is purely determined by the geometry of the boundaries. This is also obeyed by the known exact solutions for unconfined flow (Polubarinova-Kochina, 1962, Chap. VII).

In the above formulation of flow in a porous medium, capillarity and evaporation are ignored. Evaporation should be negligible over the time period the channels form. On the beach and in the experiment the capillary height exceeds the depth of the channels, and hence the capillary forces may prevent the detachment of the water table from the surface. However, the capillary effect vanishes for larger scale landscapes. Further consideration of the potential role of capillary forces will be necessary before detailed quantitative comparisons with experiments are made. We expect however, that our qualitative conclusions will be independent of these issues, because ground water piracy takes place in either case.
4.2 Numerical Method; Planar Sloped Surface
Polubarinova-Kochina (1962) provides a comprehensive collection of analytic solutions to problems of groundwater movement, but most geometries need to be solved numerically. We solve the Laplace equation numerically with a conventional relaxation method on a regular grid. The scheme uses the pressure at the six neighboring grid points and iterates until the pressure field has converged. At the free boundary, cells are no longer treated as rectangular, but in the three-dimensional finite difference approximation of the Laplace operator, the exact location of boundary point(s) is taken into account. At the free boundary, atmospheric pressure is imposed and the free surface is moved until it is stationary, using a simple first-order time integration. The time-advanced grid points representing the free surface no longer lie on a regularly spaced grid and are interpolated back onto a rectangular grid at each integration step. In three dimensions, when the free surface is two-dimensional, the interpolation fits a plane through three nearby points. The three points are chosen such that without variations along the -axis, one exactly recovers a one-dimensional, linear interpolation scheme. Hence, three-dimensional simulations without variation along the -direction yield exactly the same results as two-dimensional simulations. The numerics are tested by comparison with the analytic solution of the vertical dam (Polubarinova-Kochina, 1962, eqs. VII.10.34, 10.35, 10.41) and with analytical estimates for the flux through a wedge (Polubarinova-Kochina, 1962, eq. VII.12.12).
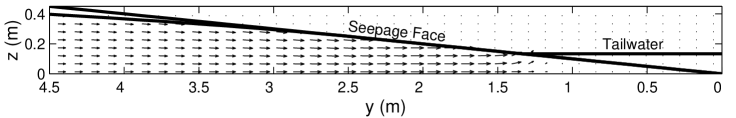
Figure 11 shows the velocity field in a geometry similar to the beach (without channels). As the height of the water table decreases along the horizontal direction, the velocity increases as a result of the incompressibility of the flow.
There are approximate solutions for a wedge without tailwater (Polubarinova-Kochina, 1962). If the slope is small and the wedge is long, then the height at which the water table intersects the surface (see Figure 10) is approximately , where is the flux per unit width and the seepage constant. The average horizontal velocity at the point where the water table intersects the surface is , hence
| (3) |
The velocity increases with slope, because decreases with slope. Since the velocity changes little along the vertical (see Figure 11), the average velocity is a good approximation to the velocity at the intersection, . Hence, the velocity with which water emerges at the seepage face is higher for higher slopes. Our numerical simulations show that for slopes of 10% or smaller the presence of tailwater does not change the velocity significantly.
4.3 Wentworth Instability
So far we have only considered seepage without channels. Channels can be represented in the simulation by applying the atmospheric boundary condition at a properly shaped surface. This shape is the planar seepage surface with channels carved out. The depth of water running within channels is neglected.
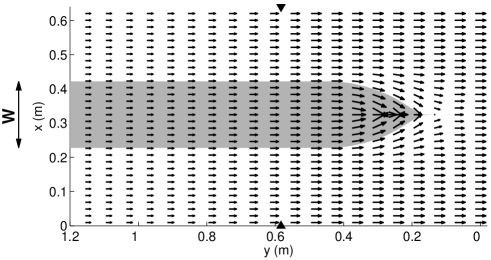
The presence of a channel perturbs the flow field. Once a channel is formed, flow lines focus toward it, but furthermore it leads to inclination of the underground water table in response to an outlet channel. Figure 12a illustrates the deformation of the underground water table. This brings even more water to the channel and promptly acts as an efficient instability mechanism. This scenario was qualitatively described by Wentworth (1928) in the context of Hawaiian valleys. Hence, we refer to it as “Wentworth Instability”. Figure 12b shows the velocity field on the water surface. The channel collects flow over a certain lateral distance, hence suppressing the growth of other channels nearby, due to groundwater competition.
a)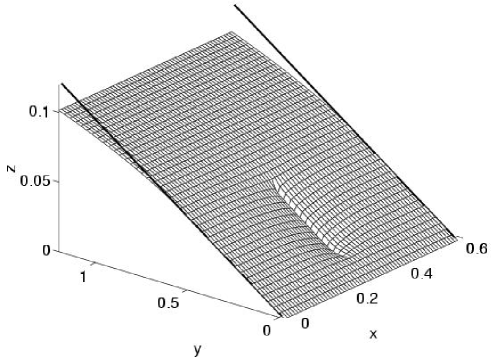
b)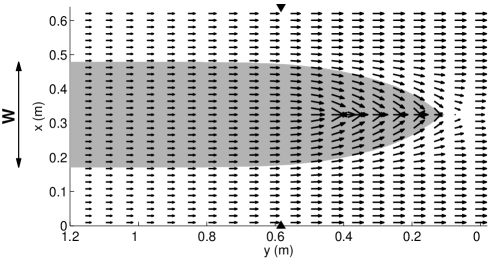
The area over which the channel draws water can be visualized by following the flow lines which reach from the water reservoir to the bottom end of the channel. The vertical component of velocity, , is small and approximate flow lines are obtained by integrating the horizontal components of the velocity field. The geometry of the region of influence (the shaded region in Figure 12b) is again purely determined by the geometry of the boundaries, including the dimensions and position of the channel. It is independent of density, permeability, and other material properties. The extent of this drainage area (or drainage volume) describes the screening effect of the channel and is therefore a relevant mathematical problem in this context.
The overall downhill velocity is approximately constant along the seepage face. The width over which water is collected into a channel of length approximately obeys . As discussed above, variations of and in space are slow, and hence the width is roughly proportional to channel length . The constant of proportionality depends on channel depth (via ) and on the slope (via ), unless extends to a distance over which changes. Figure 13, in comparison with Figure 12b, shows this effect in full numerical simulations. The width of area drawn into the channel becomes smaller and smaller for shorter and shorter channels.
Groundwater piracy should relate to channel spacing. Since the lateral claim of channels grows proportionally with their length, it is small initially. Small channels have only a small influence on the flow field. Long channels on the other hand will compete with nearby channels. With the growth of the channel, its region of influence on the groundwater movement grows.
4.4 Discussion
4.4.1 Length-scale for the width of the subsurface drainage area
In this section we further discuss the width over which channels draw groundwater.
Figure 14 illustrates, in a two-dimensional auxiliary problem, that the influence of a channel of size is not , as it would be without a free surface, but , where is the distance to the boundary. Without free surface, if only the atmospheric pressure boundary condition were applied, the influence of the channel would only reach . (Since the flow is driven by height differences, the length-scale of the water table deformation translates into the length-scale over which the velocity component, , changes.) The velocities themselves strongly depend on , but the scale over which they change does not. As a consequence, the lateral influence of the channel can be much larger than its width or depth. The deformations of the water table, although small, enhance the lateral influence of the channel and lead to quick growth of the channel.
This length-scale can be argued for as follows. Due to incompressibility , where is the height of the free surface. When the behavior is close to hydrostatic, . The actual depth over which horizontal motion takes place does not need to be known, but is assumed roughly constant with . Using equation (1), the velocity is
Therefore, . After integration, the unknown constants can be expressed in terms of , the uppermost point, and , the lowest point of the free surface. We obtain
cannot be determined within this approximation. After differentiation at ,
The inclination at the boundary is comparable to the average slope of the water table. Hence, the water table is significantly sloped over the entire length, not just near the channel.
a)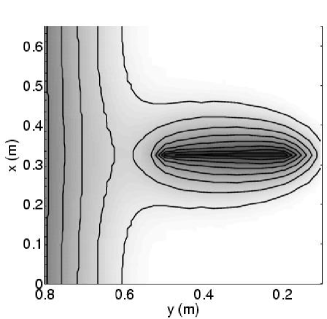 b)
b)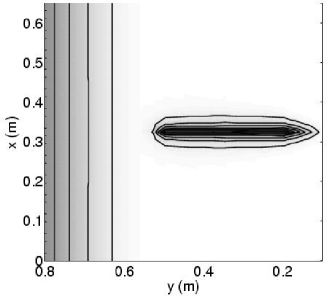
Full numerical simulations bear out this effect in three dimensions. Figure 15a shows the pressure in an inclined plane 1cm beneath the surface. (Due to the atmospheric pressure boundary condition, there are no pressure variations on the seepage surface itself.) The distance over which pressures decay corresponds to the distance over which the velocity decays in Figure 12b. For the purpose of illustration, Figure 15b shows the (unphysical) result if the lateral deformation of the water table were neglected. The lateral influence of the channel is comparable to the channel width, while in Figure 15a it is proportional to the channel length.
4.4.2 Coarsening
The theoretical description is incomplete without quantitative relations that describe the rate of erosion as a function of the amount of water seeping out the surface and pouring down the channels. Assuming that erosion is a monotonically increasing function of the amount of water drawn into the channels, it is possible to predict the dynamical behavior qualitatively.
Groundwater piracy should relate to channel spacing. The “wavelength” . Here is a proportionality constant , since piracy only gradually slows the growth and does not instantly set the spacing. According to the previous discussion, is proportional to ,
| (4) |
where is a geometric constant, independent of permeability or erosion threshold. On the other hand, may depend on slope and channel depth. The resulting proposition is
| (5) |
Relation (5) implies that seepage erosion has no constant preferred wavelength, since the channel length is time-dependent, . This is consistent with the observation of coarsening in the experiment. Formula (5) is not applicable to the early stage of evolution, which is strongly influenced by the initial incision processes.
Characteristic channel spacing can simply arise from the presence of a dominant length scale in the longitudinal (flow) direction. That is, if the length of the channel is roughly predetermined, then the drainage outlets would be spaced at a distance roughly proportional to the length of the channels. The Wentworth instability predicts that channels keep on growing and competing, until the externally given maximum length is reached. In a natural setting the maximum length may be determined by the length over which erosion occurs.
The scale-separation in the experiment may not be large enough to distinguish whether spacing is proportional to channel width or channel length. However, in both theory and experiment competition for ground water controls channel development. The coarsening mechanism is qualitatively the same.
In summary, coarsening of the lateral inter-channel spacing is predicted by theoretical considerations. Channels compete for groundwater, which slows and eventually stops the growth of some of them. The length-scale characterizing the distance between major channels increases with time, until the channels have reached their maximum length. Eventually the lateral spacing should be only confined by the externally constrained maximum length.
5 Conclusions
The lessons we have learned are about the role of runoff and seepage during channel formation, the generic nature of rhythmic channelization, and the importance of the water table’s free surface.
We observe the formation of drainage outlet channels in permeable ground, on the beach as well as in laboratory experiments. In both cases, initial channels are quickly incised by surface flow. Even in a very permeable medium, small amounts of surface runoff are more efficient in starting channels than is the emerging groundwater. Following the incision, groundwater from the vicinity seeps into the channel and flows inside the channel, enlarging it, mainly lengthwise, through erosion.
An initial lateral separation may be related to the initial sheet flow. Coarsening of the lateral inter-channel spacing is discernible in the experiment. For narrowly spaced channels, one channel often slows and eventually stops its growth, presumably due to piracy of groundwater by a nearby channel. A second process taking place is the belated formation of new channels far away from existing ones. Rhythmic channel patterns arise as water seeps through a mono-disperse permeable material and erodes material as it emerges and pours down the channel.
These observations lead us to a theoretical description in terms of flow of ground water in a homogeneous porous medium with a free water table. According to this theory, the response width of the water table is much wider than the channel is wide or deep and approximately proportional to the channel length. This underscores Wentworth’s insight that this an efficient (and therefore the dominant) instability mechanism, because it is prompt and far-reaching. The groundwater flow pattern, for a given channel geometry, is independent of material properties.
We are indebted to many who have facilitated this research through discussion, logistics, or help with field work, experiment, and numerical simulation. They include Oded Aharonson, Daniel Blair, Evan Gould, Jack Holloway, Greg Huber, Andras and Monika Kalmar, Peter Kelemen, Alexander Lobkovsky, Gary Parker, Taylor Perron, Antonello Provenzale, and Kelin Whipple. Peter Kelemen pointed us to the sites with regularly spaced beach rills. This work was supported by Division of Chemical Sciences, Geosciences and Biosciences, Office of Basic Energy Sciences, Office of Science, U.S. Department of Energy grants DE-FG02-99ER15004 and DE-FG02-02ER15367.
References
- Aharonson et al. (2002) Aharonson, O., Zuber, M. T., Rothman, D. H., Schorghofer, N. & Whipple, K. X. 2002 Drainage basins and channel incision on Mars. Proc. Nat. Acad. Sci. USA 99, 1780.
- Baker (1982) Baker, V. R. 1982 The Channels of Mars. Austin: University of Texas Press.
- Baker (1990) Baker, V. R. 1990 Spring sapping and valley network development. In Groundwater Geomorphology: The role of subsurface water in earth-surface processes and landforms (ed. C. Higgins & D. Coates), Special Papers 252, chap. 11. Boulder, Colorado: GSA, with case studies by R.C. Kochel, V.R. Baker, J.E. Laity, A.D. Howard.
- Daerr et al. (2003) Daerr, A., Lee, P., Lanuza, J. & Clement, E. 2003 Erosion patterns in a sediment layer. Phys. Rev. E 67, 065201.
- Dunne (1980) Dunne, T. 1980 Formation and controls of channel networks. Progr. Phys. Geogr. 4, 211.
- Dunne (1990) Dunne, T. 1990 Hydrology, mechanics, and geomorphic implications of erosion by subsurface flow. In Groundwater Geomorphology: The role of subsurface water in earth-surface processes and landforms (ed. C. Higgins & D. Coates), Special Papers 252, chap. 1. Boulder, Colorado: GSA.
- Higgins (1982) Higgins, C. G. 1982 Drainage systems developed by sapping on earth and mars. Geology 10 (3), 147–152.
- Horton (1945) Horton, R. E. 1945 Erosional development of streams and their drainage basins; hydrophysical approach to quatitative morphology. Geol. Soc. Am. Bull. 56, 275–370.
- Hovius (1996) Hovius, N. 1996 Regular spacing of drainage outlets from linear mountain belts. Basin Research 8, 29.
- Howard (1995) Howard, A. 1995 Simulation modeling and statistical classification of escarpment planforms. Geomorphology 12 (3), 187–214.
- Howard & McLane (1988) Howard, A. & McLane, C. 1988 Erosion of cohesionless sediment by groundwater seepage. Water Resour. Res. 25 (10), 1659.
- Howard (1988) Howard, A. D. 1988 Groundwater sapping experiments and modeling. In Howard et al. (1988), chap. 5, p. 71.
- Howard (1994) Howard, A. D. 1994 A detachment-limited model of drainage basin evolution. Wat. Resour. Res. 30, 2261.
- Howard et al. (1988) Howard, A. D., Kochel, R. C. & Holt, H. E., ed. 1988 Sapping Features of the Colorado Plateau. NASA SP 491. Washington DC: NASA.
- Huppert (1982) Huppert, H. E. 1982 Flow and instability of a viscous current down a slope. Nature 300, 427–429.
- Inman et al. (1979) Inman, D. L., Nordstrom, C. E. & Flick, R. E. 1979 Currents in submarine canyons: an air-sea-land interaction. Ann. Rev. Fluid Mech. 8, 275.
- Izumi & Parker (1995) Izumi, N. & Parker, G. 1995 Inception of channelization and drainage basin formation: upstream-driven theory. J. Fluid Mech. 283, 341–363.
- Izumi & Parker (2000) Izumi, N. & Parker, G. 2000 Linear stability analysis of channel inception: downstream-driven theory. J. Fluid Mech. 419, 239.
- Jaggar (1908) Jaggar, T. A. 1908 Experiments illustrating erosion and sedimentation. Bull. Mus. Compar. Zool., Harvard 49, 285–305.
- Kirkby & Chorley (1967) Kirkby, M. J. & Chorley, R. J. 1967 Throughflow, overland flow and erosion. Bull. Int. Assoc. Sci. Hydrol. p. 5.
- Kochel et al. (1985) Kochel, R. C., Howard, A. D. & McLane, C. 1985 Channel networks developed by groundwater sapping in fine-grained sediments: analogs to some martian valleys. In Models in Geomorphology (ed. M. J. Woldenberg), chap. 14, p. 313. Boston: Allen & Unwin.
- Kochel & Piper (1986) Kochel, R. C. & Piper, J. F. 1986 Morphology of large valleys on Hawaii: Evidence for groundwater sapping and comparisons with martian valleys. J. Geophys. Res. 91 (B13), E175, proceedings of the 17th Lunar and Planetary Science Conference.
- Kochel et al. (1988) Kochel, R. C., Simmons, D. W. & Piper, J. F. 1988 Groundwater sapping experiments in weakly consolidated layered sediments: a qualitative summary. In Howard et al. (1988), chap. 6, p. 84.
- Komar (1976) Komar, P. D. 1976 Beach processes and sedimentation. Englewood Cliffs, N.J.: Prentice-Hall, Inc.
- Laity & Malin (1985) Laity, J. E. & Malin, M. C. 1985 Sapping processes and the development of theater-headed valley networks on the Colorado Plateau. Geol. Soc. Amer. Bulletin 96, 203.
- Malin & Edgett (2000) Malin, M. C. & Edgett, K. S. 2000 Evidence for recent groundwater seepage and surface runoff on Mars. Science 288, 2330.
- Orange et al. (1994) Orange, D. L., Anderson, R. S. & Breen, N. A. 1994 Regular canyon spacing in the submarine environment: the link between hydrology and geomorphology. GSA Today 4, 1–39.
- Polubarinova-Kochina (1962) Polubarinova-Kochina, P. I. A. 1962 Theory of Ground Water Movement. Princeton, New Jersey: Princeton University Press.
- Schumm et al. (1995) Schumm, S. A., Boyd, K. F., Wolff, C. G. & Spitz, W. J. 1995 A ground-water sapping landscape in the Florida panhandle. Geomorphology 12, 281.
- Schumm et al. (1987) Schumm, S. A., Mosley, M. P. & Weaver, W. E. 1987 Experimental Fluvial Geomorphology. New York: Wiley.
- Smith & Bretherton (1972) Smith, T. R. & Bretherton, F. P. 1972 Stability and the conservation of mass in drainage basin evolution. Water Resour. Res. 3, 1506–28.
- Talling et al. (1997) Talling, P. J., Stewart, M. D., Stark, C. P., Gupta, S. & Vincent, S. J. 1997 Regular spacing of drainage outlets from linear fault blocks. Basin Research 9, 275.
- Wentworth (1928) Wentworth, C. K. 1928 Principles of stream erosion in Hawaii. J. Geol. 36, 385.