Stretching and relaxation dynamics in double stranded DNA
Abstract
We study numerically the mechanical stability and elasticity properties of duplex DNA molecules within the frame of a network model incorporating microscopic degrees of freedom related with the arrangement of the base pairs. We pay special attention to the opening-closing dynamics of double-stranded DNA molecules which are forced into non-equilibrium conformations. Mechanical stress imposed at one terminal end of the DNA molecule brings it into a partially opened configuration. We examine the subsequent relaxation dynamics connected with energy exchange processes between the various degrees of freedom and structural rearrangements leading to complete recombination to the double-stranded conformation. The similarities and differences between the relaxation dynamics for a planar ladder-like DNA molecule and a twisted one are discussed in detail. In this way we show that the attainment of a quasi-equilibrium regime proceeds faster in the case of the twisted DNA form than for its thus less flexible ladder counterpart. Furthermore we find that the velocity of the complete recombination of the DNA molecule is lower than the velocity imposed by the forcing unit which is in compliance with the experimental observations for the opening-closing cycle of DNA molecules.
PACS numbers: 87.-15.v, 63.20.Kr, 63.20.Ry
1 Introduction
Nowadays powerful micromanipulation techniques allow for the selective excitation of DNA in single molecule experiments under controlled conditions (see, e.g., [1],[2],[3]). Particularly mechanical properties of DNA molecules under tension and the inducement of structural transitions with external stress have received a lot of attention [4]-[9]. In this context several force measurements were performed on single DNA molecules to examine their elastic response to applied stretching [6] and twisting forces, respectively [4],[7],[9]. It has been demonstrated that with the application of stronger forces to the molecule in stretching experiments, even highly cooperative conformational transitions were discovered, for which, e.g., B-DNA is converted into a new overstretched conformation called S-DNA [6]. Furthermore, with sufficiently high tension the mechanical unzipping of single DNA molecules is achievable [8]. The opening process of DNA has been the subject of a number of studies due to its immense relevance for the transcription process. Simple models taking into account the elasticity properties of DNA, such as the wormlike and rodlike chain model, respectively have been invoked to describe these unzipping experiments [10]. The statistical mechanics of the torque induced denaturation of DNA has been studied in [11]. Recently, a semi-microscopic model of the binding between the two strands has been used to explain the effects of applied tension to DNA unzipping [12]. In order to determine the geometry and deformability of DNA at a local level, i.e. in terms of base pairs, energy functions based on discrete network models have been derived in [14]-[17]. In an early network model for the base pair opening in DNA involving microscopic degrees of freedom, Peyrard and Bishop (PB) proposed a planar ladder-like oscillator model of DNA assigning each base pair a vertical inter-strand vibrational degree of freedom which simulates the stretchings and compressings of the corresponding H-bridges [18]. The binding forces of the hydrogen bridges are described by a Morse potential. The bases itself are treated as point masses. Horizontally, the bases on the same strand are coupled via the stacking interaction described by harmonic potentials. The PB model has been extensively studied and localized oscillating solutions (breathers) have been found reflecting successfully some typical features of the DNA opening dynamics such as the magnitude of the amplitudes and the time scale of the breathing of the ’bubble’ occurring prior to thermal denaturation [18]. On the other hand, as the coiled form of double-stranded DNA is concerned, it has been found that the bubble formation is strongly correlated with twist deformations and local openings are always connected with a local untwist of the double helix [19],[20]. In order to account for the helicoidal structure of DNA the PB model has been significantly extended by Barbi, Cocco and Peyrard (BCP) [19]. In their model of the twisted form of DNA (the Watson-Crick double helix), two degrees of freedom per base pair are introduced. There is a radial variable measuring the distance between two H-bridged bases along a line that connects them in the base plane being perpendicular to the helix axis. Further, the twist angle between this connecting line and a reference direction determines the orientation of the H-bridge. In this model a further degree of freedom has been included, namely the axial distance variation [12]. Interactions between the bases are described then by appropriate potential terms in the energy of the system. The process of DNA unzipping by applied force has been studied in great detail [11],[12],[13]. The merit of these works is that many of the theoretical conclusions, gained on the basis of rather simple network models, are in agreement with the experimental results.
In the current study of the nonlinear dynamics related with the opening process and elasticity features of DNA molecules our aim is to examine the energy exchange processes and the relaxation dynamics in DNA molecules after they have been brought into a non-equilibrium conformation by applied tension. Such an investigation is associated with recent mechanical experiments performed with single DNA molecules [3]-[9] forced away from their equilibrium conformations. Following force applications energy redistribution within the DNA molecule takes place such that a (new) equilibrium conformation is attained [2],[3],[21],[22]. We focus our interest on the elasticity properties and the relaxation dynamics of two different double-stranded DNA configurations, namely the planar untwisted (ladder-like) system and the twisted one arising when the two strands of the molecule are coiled around its molecular axis. In particular we address the questions in which way these two different DNA molecules react to imposed stress and how fast the equilibration process takes place for them. Furthermore, we compare the original equilibrium structures with those newly attained after release from the exerted mechanical stress. Regarding the biological functioning of DNA their elasticity properties are of importance for instance for the creation of a denatured bubble appearing prior to strand separation making the DNA accessible to the transcription and replication processes. Compared to previous theoretical studies of the unzipping dynamics of DNA induced by strong forces yielding complete strand separation [11],[12] we remark that for the current study we rather concentrate on mechanically stressed double-stranded DNA which gets forced away from the equilibrium configuration, however, only with beginning strand separation. From a biophysical point of view this also resembles the situation when the DNA molecule is inflicted to internal stress changes occurring in the living cell which alone is not strong enough to cause advanced bond breaking. Furthermore, the interaction between DNA and proteins such as enzymes can exert forces that initiate the local opening of the DNA molecule.
The paper is organized as follows: In the second section we describe our network model for the structure of double-stranded DNA. The third section deals with the relaxation dynamics within DNA molecules forced into locally distorted configurations. We study the similarities and differences between the relaxation dynamics for a planar ladder-like DNA molecule and a twisted one. Finally, we summarize our results.
2 Network model for the double-stranded DNA
Our DNA model takes the basic geometrical features of the double-stranded form of DNA, as a polymeric molecule composed of two strands of nucleotides, into account which are essential to model structural deformations generated by mechanical stress imposition and vibrational relaxation processes. Likewise the approach in [11],[19], we treat the double-stranded DNA as a network of coupled oscillators incorporating essential microscopic degrees of freedom of DNA and the inherent interactions between them. Such a network model approach is appealing because it can successfully describe the mechanical behavior on the microscopic scale relevant for biomolecular processes, but bears enough simplicity to be tractable with not too much computational efforts. The constituents of the oscillator network model represent the nucleotides which are regarded as single nondeformable entities. Thus, no inner dynamical degrees of freedom of the nucleotides are taken into account which is justified by the time scale separation between the small-amplitude and fast vibrational motions of the individual atoms and the slower and relatively large-amplitude motions of the atom groups constituting the nucleotides [23]. Concerning the structural components, each nucleotide is composed of a sugar, a phosphate and a base. The sugar-phosphate groups of neighboring nucleotides on the same strand are linked via covalent bonds establishing the rigid backbone to the strand. There is a base attached to every sugar. Since, for simplicity, we do not distinguish between the four different types of bases, the nucleotides are considered as identical objects of fixed mass. Two bases on opposite strands are linked via hydrogen bonds holding the two strands of DNA together.
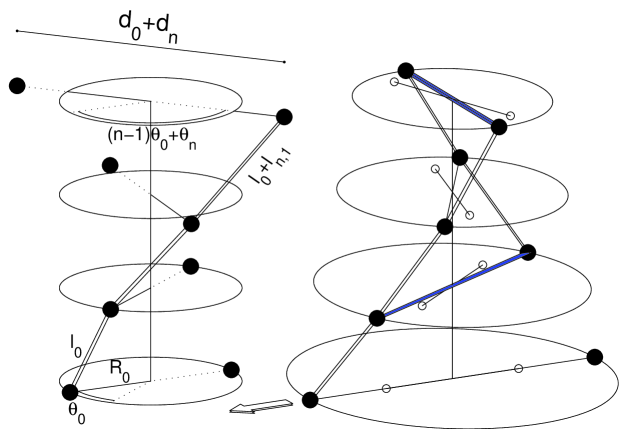
For computational convenience we cast the double helix structure in a Cartesian coordinate system whose axis coincides with the central helix axis as sketched in Fig. . The base pairs are situated in planes perpendicular to the central helix axis and the vertical distance between two consecutive planes is given by . For the equilibrium configuration each base has equilibrium coordinates , and . The index pair labels the -th base on the th strand with and , where is the number of base pairs considered. The equilibrium distance between two bases within a base pair, , is determined by
| (1) |
where and are the projections of the line connecting the two bases on the axes of the coordinate system. The deviations from through displacements, , and , of the bases from their equilibrium positions, , and , are expressed as
| (2) |
The relative twist between two consecutive base pairs, being rotated around the central axis, is given by an angle . For later use we introduce the quantity
| (3) |
as the angle between the axis (as the reference direction) and the line connecting two (displaced) bases of a base pair measuring the alignment of the associated H-bridge. is an integer to assure monotonicity of with respect to .
The three-dimensional equilibrium distance between two adjacent bases on the same strand is given by
| (4) |
and deviations from are determined by
| (5) | |||||
with and .
Our model Hamiltonian is then given by
| (6) |
and represent the potential energy part for the H-bonds and the covalent bonds, respectively. The deformations of the hydrogen bonds corresponding to deviations from the equilibrium bond length are described by vibrations in a Morse potential which is given by
| (7) |
D is the depth of the Morse potential and is the range parameter. For the sake of simplicity we do not distinguish between the two different pairings in DNA, namely the G-C and the A-T pairs. The former pair involves three hydrogen bonds while the latter involves only two. Thus our model applies to pure poly(dG-dC) and poly(dA-dT) DNA sequences.
The covalent bonds between the sugar-phosphate groups of neighboring nucleotides on a strand are rather strong and rigid (with bond energies of the order of ) in comparison with the weak and flexible hydrogen bonds (with bond energies of the order of ). Therefore, it seems justified to treat the potential of the covalent bonds, simulated by elastic rods, in the harmonic approximation given by
| (8) |
where is the elasticity coefficient.
The potential term takes stacking effects into account which impede that one base slides over another [23]. For the form of we adopt the one used in [11]
| (9) |
The decrease of the molecular packing with substantially increased base pair opening is accounted for by the exponential factor with attenuation parameter . As the changes of the axial distance between adjacent base planes is concerned we assume that the supposedly small longitudinal helix deformations can be modeled by a harmonic elasticity potential term given by
| (10) |
The kinetic energy is determined by
| (11) |
where is the mass of a base and denote the component of its momentum.
In order to assign values to the various parameters we note that the geometrical parameters of the equilibrium configuration are well known [23]. The rotation angle for the twisted configuration is , the distance between base pair planes is Å , and the inter-base distance is Å. (For the twisted configuration corresponds to the diameter of the helix.) The ladder-like system is completely untwisted, viz. . For the average mass of one nucleotide we use . Like Barbi et al [19] we set Å-1, , and Å-2. Concerning the parameters and there is little experimental evidence from which an estimate of them could be inferred. In [20] the value of the parameter has been set to which we adopt here. (Alternatively, in a model approach of DNA denaturation dynamics [11] the parameters and were specified to fit the melting temperature of certain DNA polymers.) The parameter is treated as adjustable. Furthermore we use for the value of the attenuation parameter Å-1 [11].
With a suitable time scaling and dividing the original Hamiltonian by one passes to a dimensionless formulation with quantities:
| (12) | |||||
| (13) | |||||
| (14) | |||||
| (15) |
In the following, we omit the tildes.
The equations of motion are derived from the Hamiltonian presented in Eqs. (6)-(11) and read as
| (16) | |||||
| (17) | |||||
| (18) | |||||
| (19) | |||||
| (20) | |||||
| (21) | |||||
with the derivatives
| (22) | |||||
| (23) |
and the equivalent expressions for , , and .
The values of the scaled parameters are given by , , and . One time unit of the scaled time corresponds to of the physical time.
3 Relaxation dynamics of mechanically stressed DNA
3.1 Pulling process in the ladder and twisted configuration
We study the energy exchange process taking place after the double-stranded DNA has been forced mechanically into a non-equilibrium configuration. In more detail, we consider the situation when at one end (referred to as the pulled end) of short DNA molecules consisting of up to base pairs the two strands get pulled laterally in opposite directions by an external force (exerted e.g. when the two strands of one end of the molecule are attached to two different solid supports that are progressively separated [8]) so that they are dragged apart leading to gradual opening of the double-stranded chain. The pulled end is formed by the base pairs with index and the rest of the molecule with is located above it in the direction. Therefore a positive value of will represent a local -stretching of the strand . In order to mimic the pulling process we assume that the pulling force is directed solely along the direction and the coordinates of the terminal bases are shifted uniformly with a pulling velocity of while the corresponding and coordinates are kept fixed at .
Moreover, due to the constraint imposed by the backbone rigidity there result deformations not only at the pulled end but also for the rest of the helix. In general, the extent of lateral deformations subsides along the strands from the pulled towards the free end. The motion of the pulling unit is assumed to terminate when the lateral elongation at the pulled end has reached a certain value, taken as , so that the corresponding terminal hydrogen bond is broken. Moreover, the next-neighboring hydrogen bond is broken too and the third one is already considerably stretched. The typical resulting deformation pattern of the double stranded DNA is depicted in Figs. and for the ladder and twisted configuration, respectively. (In the Figures energy is expressed in terms of , the unit for length is and the time is given in .)
Comparing the resulting DNA deformations we note that for both, the ladder and the twisted configuration, virtually equal lateral elongations are obtained. However, unlike the ladder configuration the twisted one experiences additional changes of the twist angles. There arises an overall decrease in the twist angle and the further a base pair is apart from the pulled end the more is the corresponding twist angle reduced (cf. Fig. ) leading to an untwist of the helix. Nevertheless, with growing distance from the pulled end the difference between two consecutive angle changes becomes smaller. Thus the relative twist angle between two adjacent base planes diminishes towards the free end.
 |
 |
 |
 |

While for the twisted system the axial deformations are negligible (see Fig. ) we note that for the ladder configuration there results noticeable diminution of the axial equilibrium distances between neighboring base planes which is strongest at the free end and weakens gradually towards the pulled end (see Fig. ). The relations between the partial deformation energies for the twisted system are shown in Fig. . The major contributions stem from the Morse potential energy associated with the H-bridge deformations and the stacking interaction energy both exceeding the energetic content of the covalent bond and axial distance change energy, respectively by four orders of magnitude. Typical for DNA molecules is that there exist different elasticity regimes, that is the degree of the deformation depends not overall linearly on the force (see e.g. [3]) which is reflected here in the nonlinear character of the temporal behavior of the deformation energies.

3.2 Relaxation processes
After the DNA molecule has been brought into a non-equilibrium configuration with imposed mechanical tension we explore now the vibrational dynamics of the helix cage after the pulled end has been released from the forcing lever. Hence, there is no external mechanical constraint enforced on the double helix any longer. For the then isolated double helix we expect that energy redistribution processes between the various vibrational degrees of freedom take place targeting for the attainment of a new stationary configuration.
We discuss the ladder system and the twisted one separately and start with the former case for stacking interaction strength .
We integrated the set of coupled equations (16)-(19) (with free boundary conditions) with a fourth-order Runge-Kutta method while the accuracy of the computation was checked through the conservation of the total energy.
To gain insight into the energy redistribution process we monitor the temporal behavior of the potential energies associated with the deformations of the hydrogen and the covalent bonds, respectively, and changes of the axial elasticity and stacking interaction energy, respectively. Fig. . illustrates how the total deformation energy of , which has been deposited in the DNA molecule, is shared between the various degrees of freedom in the course of time. Generally, we observe that in an initial interval of , hereafter referred to as the redistribution time, pronounced migration of energy takes place. Regarding the Morse potential energy we note that during this initial interval the amplitude oscillates wildly in a range reaching from up to . Afterwards the potential energy performs lower-amplitude oscillations around the mean value indicating that a quasi-equilibrium regime is attained. Apparently, the amount of energy by which the Morse potential energy gets reduced (almost of its initial value) has been redistributed into other forms of the deformation energy. Likewise the Morse potential energy, the stacking interaction energy experiences also losses which manifests that the stretched H-bonds relax and come close to their equilibrium lengths. Subsequent to a drop, the stacking interaction energy performs oscillations of fairly large amplitudes throughout the time around the mean value of . Hence, the reduced deformation energy of the H-bonds flows into the covalent bond energy and the axial distance change energy exhibit analogous temporal behavior, i.e. both rise on the average during the redistribution time and approach their quasi-equilibrium values. Eventually, the energies and oscillate around their respective mean value. In other words, the H-bond deformation energy is reduced and its loss is deposited into such forms of the energy which contribute mainly to enhanced deformations of the covalent bonds. However, the energy associated with the axial distance changes remains still very small compared to all other deformation energies. We remark that the mean value of the covalent bond energy has grown up to and the peaks of the oscillations are even in the range of the Morse potential and the stacking interaction energy giving evidence for major distortions of the covalent bonds.
 |
 |
 |
 |
The energy redistribution processes in the twisted case are illustrated in Fig. . Compared to the behavior in the preceding ladder case this time the Morse potential energy descends already within down to its mean value pointing to a faster equilibration process. Nevertheless, there appear occasional bursts of the amplitude. The stacking interaction energy has rapidly dropped down from the initial value to after only . Subsequently, the stacking interaction energy exhibits oscillations around a mean value of . However, as the covalent bond energy is concerned we find that it increases substantially and the eventually attained mean value exceeds even that of the Morse potential energy. This behavior has to be distinguished from the redistribution process in the ladder case where, in the quasi-equilibrium regime, the deformation energy is primarily stored as Morse potential and stacking interaction energy implying that H-bridge deformations play a larger role than any other DNA deformations. Moreover, for the twisted case we observe also a much more drastic increase in the axial distance change energy and the covalent bond energy relative to the ladder case which is associated with intensified deformations of the helix backbone. Hence, the process of energy redistribution connected with the approach of a (quasi) equilibrium state proceeds differently in the ladder case and the twisted one causing also in the outcome distinct structural modifications.
 |
 |
 |
 |
3.3 Structural changes
The dynamics of the structural changes in the course of the relaxation process is displayed in Fig. and Fig. for the ladder and twisted system, respectively. More precisely, we depict the time evolution of the mean value of the lateral (radial) deformations
| (24) |
the angular deformations
| (25) |
and the mean (axial) distance between two adjacent bases on a strand is given by
| (26) |
respectively. () determines also the average length change of the hydrogen (covalent) bonds. We have directly superposed the graphs from the pulling (with an inversed time) and relaxation process. With perspective to the mean lateral deformation we observe that the relaxation process makes fast progress relative to the pulling operation so that the mean lateral deformation subsides rapidly. Conversely, the mean axial deformation shows immediately sizeable growth in amplitude compared to the corresponding small changes during the pulling process. Finally, for the twisted system the mean angular deformations do not return to its starting zero value but remain close to the level obtained at the end of the pulling procedure such that the helix possesses reduced twist relative to the equilibrium configuration.
 |
 |
Comparing the mean lateral deformations of ladder and the twisted system (starting in both cases from the value ) we conclude that for the twisted system arrives by far much faster at the equilibrium mean value than it is the case for the ladder system attaining the mean value . There remain permanent lateral extensions of the ladder and the twisted system deviating from the original equilibrium shape. On the other hand, the time evolution of the corresponding variance, , reveals that the average deviation from the mean value is markedly weaker in the twisted case () compared to the considerably strong deviations in the ladder case (). This shows that the attractive stacking interaction between successive base pairs gets stronger in the twisted system favoring the corresponding inter-base distances to retain faster a similar value. In fact, those base pairs which have been forcefully separated by the stretching recombine within less than reversing the strand separation. Interestingly, the recombination of the DNA duplex (associated mainly with the relaxation of the lateral components) takes shorter times than the forced separation. However, the relaxation is not complete because the relaxed configuration with its fluctuating positions of the bases still differs from the original equilibrium configuration with resting base positions. Furthermore, distinct from the non-fluctuating behavior during the pulling process the relaxation curves exhibit fairly strong fluctuations. Evidently, the relaxation (closing) does not take place as the reversed process of the pulling (opening).
Analogous to the temporal behavior of the lateral extensions the mean distance between two successive bases on a strand exhibits irregular oscillations such that for the twisted system the large-amplitude fluctuations are up to two times stronger than the ones for the ladder system. In contrast to the permanently deformed lateral components (with non-zero mean value ) the average axial distance changes fluctuate around the original equilibrium values . Finally, for the twisted case the mean twist angle performs small-amplitude oscillations leaving the helix in slightly distorted angular shape.
 |
 |

3.4 Comparison between the pulling and relaxation processes
In summary, the ladder system and the twisted one have in common that when both start from an initial partially opened duplex corresponding to a lateral elongation pattern they reach due to the relaxation process a quasi-equilibrium regime not far from the initial equilibrium configuration. However, unlike for the original equilibrium configuration in the newly adopted quasi-equilibrium regime the structural coordinates are not at rest but perform oscillatory motions with a mean period duration of . Correspondingly, this quasi-equilibrium regime is characterized by energy exchanges between the various degrees of freedom related with the alterations of the H-bridges, the covalent bonds, the longitudinal elasticity potentials and the stacking interactions. Moreover, the adaptation process towards the quasi-equilibrium takes much longer time in the ladder case than in the twisted one. Hence the ladder system is more rigid with respect to spatial deformations than its twisted counterpart which with its additional angular degrees of freedom seems to possess more flexibility but less adaptability. In particular we observe that, with regard to the lateral deformations the twisted double-stranded system almost reverts to the original non-distorted equilibrium shape on the expense of substantial fluctuations in axial direction. In contrast, the ladder system is eventually left in comparatively strong lateral deformation but without significant axial distance fluctuations pointing to strong backbone rigidity. These results demonstrate that the relaxation process does not take place as the complete reversal of the pulling process. Similar behavior has been observed for the force-induced melting of the DNA double helix and its subsequent reannealing [3].
3.5 Guided relaxation
We have also studied the elastic response of the stretched DNA double chains for the twisted system when at the end of the pulling process the molecule is not immediately exempted from the forcing unit. The starting point is an unopened molecule whose terminal end is pulled laterally with a velocity . When a certain lateral extension of the terminal base pair is achieved the direction of the pulling motion is reversed (without waiting time) which returns the forcing unit to the position it had before opening allowing for guided relaxation. We monitored the mean lateral extension for different values of the velocity of the backward motion, namely , and . The results regarding the structural changes are shown in Fig. for backward velocity . As expected, at the end of the backward guidance of the terminal base pair the whole of the double helix restores virtually the original (undistorted) shape. Analogously, the associated deformation energies decrease steadily in the course of the relaxation process and adopt their initial zero content which they had before the pulling operation. However, we observe an asymmetry between the forward and backward elongation curves. Particularly, in an early stage of the retraction of the pulling unit the corresponding relaxation curves are in advance of their counterparts for the pulling process which seems to present a typical behavior of DNA molecules (see e.g. [2],[3],[13])
With lowered backward velocity the process till complete relaxation is achieved takes correspondingly longer times.
 |
 |

3.6 Parameter dependence
For a parameter study we have varied the stacking interaction strength and simulated the pulling process to follow afterwards the relaxation dynamics. As the main result we found that the larger is the more rapid proceeds the relaxation process, viz. the faster is the quasi-equilibrium regime attained. Furthermore, it holds in general that the energy migration takes more time in the case of the ladder system than for its twisted counterpart.
With view to a dependence on the molecule length , i.e. the number of base pairs, we remark that the time scale for the relaxation process remains basically the same when is varied in the range from to providing strong evidence for the enormous elasticity of DNA molecules on the lower amplitude scale. In contrast, for large-amplitude elongations the dissociation time of DNA molecules increases from a fraction of a second to hours over the range of to base pairs [12].
In addition, with regard to asymmetry we investigated also cases when the ends of the strands are pulled laterally with unequal forces (in the extreme case only one strand is pulled) resulting in elongation patterns being asymmetric with respect to the central helix axis. We observed then that the systems behave during the subsequent relaxation dynamics like in the symmetric cases discussed above and attain finally quasi-equilibrium regimes being not far away from the respective original equilibrium configurations with fluctuating structural coordinates.
4 Summary
In this paper we have demonstrated that within the frame of an oscillator network model we are able to study numerically the mechanical stability and elasticity properties of DNA molecules. Our model of coupled oscillators takes essential microscopic degrees of freedom of DNA and the inherent interactions between them into account. We have focused our interest on the opening-closing dynamics of double-stranded DNA molecules. The opening of a DNA molecule has been forced by mechanical stress imposed at a terminal end of the molecule bringing it into a non-equilibrium state. We have followed the subsequent relaxation towards an equilibrium state with recombination to its double-stranded conformation. The similarities and differences between the relaxation dynamics for a planar ladder-like DNA molecule and a twisted one have been discussed. In particular we have shown that the attainment of a quasi-equilibrium regime proceeds faster in the case of the twisted DNA form than for its ladder counterpart. This has led us to the conclusion that in the twisted form the DNA molecule is more flexible with respect to conformational changes than in the planar ladder-like version.
There are some limitations in our model approach and for an improvement one should certainly consider the dependence on the DNA sequence, the impact of the chemical environment and the influence of temperature on the mechanical stability.
Acknowledgments
One of the authors acknowledges support by the Deutsche Forschungsgemeinschaft via a Heisenberg fellowship (He 3049/1-1). The authors would like to express their gratitude to the support under the LOCNET EU network HPRN-CT-1999-00163.
References
- [1] B. Essevaz-Roulet, U. Bockelmann and F. Heslot, Proc. Natl. Acad. Sci. U.S.A. 94, 11935 (1197).
- [2] U. Bockelmann, Ph. Thomen, B. Essevaz-Roulet, V. Viasnoff and F. Heslot, Biophys. J. 82, 1537 (2002).
- [3] H. Clausen-Schaumann, M. Rief, C. Tolksdorf, H.E. Gaub, Biophys. J. 78, 1997 (2000).
- [4] J.F. Marko and E.D. Siggia, Science 265, 506 (1994).
- [5] J.F. Marko and E.D. Siggia, Macromolecules 27, 981 (1994).
- [6] S.B. Smith, L. Finzi and C. Bustamante, Science 258, 1122 (1992); Ph. Cluzel, A. Lebrun, C. Heller, R. Lavery, J.-L. Viovy, D. Chatenay and F. Caron, ibid 271, 792 (1996); S.B. Smith, Y. Cui and C. Bustamante, ibid 271, 795 (1996); M.D. Wang, H. Yin, R. Landick, J. Gelles and S.M. Block, Biophys. J. 72, 1335 (1997).
- [7] T.R. Strick, J.F. Allemand, D. Bensimon, A. Bensimon, and V. Croquette, Science 271, 1835 (1996).
- [8] U. Bockelmann, B. Essevaz-Roulet, and F. Heslot, Phys. Rev. Lett. 79, 4489 (1997); Phys. Rev. E 58, 2386 (1998).
- [9] P. Nelson, Biophys. J. 74, 2501 (1998).
- [10] C. Bustamante et al Science 265, 1599 (1994); R.H. Austin, J.P. Brody, E.C. Cox, T. Duke, and W. Volkmuth, Phys. Today 50, 32 (1997); C. Bouchiat et al Biophys. J. 76, 409 (1999); J.F. Marko and E.D. Siggia, Phys. Rev. E 52, 2912 (1995); J.D. Moroz and P. Nelson, Proc. Natl. Acad. Sci. U.S.A. 94, 14418 (1997); C. Bouchiat and M. Mzard, Phys. Rev. Lett. 80, 1556 (1998); Eur. Phys. J. E 2, 377 (2000).
- [11] S. Cocco and R. Monasson, Phys. Rev. Lett. 83, 5178 (1999).
- [12] S. Cocco, R. Monasson, and J.F. Marko, Phys. Rev. E 65, 041907 (2002).
- [13] S. Cocco, R. Monasson, and J.F. Marko, Phys. Rev. E 66, 051914 (2002).
- [14] A.A. Gorin, V.B. Zhurkin and W.K. Olson, J. Mol. Biol. 247, 34 (1995).
- [15] W.K. Olson, A.A. Gorin, X.-J. Lu, L.M. Hock and V.B. Zhurkin, Proc. Natl. Acad. Sci. U.S.A. 95, 11163 (1998).
- [16] W.K. Olson, N.L. Marky, R.L. Jernigan and V.B. Zhurkin, J. Mol. Biol. 232, 530 (1993).
- [17] B.D. Coleman, W.K. Olson and D. Swigon, J. Chem. Phys. 118, 7127 (2003).
- [18] M. Peyrard and A.R. Bishop, Phys. Rev. Lett. 62, 2755 (1989).
- [19] M. Barbi, S. Cocco and M. Peyrard, Phys. Lett. A 253, 358 (1999).
- [20] M. Barbi, Localized Solutions in a Model of DNA Helicoidal Structure, PhD Thesis, Universit degli Studi di Firenze (1998).
- [21] N.J. Crisona, T.R. Strick, D. Bensimon, V. Croquette and N.R. Cozzarelli, Genes Dev. 14, 2881 (2000).
- [22] J.F. Lger, G. Romano, A. Sarkar, J. Robert, L. Bourdieu, D. Chatenay and J.F. Marko, Phys. Rev. Lett. 83, 1066 (1999).
- [23] L. Stryer Biochemistry, Freeman, New York (1995).
- [24] Ph. Thomen, U. Bockelmann and F. Heslot, Phys. Rev. Lett. 88, 248102 (2002).