Persistent global power fluctuations near a dynamic transition in electroconvection
Abstract
This is a study of the global fluctuations in power dissipation and light transmission through a liquid crystal just above the onset of electroconvection. The source of the fluctuations is found to be the creation and annihilation of defects. They are spatially uncorrelated and yet temporally correlated. The temporal correlation is seen to persist for extremely long times. There seems to be an especially close relation between defect creation/annihilation in electroconvection and thermal plumes in Rayleigh-Bénard convection.
pacs:
PACS numbers: 61.30-v, 47.65.+a, 47.52.+j, 05.40.-aRecently, the nature of fluctuations of global quantities such as power dissipation in systems held far from equilibrium has become of intense interest evans93 ; galla95 . Of particular importance is how fluctuating excitations on different spatial and temporal scales give rise to variations in globally-measured quantities. Inspired by equilibrium systems, in which the relationship between local and global fluctuations is most easily studied near a phase transition, we examine this relationship near a bifurcation point in a fluid dynamical system driven far from thermal equilibrium. Here the classical fluctuation-dissipation theorem may not be invoked.
Near such a bifurcation only a small number of degrees of freedom are excited, making it possible to investigate both local and global quantities. It is well known that in weakly perturbed systems one can identify the correlation length of the system. Far from equilibrium, correlations in time are also highly relevant. An excellent system for studying temporal fluctuations in both global and local quantities is a liquid crystal in an electroconvective state. This system permits straightforward, simultaneous, and temporally resolved measurement of both localized spatial structures and global characteristics. The principal bifurcation in electroconvection (EC) occurs above a critical driving voltage i.e., at the onset where convecting rolls appear. A small increase in generates dislocations (defects) that translate across the plane of the liquid crystal (LC) and have a finite lifetime (see Fig. 1) leading to a state often called defect turbulencekai89 . These transient excitations cause readily measurable fluctuations in the global power . The highly localized defects, which are tracked visually, have a lifetime which is in striking agreement with the correlation time of global quantities such as .
In this Letter we show that the normalized variance of these fluctuations depends strongly on the system size, establishing that the local excitations (or quasi-particles) which give rise to the fluctuations in are spatially uncorrelated. On the other hand, the temporal correlations in the system are very strong and show remarkable correspondence with the properties of thermal plumes in turbulent Rayleigh-Bénard convection (RBC) ashken99a ; qiu01a ; qiu02 . The above observations are reconciled if one assumes that large-scale flow is responsible for the observed temporal coherence, while short-range interactions are responsible for their spatially incoherent distribution. Our observations, made in three liquid crystals, may apply to a large class of bifurcation phenomena, Rayleigh-Bénard convection being a notable example.
The experiments were performed on planarly oriented (nematic director parallel to the bounding glass plates) LC samples of methoxy benzylidene-butyl aniline (MBBA) Phase V (P5) merck and Mischung 5 (M5).jim02a All samples have been prepared with appropriate electrical conductivities and the measurements were made under temperature-controlled conditions. The active area of the samples was varied between and while their thickness ranged between and , providing aspect ratios from to . The details of the experimental setup for the electric power fluctuation measurements have been presented elsewhere jim01 ; jim02b ; gold01 . The set-ups permit the recording of both and the optical patterns, while at the same time monitoring the transmitted light intensity integrated over the entire area of the sample.
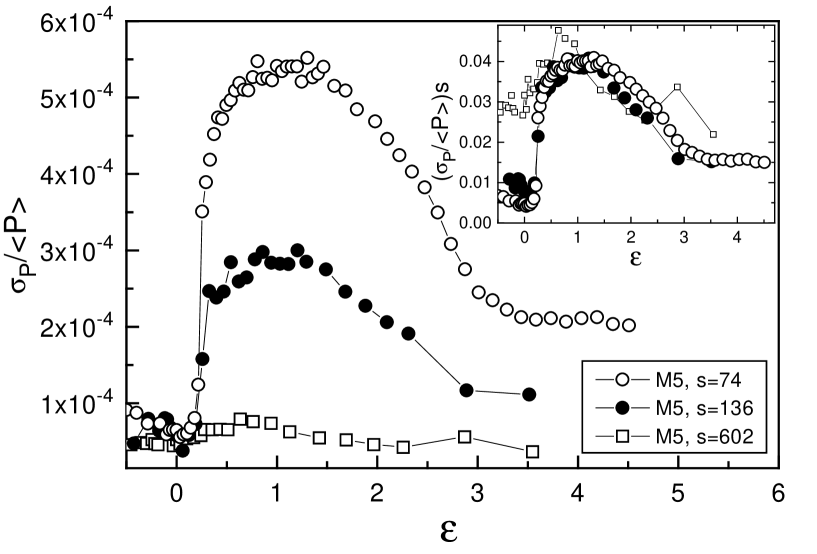
Fig. 2 shows the voltage dependence of the normalized variance in power fluctuations measured in different cells filled with M5 and with various and providing in the range from 74 to 602. For all samples there is a sharp increase of . The onset of this effect is not , but just above at At this point spontaneous creation and annihilation of defects begins and the stationary EC rolls break up into segments that move, seemingly at random with speed proportional to boden88 ; this state has been called defect turbulence kai89 . Measurements in MBBA, not presented here, show that at any given value of and , increases as , which is proportional to the number of defects. This strongly suggests that the fluctuations in dissipation arises from spatially incoherent sources.
Plotting the data in Fig. 2a in a different way suggests a relation between electroconvection and Rayleigh-Bénard convection. The inset in Fig. 2 is a plot of , scaled by , as a function of . Observe that the maximum in depends strongly on . When plotted in this way, all curves collapse for . This affirms that plays an important role here, as it does for velocity and temperature fluctuations in RBC (see e.g. qiu01a ). Similar measurements in MBBA and P5 are found to exhibit the same behavior, suggesting that this is a generic phenomenon in EC.
The non-monotonic variation of with is understandable. When is just above zero, the dislocations, which are responsible for the fluctuations in , are not yet excited. As increases above 0.2, the number of dislocations increases. In this range the small-scale dislocations, seen in Fig. 1, possess a high degree of temporal coherence because the process of creation and annihilation is stimulated collectively by a circulation having a size of the order of the lateral dimensions of the sample. In the interval 0.2 , the localized dislocations grow in number and their motion remains spatially correlated, thereby increasing . As for the denominator, , it increases only modestly gold01 . Hence, the ratio increases in this excitation range. As is further increased, the number of dislocations continues to grow, but now the large-scale spatio-temporal coherence is lost; the fluid motion has become strongly chaotic on all scales. As a consequence, the defects contribute randomly to the fluctuations in , causing to fall According to this scenario, the strong dimensionless fluctuations in (and very likely, other global quantities such as )will be confined to a narrow interval in near zero.
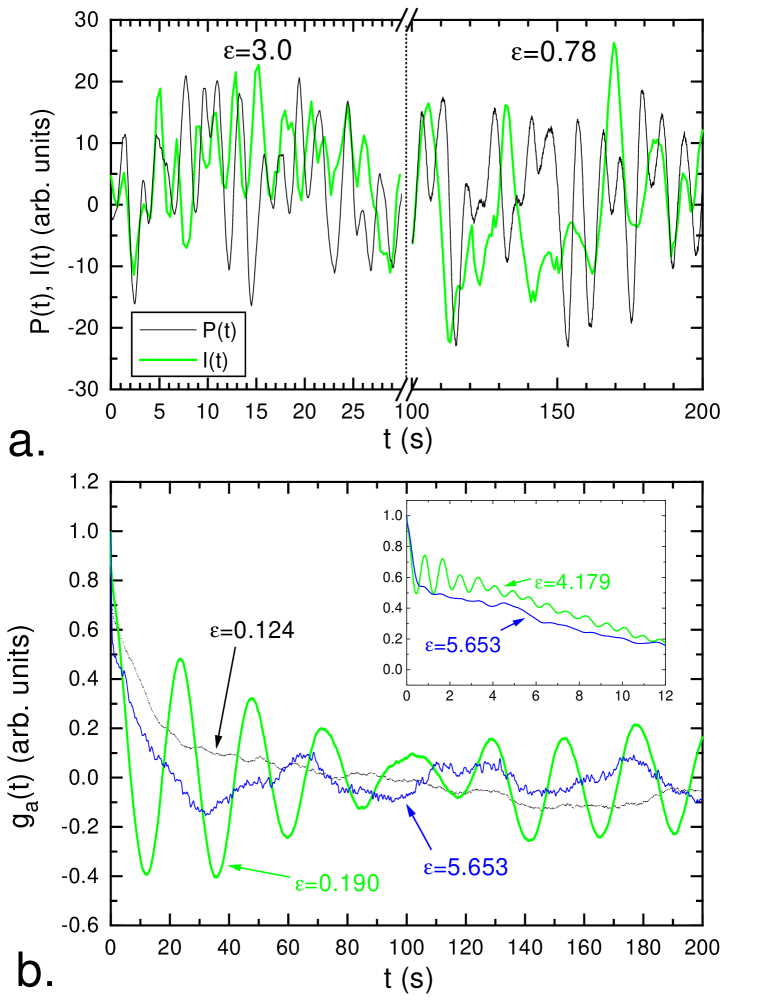
Fig. 3(a) shows time traces of both and the integrated transmitted intensity at and at . Both of these global measures are quasi-periodic with a dominant frequency that increases with . The relative phase between the signals is arbitrary. Note that low frequency oscillations in were seen in Ref. kai78 ; no other reported examples are known to us.
This characteristic frequency , is also seen in the normalized autocorrelation function displayed in Fig. 3(b). The measurements in Fig. 3(b) were made in an M5 sample (, ) for different values of . At , where EC rolls are well developed but there is no defect creation/annihilation, reaches within a minute without any oscillation. When the so called ’varicose’ nasuno92 pattern develops in M5 at , the motion of the rolls starts with infrequent generation/annihilation of defects, and slow oscillations at frequency . With further increase of , increases up to , where so-called hard turbulence takes place with rapid creation/annihilation of defects. Above the oscillations vanish as their amplitude disappears into the noise.
In the range of for which oscillations in are seen, they appear to be truly persistent. That is, even for measurement times of many hours, the oscillations persist for the length of the run. A run of this duration spans tens of thousands of oscillation periods. These measurements were at a value of where the sample contained hundreds of defects, if not thousands. It is surprising that such a large number of spatially uncorrelated defects gives rise to oscillations in over such long times.
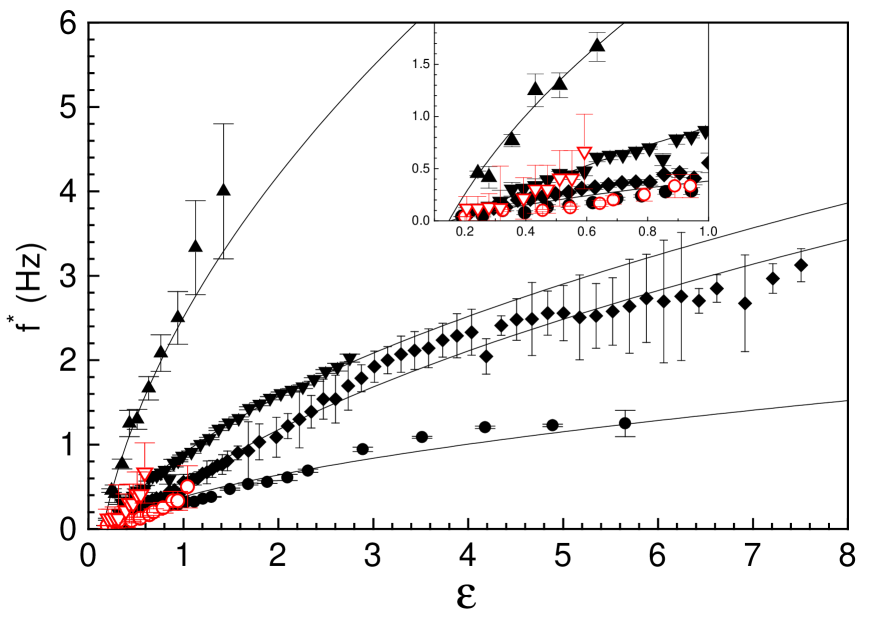
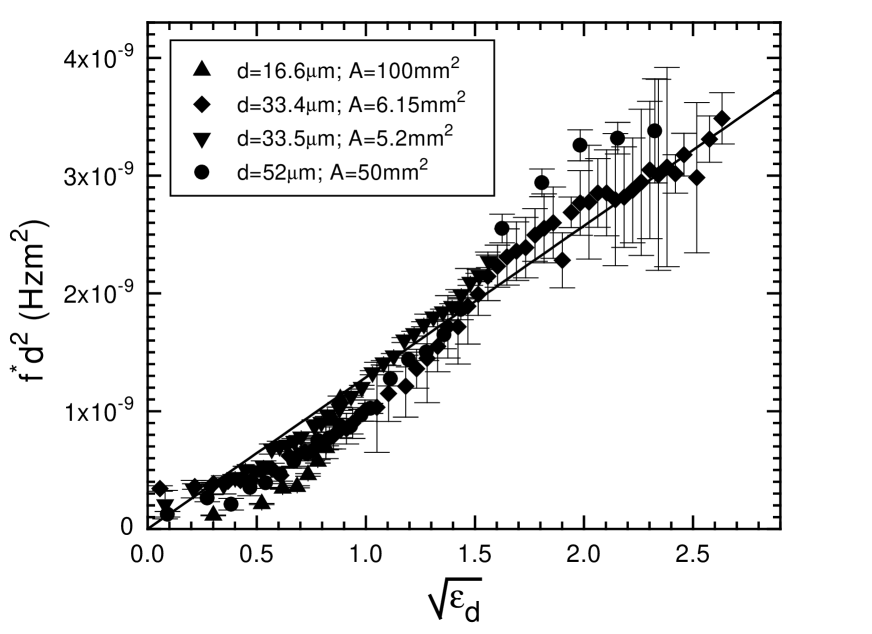
The dependence of obtained from in M5 samples is presented in Fig. 4 for four different aspect ratios (solid symbols). The open circles in this figure are inverse lifetimes , as observed from visually tracking the evolution of defects, a few of which are seen in Fig. 1. Each such data point is from averaged over up to ten defects. Stunningly, the inverse lifetimes are, within typically 5%, the same as . We submit that this close agreement leaves little doubt that defects are the localized excitations responsible for fluctuations in the global, dissipated power. The inset of Fig. 4 better shows that the oscillations in start at -well above the onset of EC.
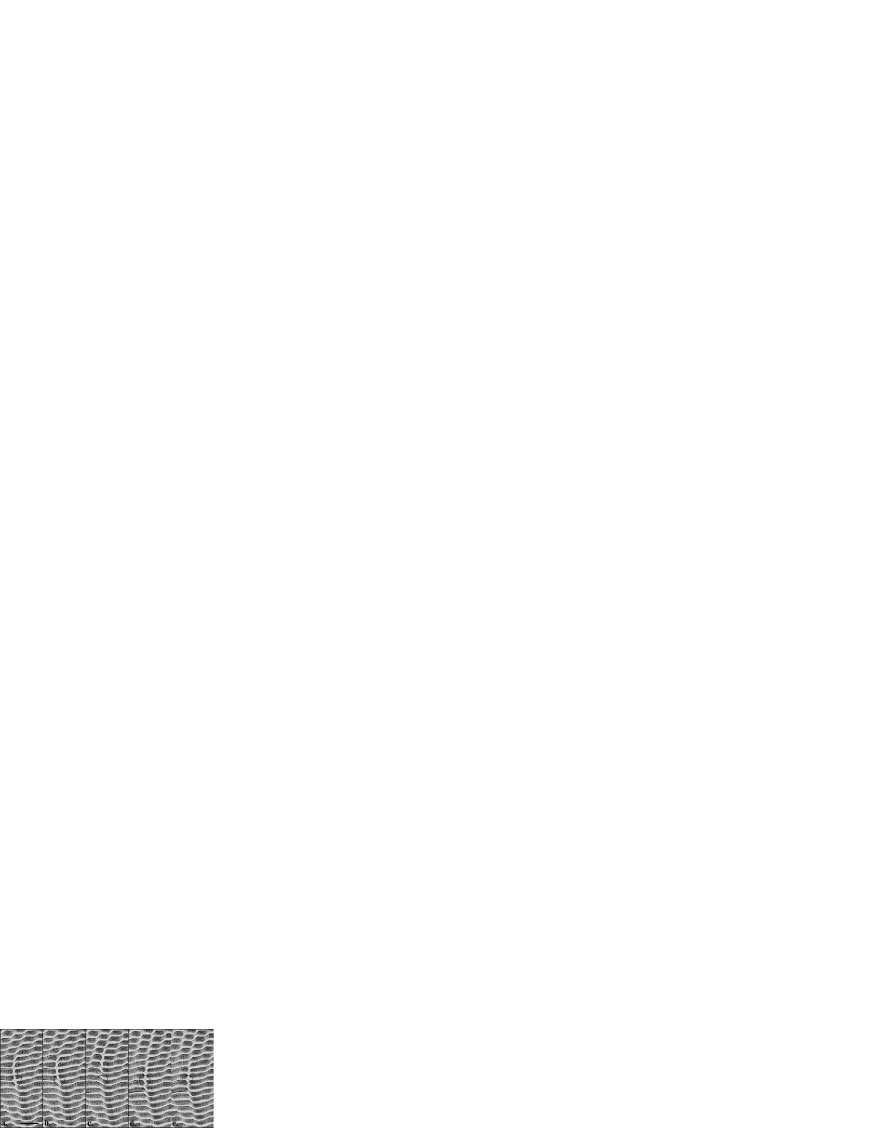
Figure 1 displays a series of photographs made at the indicated times . The liquid crystal is M5 having a thickness, m. In this relatively thick sample, the ’varicose’ pattern persists down to At this low level of excitation, the number of generated defects is relatively small and the motion of the rolls is slow. At we begin watching a single defect of interest (marked with a black circle) as it starts to annihilate [Fig. 1(a)]; later the annihilation process is finished [Fig. 1(b)] and a defect is created at the same location about later [Fig. 1(d)-(e)]. Note, there is a slight difference in the position of the defects in Fig. 1(a) and (e) due to the slow climb motion nasuno89 .
Optically tracking dislocations is problematic as the number of defects increases and their lifetime decreases. The frame grabber has limited time resolution, and when the dislocations are too dense, it becomes difficult to track individual dislocations as the climb/glide motion of the defects speeds upnasuno89 . Measuring power fluctuations has no such limitation. Thus, having identified as the defect lifetimes, we are able to determine this quantity beyond the range where it is possible to do so optically. In Fig. 4, is measured over the whole range of where so-called weak turbulence (where the spatial coherence is destroyed)nasuno92 ) occurs up to the hard turbulence transition (DSM1), where oscillations in diminish.
In RBC qiu02 when the Rayleigh number is increased above a threshold, the rate of generation of thermal plumes increases, and, they begin interacting via their self-generated flow field. This occurs in the same range in which the transition from soft to hard turbulence occurs. The plume motion is temporally correlated, producing coherent oscillations in both temperature and velocity (as observed by monitoring a single point in space). Villermaux’s modelviller95 predicts the frequency of these oscillations should scale with and increase with . Within this model, the oscillations arise from a recirculation flow having length scale comparable to the entire system.
On the other hand, in EC the continuous generation/annihilation of dislocations (defect turbulence) results from an advection of the roll pattern by the mean flow, which amplifies small undulations in the director field kaiser93 . Because the boundary conditions counteract the bending of rolls, the stress is released by straightening the rolls and topological defects are left behind. A number of experimental studies have been devoted to the motion of defects and the process of their creation and annihilation nasuno92 ; nasuno89 ; rasen90 . Most of those measurements were made at relatively low , where few defects are created. In the context of the present work, the most important result of those studies is that two kinds of forces determine the motion of the defects: a large scale pattern-selection force and a short-range interaction force (for details see nasuno89 ).
The similarities between RBC thermal plumes and EC dislocations are striking. Both plumes and dislocations are generated in the presence of a large scale flow. They interact with the neighbouring plumes (dislocations) and they organize themselves in space and time producing coherent oscillations. The most convincing evidence connecting EC and RBC comes from the agreement between our experimental results and the prediction of Ref. viller95 . There Villermaux shows, for RBC, that the quantity should obey the relation, . Figure 5 shows obtained from electric power fluctuation measurements (c.f. Fig. 4) scaled with . The abcissa is , where is defined as the threshold of the defect creation/annihilation ().Ra All data for different (and ) collapse into the same curve.
In conclusion, we have identified the source of the dramatic increase of the normalized variance in dissipated power in electroconvection as coming from the spontaneous generation and annihilation of dislocations in the roll pattern. Even though not spatially coherent, these localized excitations, of limited lifetime, lead to persistent, long-time temporal coherence in global quantities. Similar coherence, seen in Rayleigh-Bénard convection, is associated with the generation of thermal plumes. From Fig. 5, and the calculations of Villermaux, we conclude that dislocations in EC play the role same role as do thermal plumes in RBC.
Acknowledgements.
This work us supported by the by the National Science Foundation under Grants DMR-9988614 and DMR-0201805.References
- (1) D.J. Evans et al., Phys. Rev. Lett. 71, 2401 (1993); R. Labbé et al., J. Phys. II (France) 6, 1099 (1996); S.T. Bramwell et al., Nature 396, 552 (1998); S.T. Bramwell et al., Phys. Rev. Lett. 84, 3744 (2000); S. Aumaitre et al., Eur. Phys. J. B19, 449 (2001); S.T. Bramwell et al., Europhys. Lett. 57, 310 (2002); G.M. Wang et. al., Phys. Rev. Lett. 89, 050601 (2002).
- (2) G. Gallavotti and E.G.D. Cohen, Phys. Rev. Lett. 74, 2694 (1995); G. Gallavotti Chaos 8, 384 (1998).
- (3) S. Kai and W. Zimmermann, Prog. Theor. Phys. Suppl. 99, 458 (1989).
- (4) S. Ashkenazi, and V. Steinberg, Phys. Rev. Lett. 83, 3641 (1999); S. Ashkenazi, and V. Steinberg, Phys. Rev. Lett. 83, 4760 (1999); X.-L. Qiu, S.H. Yao, and P. Tong, Phys. Rev. E61, R6075 (2000); X.-L. Qiu, and P. Tong, Phys. Rev. Lett. 87, 094501 (2001).
- (5) X.-L. Qiu, and P. Tong, Phys. Rev. E64, 036304 (2001).
- (6) X.-L. Qiu, and P. Tong, Phys. Rev. E66, 026308 (2002).
- (7) Product of Merck Co.
- (8) J. Shi, C. Wang, V. Surendranath, K. Kang and J.T. Gleeson, Liq. Cryst. 29, 877 (2002).
- (9) J.T. Gleeson, Phys. Rev. E63, 026306 (2001).
- (10) J.T. Gleeson, N. Gheorghiu and E. Plaut, Eur. Phys. J. B26, 515 (2002).
- (11) W.I. Goldburg, Y.Y. Goldschmidt and H. Kellay, Phys. Rev. Lett., 87, 245502 (2001).
- (12) E. Bodenschatz, J. Phys. France 49, 1875 (1988).
- (13) S. Kai and K. Hirakawa, Prog. Theor. Phys. Suppl. 64, 212 (1978).
- (14) S.Nasuno, O.Sasaki, S. Kai and W. Zimmermann, Phys. Rev. A46, 4954 (1992).
- (15) S.Nasuno, S. Takeuchi and Y. Sawada, Phys. Rev. A40, R3457 (1989).
- (16) E. Villermaux, Phys. Rev. Lett. 75, 4618 (1995).
- (17) M. Kaiser and W. Pesch, Phys. Rev. E48, 4510 (1993).
- (18) S. Kai, N. Chizumi and M. Kohno, Phys. Rev. A40, 6554 (1989); S. Rasenat, V. Steinberg and I. Rehberg, Phys. Rev. A42, 5998 (1990); S. Rasenat, E. Braun and V. Steinberg, Phys. Rev. A43, R5728 (1991).
- (19) is properly compared directly with the reduced Rayleigh number, , in which is the threshold for RBC. Plumes are seen , where the only difference between and is a multiplicative constant.