Phase relaxation of Faraday surface waves
Abstract
Surface waves on a liquid air interface excited by a vertical vibration of a fluid layer (Faraday waves) are employed to investigate the phase relaxation of ideally ordered patterns. By means of a combined frequency-amplitude modulation of the excitation signal a periodic expansion and dilatation of a square wave pattern is generated, the dynamics of which is well described by a Debye relaxator. By comparison with the results of a linear theory it is shown that this practice allows a precise measurement of the phase diffusion constant.
47.54.+r, 47.20.Ma
Our understanding of spatio-temporal pattern formation in non-equilibrium fluid systems has greatly benefitted [1] from recent quantitative experiments in combination with the development of new theoretical concepts. One of them is the so-called amplitude equation approach [2], which is based on the linear instability of a homogeneous state and leads naturally to a classification of patterns in terms of characteristic wave numbers and frequencies. A different but equally universal description, the phase dynamics [3], applies to situations where a periodic spatial pattern experiences long wavelength phase modulations. This approach, originally introduced in the context of thermal convection, has proven to be useful to understand the stability and the relaxation of periodic patterns, wave number selection, and defect dynamics. In many paradigmatic pattern forming systems such as thermal convection in a fluid layer heated from below (Rayleigh Bénard convection, RBC) or the formation of azimuthal vortices in the gap between two rotating cylinders (Taylor Couette flow, TCF) the dominating wave number is dictated by the geometry and thus inconvenient to be changed in a given experimental setup (for instance by a mechanical ramp of the layer thickness [4]).
Faraday waves are surface waves on the interface between two immiscible fluids, excited by a vertical vibration of the container. Beyond a sufficiently large excitation amplitude the plane interface undergoes an instability (Faraday instability) and standing surface waves appear, oscillating with a frequency one half of the drive. This type of parametric wave instability is attractive as the wavelength of the pattern is dispersion rather than geometry controlled. Just by varying the drive frequency the wave number can be tuned in a wide range. In that sense the Faraday setup is well suited for the study of phase dynamics.
Nevertheless recent research activity in this field was mainly dedicated to the exploration of the processes underlying the selection of patterns with a fixed wavelength. Faraday [5] was the first to provide a quantitative study of this system, revealing that a sinusoidal vibration may induce a periodic array of squares. Later on, more complicated patterns with up to a 12-fold rotational symmetry (quasi-periodic structures) have been observed [6, 7]. Here the amplitude equation technique contributed considerably to unfold the governing spatio-temporal resonance mechanisms. Applied to a set of modes with different orientations but fixed wavelength, the resulting set of Landau equations lead to a semi-quantitative understanding [8] of pattern selection in this system. Motivated by these advances the idea came up to apply more complicated drive signals composed of two or more commensurable frequencies [9]. That way the simultaneous excitation of distinct wavelengths gave rise to novel surface patterns in form of superlattices [9, 10, 11]. Only recently the phase information carried by the participating modes was found to have a crucial influence on the visual appearance of the convection structures [12].
In comparison to other classical pattern forming systems such as RBC or TCF, the phase dynamics in the Faraday system is much less explored. In usual Faraday experiments the drive frequency (or frequency composition including relative amplitudes) is held fixed while the overall drive amplitude is ramped in order to record the bifurcation sequence of appearing structures. To our knowledge none of the previous investigations used the excitation frequency as the primary control parameter rather than the drive amplitude . That way it is particularly simple to impose phase perturbations on ordered patterns and to study their relaxation dynamics. Moreover, doing phase dynamics on the Faraday system has the additional advantage of rather quick relaxation times, which in typical setups are one and two order of magnitude faster than for instance in RBC.
The present paper reports a systematic investigation of phase relaxation on Faraday surface waves. Our study is focused on the relaxational dynamics of an ideal surface pattern with a square tesselation. By evaluating the relaxation time of the pattern in response to small changes of the frequency, the phase diffusion coefficient has been measured. The experimental results are found to be in good agreement with the findings of the linear theory evaluated for a system of infinite lateral extension.
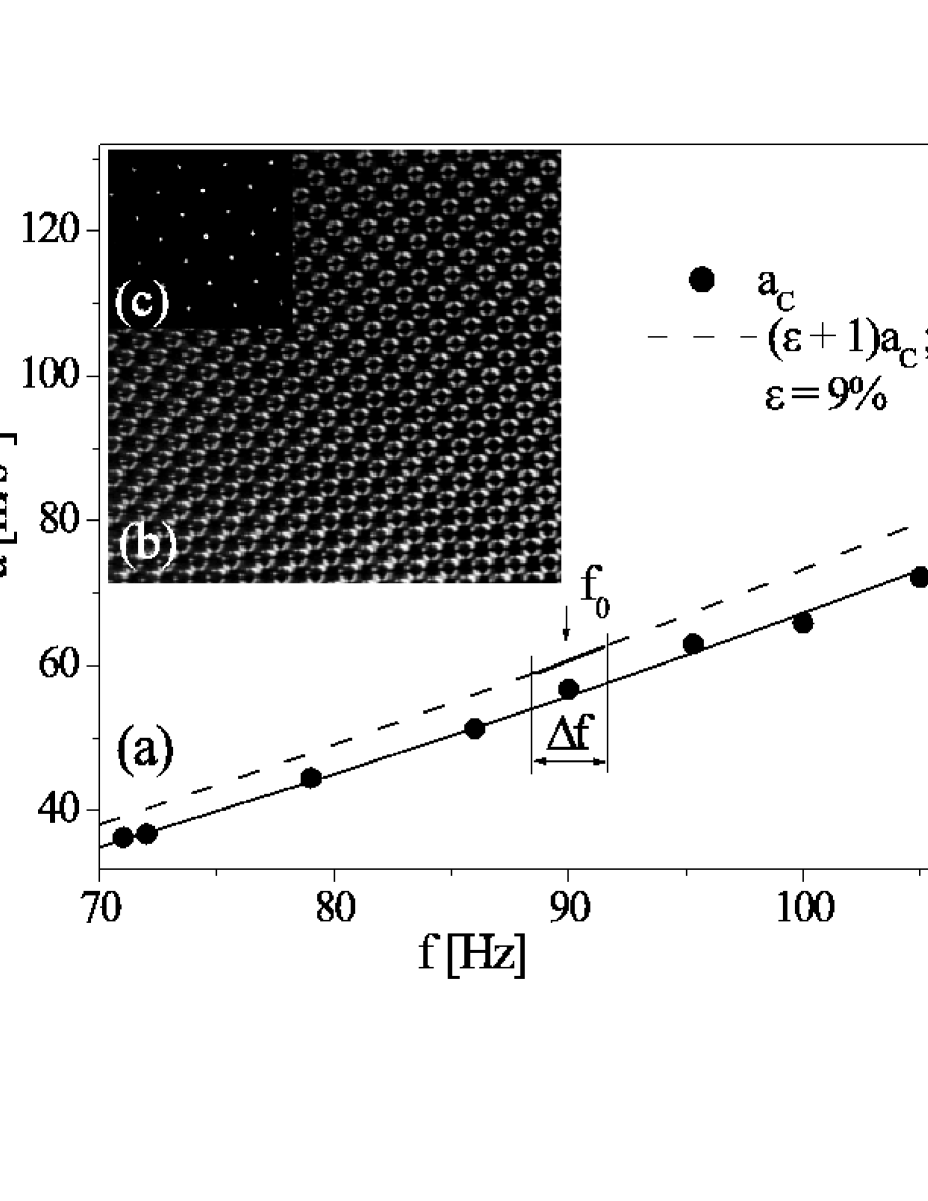
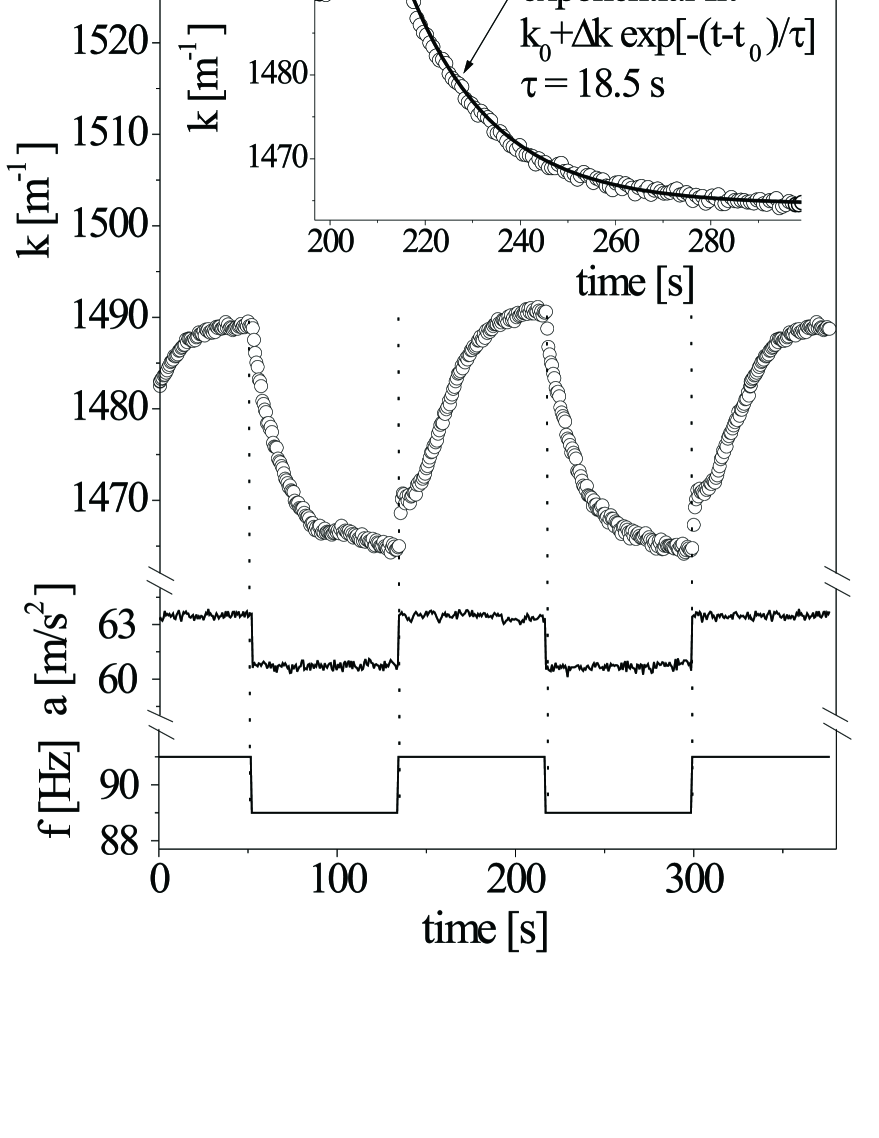
The experimental setup consists of a black cylindrical container built out of anodized aluminium, and filled to a height of mm with a silicone oil (kinematic viscosity m2/s, density kg/m3, surface tension N/m). In order to study finite size effects, we used three different containers, with inner diameters mm, mm, and mm. A glass plate covering the container was used to prevent evaporation, pollution and temperature fluctuations of the liquid. Furthermore, to avoid uncontrolled changes of the viscosity, density, and surface tension of the liquid, all the measurements have been performed at a constant temperature of C. The Faraday waves were excited by an electromagnetic shaker vibrating vertically with an acceleration allowing for simultaneous amplitude and frequency modulations in the form . The corresponding input signal was produced by a waveform generator via a D/A-converter. The instantaneous acceleration was measured by a piezoelectric sensor. In a preparatory experiment undertaken with a sinusoidal (i.e. unmodulated) drive the critical acceleration amplitude for the onset of the Faraday instability was determined by visual inspection of the interface while quasi-statically ramping at fixed (see Fig. 1). Throughout the investigated frequency interval Hz Hz the surface patterns, which appear at a supercritical drive of less than about , always consisted of an ordered square wave pattern, which – after some healing time – was free of defects (Fig. 1b). In order to study the dynamics of phase-perturbed patterns we have carried out measurements of the average wave number of the Faraday pattern in response to small changes of the drive frequency around a mean value . The -modulation has been accomplished in two different ways: (i) By discontinuous jumps (back and forth) between frequencies and with a repetition period between -s, sufficiently large for the pattern to relax. (ii) By a sinusoidal modulation of the drive frequency according to , with between and s. (within the frequency range of our study, the response time of the shaker to small changes of the drive frequency is less than ms and thus negligible). In both cases the vibration amplitude was co-modulated in such a way that the instantaneous supercritical drive remained constant (see Fig. 1a). The bandwidth of the modulation needed to be confined to a few Hz in order to avoid the occurrence of dislocation-type defects. Under those conditions the square pattern remained practically ideal without perturbations (see Fig. 1b), just expanding and contracting (breathing) in a homogeneous manner with the modulation period . To obtain the temporal wave number dependence a full frame CCD camera surrounded by a set of 4 incandescent lamps was mounted some distance above the container. About pictures of the light reflected from the surface were taken at consecutive instances of maximum surface excursion from which the spatially averaged wave number was extracted by evaluating the position of the principal peaks in a 2-dimensional FFT.
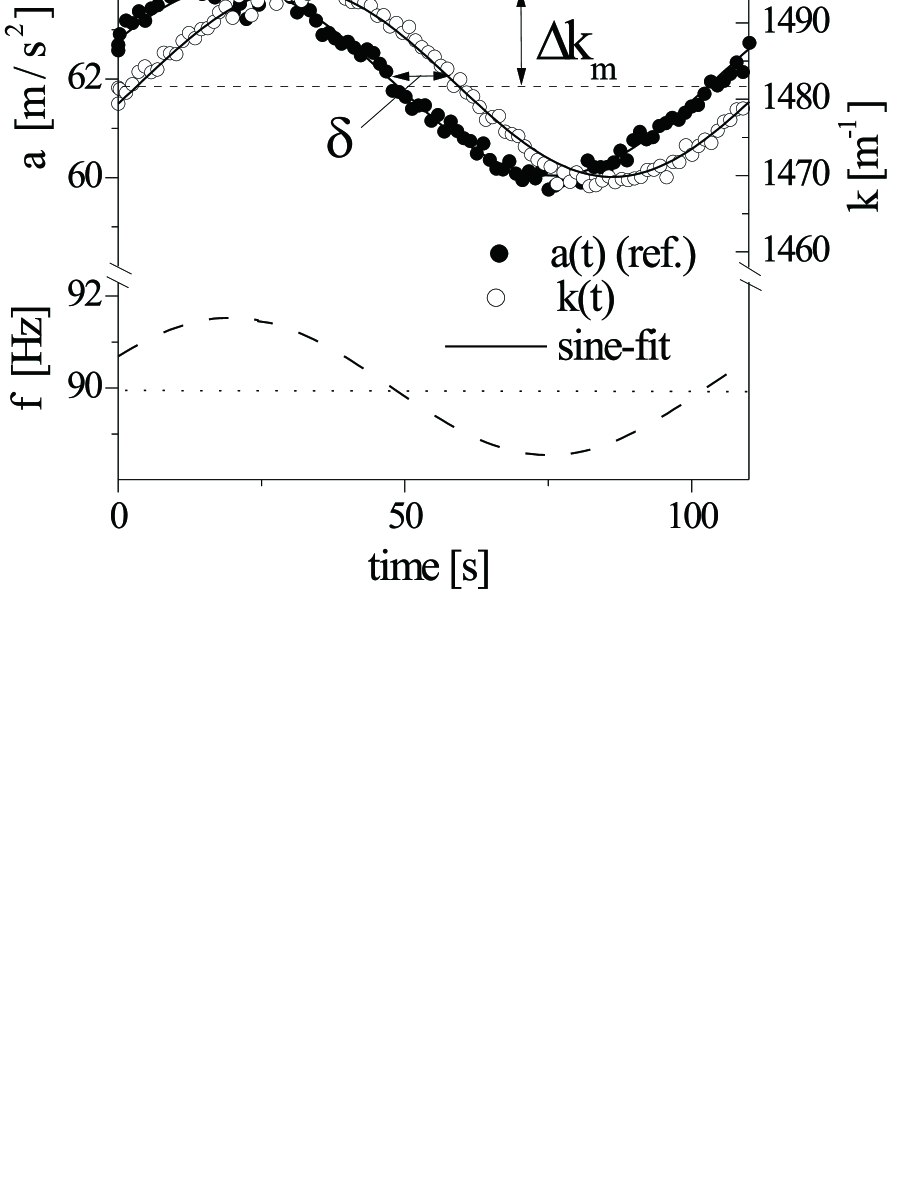
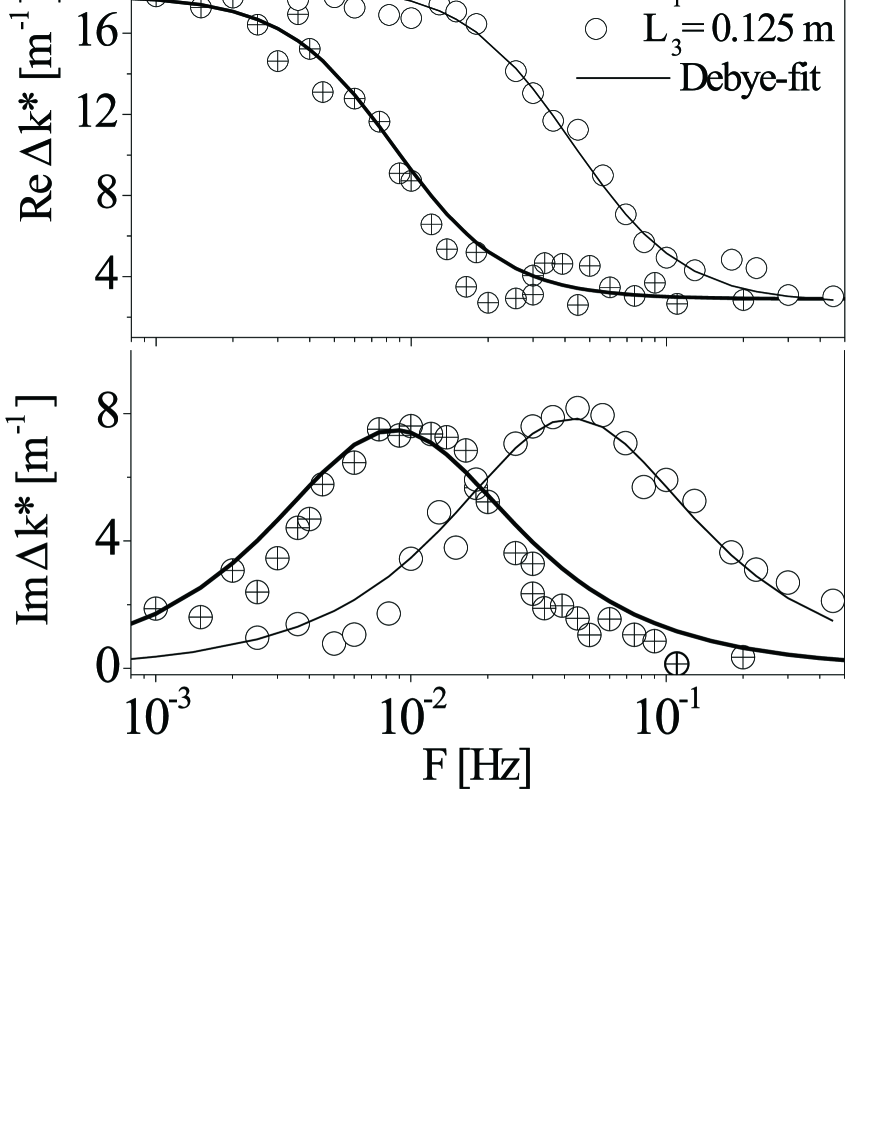
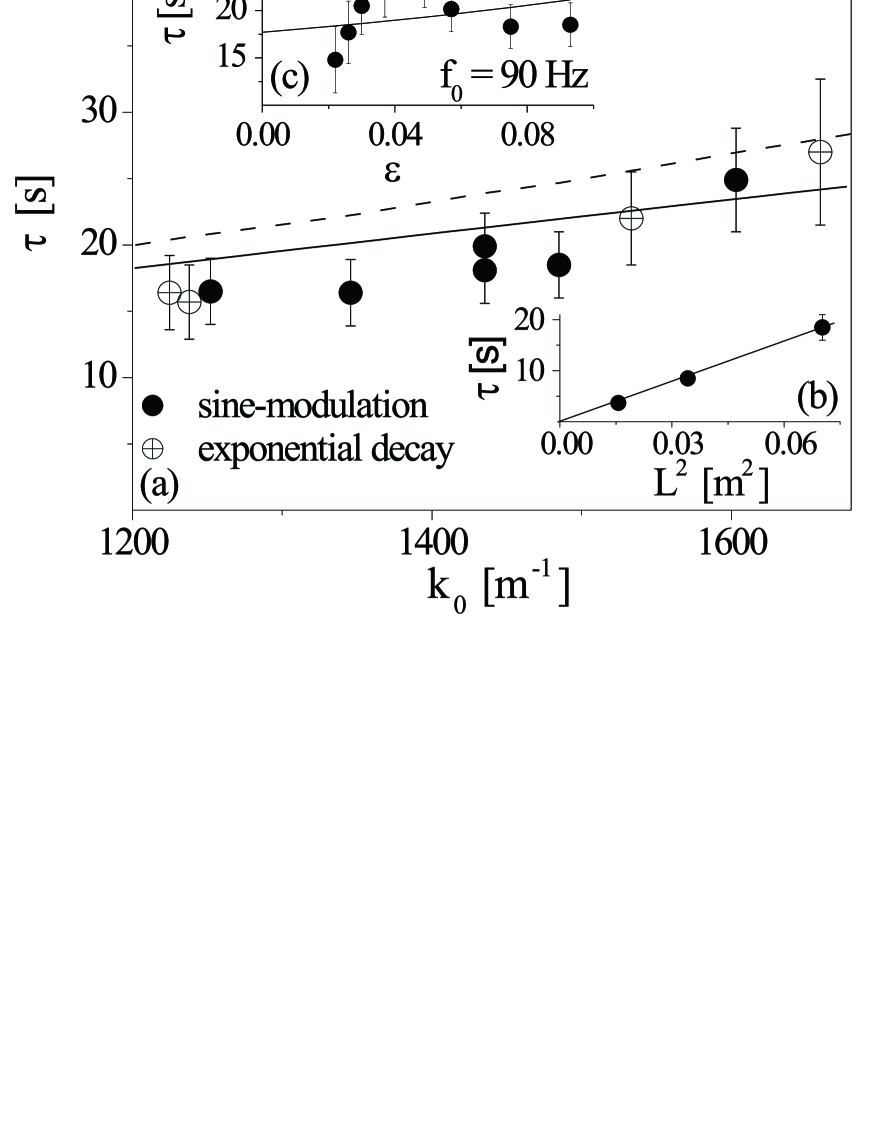
The wave number followed the modulation in a relaxational manner. For the discontinuous modulation (i) this is directly apparent from Fig. 2. Here the relaxation time has been derived by fitting the exponential decay of the data. In the type (ii) experiment oscillates around a mean value with an amplitude and a temporal phase lag (see Fig. 3). Introducing the complex wave number increment , its real and imaginary parts are plotted in Fig. 4 as a function of the modulation frequency . The solid curves of this figure are fits of a linear Debye relaxator, where . Fig. 5 shows the relaxation time , as obtained from both types of experiments, as a function of the mean wave number , the container diameter and the reduced drive strength . A dependence on the (small) modulation amplitude could not be detected. The experimental data reveal a linear increase with the wave number and a proportionality to the square of the container size .
The dependence of the relaxation time on, respectively, , , and can be understood in terms of the phase diffusion approach [3]. Here one takes advantage of the fact that local disturbances of the elevation amplitude die out rapidly, while long-wavelength phase perturbation survive on a much longer (diffusive) time scale. To streamline the arguments and to work out the basic physics we consider a 1-dimensional surface elevation profile in form of stripes as given by . Here describes the spatio-temporal variation of the local wave number around the underlying base pattern with the wave number . Following the phase diffusion approach the phase obeys a diffusion equation of the form with the diffusion constant (valid close above onset) of the form
| (1) |
The coefficients and are given in terms of the linear growth rate at which plane wave perturbations grow out of the plane undeformed interface, when the Faraday instability sets in. Here is the wave number at onset of the Faraday instability. For weakly damped () capillary waves [] on a deep () fluid layer (reasonable approximations in our experiment) one obtains approximately and . By decomposition of the phase perturbations into a set of discrete Fourier modes compatible with the finite container dimension, , the mode has the slowest decay time
| (2) |
and thus determines the relaxation time of the wave number of the experiment. The dashed line in Fig. 5 is the prediction according to Eq. (2). For a quantitatively more reliable check we also evaluated the coefficients and numerically from a linear analysis, which takes into account the finite filling level as well as gravitational contributions to the wave dispersion. The respective result is shown by the solid line in Fig. 5a. Furthermore, the predicted quadratic dependence of on the container dimension is verified by Fig. 5b. The theoretical prediction Eq. (2) also implies a slight dependence of on the drive amplitude . However, checking for this feature requires to account for the fact that also the mean wave number is affected by the drive strength. We deduced the empiric dependence with from a control run where was slowly ramped at fixed . Inserting this result into the last term on the right hand side of Eq. (2) leads to the following expression
| (3) |
Although this relation (see solid line in Fig. 5c) gives a reasonable estimate for the -dependence of it does not correctly reflect the empiric dependence. Apparently this is a finite size effect, which is expected to become significant at small values of . Roth et al. [13] recently demonstrated that the effective phase diffusion constant, measurable in RBC and TCF relaxation experiments, depends sensitively on the aspect ratio , defined by the quotient between the container dimension and the linear correlation length. Taking TCF as an example, a decrease of from down to (which in our experiment corresponds to a reduction of form to ) implies a decay of the relaxation time by . This is of the same order of magnitude as the value observed in our measurements (see Fig. 5c).
Acknowledgements — We thank M. Lücke for helpful comments and J. Albers for his support. This work is financially supported by the Deutsche Forschungsgemeinschaft.
REFERENCES
- [1] M. C. Cross, P. C. Hohenberg, Rev. Mod. Phys. 65, 851 (1993).
- [2] A. C. Newell, J. A.Whitehead, J. Fluid Mech. 38, 279 (1969); L. A. Segel, J. Fluid Mech 38, 203 (1969).
- [3] Y. Pomeau, P. Manneville, J. Phys. Lett. 40, L-609 (1979).
- [4] L. Kramer, E. Ben-Jacob, H. Brand, M. C. Cross, Phys. Rev. Lett. 49, 1891 (1982); Y. Pomeau, S. Zaleski, J. Phys. Lett. 44, L135 (1983); I. Rehberg, E. Bodenschatz, B. Winkler, and F. H. Busse Phys. Rev. Lett. 59, 282-284 (1987); L. Ning, G. Ahlers, and D. S. Cannell Phys. Rev. Lett. 64, 1235-1238 (1990).
- [5] M. Faraday, Philos. Trans. R. Soc. London 52, 319 (1831).
- [6] S. Douady, J. Fluid Mech. 221, 383 (1990); B. Christiansen, P. Alstrom, M. T. Levinsen, Phys. Rev. Lett. 68, 2157 (1992); J. Fluid Mech. 291, 3231 (1998); K. Kumar, K.M. S. Bajaj, Phys. Rev. E52, R4606 (1995); A. Kudrolli, J. P. Gollub, Physica D 97, 133 (1996); D. Binks, W. van der Water, Phys. Rev. Lett. 78, 4043 (1997).
- [7] for a recent review see also: H. W. Müller, R. Friedrich, and D. Papathanassiou, Theoretical and experimental studies of the Faraday instability, in: Lecture notes in Physics, ed. by F. Busse and S. C. Müller, Springer (1998).
- [8] S. T. Milner, J. Fluid Mech. 225, 81 (1991); W. Zhang, J. Vinals, Phys. Rev E 53, R4283 (1996); J. Fluid Mech. 336, 301 (1997); 341, 225 (1997);P. Chen, J. Vinals, Phys. Rev. Lett. 79, 2670 (1997); Phys. Rev. E 60, 559 (1999).
- [9] W. S. Edwards, S. Fauve, Phys. Rev E 47, R788 (1993); J. Fluid Mech. 278, 123 (1994).
- [10] A. Kudrolli, B. Pier, J. P. Gollub, Physica D 123, 99 (1998).
- [11] H. Arbell, J. Fineberg, Phys. Rev. Lett. 85, 756 (2000); 84, 654 (2000).
- [12] C. Wagner, H. W. Müller, K. Knorr, Pattern formation at the bi-critical point of the Faraday instability submitted, pattsol: http://arxiv.org/ps/nlin.PS/0107018
- [13] D. Roth, M. Lücke, M. Kamps, R. Schmitz, Phys. Rev. E 50, 2756 (1994).