Cooperation, adaptation and the emergence of leadership \toctitleCooperation, adaptation and the emergence of leadership
Carretera de Valldemossa 7.5km, E-07071 Palma de Mallorca, Spain 22institutetext: Depto. de Fisica–FCEN, Universidad de Buenos Aires,
Pabellón I Ciudad Universitaria, 1428 Buenos Aires, Argentina 33institutetext: Center for Chaos and Turbulence Studies, The Niels Bohr Institute,
Blegdamsvej 17, DK2100 Copenhagen Ø, Denmark
*
Abstract
A generic property of biological, social and economical networks is their ability to evolve in time, creating and suppressing interactions. We approach this issue within the framework of an adaptive network of agents playing a Prisoner’s Dilemma game, where each agent plays with its local neighbors, collects an aggregate payoff and imitates the strategy of its best neighbor. We allow the agents to adapt their local neighborhood according to their satisfaction level and the strategy played. We show that a steady state is reached, where the strategy and network configurations remain stationary. While the fraction of cooperative agents is high in these states, their average payoff is lower than the one attained by the defectors. The system self-organizes in such a way that the structure of links in the network is quite inhomogeneous, revealing the occurrence of cooperator “leaders” with a very high connectivity, which guarantee that global cooperation can be sustained in the whole network. Perturbing the leaders produces drastic changes of the network, leading to global dynamical cascades. These cascades induce a transient oscillation in the population of agents between the nearly all-defectors state and the all-cooperators outcome, before setting again in a state of high global cooperation.
1 Introduction
In the agent-based models used in Social Sciences, Economy and Political Economy, agents interact directly with one another, and a social macrostructure emerges from these interactions. The implications of these models are easily studied with computer simulations. In this computational approach it is very natural to implement a network of interactions among the agents [9]. In addition, such computer simulations permit to study the dynamical evolution of the social structures.
In this context, an important question that is being addressed in a number of ways is how the aggregate or global behavior emerges from the individual characteristics of the agents. A particular aspect of this question is to understand if the global behavior is determined by average commonly found agents or if a few individual distinct agents can have a strong influence in the emerging macrostructure. In the latter case such special agents play the role of social leaders. Generally speaking, the influence of each agent depends on the network of interactions with other agents, an interaction being represented by a link between two agents. These interactions can be restricted to a set of agents placed in neighboring sites of a regular spatial lattice, can reach arbitrary agents as in a random network or can occur through intermediate “small-world” networks [17]. In most cases, this network of interactions is fixed and given from the outset. However, it is natural to consider situations in which the network of interactions evolves dynamically adapting itself to the emerging global structure.
In this paper we tackle the problem of how cooperation arises in a dynamically evolving network of agents. The network adaptation allows the emergence of an asymptotic state dominated by those special agents which in the course of the dynamical evolution are able to establish a much larger number of links than the average agent.
The paradigm to study the emergence of cooperation has been the Prisoner’s Dilemma (PD) game. Using evolutionary game theory [18], it was shown [3, 2] that cooperation may be sustained by a population of agents meeting repeatedly through global random interactions. Two agents interact playing the game and, according to their outcome, their strategies are allowed to evolve. A second route to cooperative behavior, pioneered by Nowak and May 111See for e.g. [14, 11, 10, 6, 15]. A cellular automata representation with several learning rules is presented in Ref. [8]. For an extensive study of the dynamics of a PD game with different strategies, evolution of the strategies and different networks see Ref. [4]., comes from the consideration of “spatial games”. In these games every individual interacts only with a given subset from the whole population (e.g. the neighbors). The neighbors are defined by a fixed network of interactions. The spatial network can promote the emergence of cooperation in situations in which global non-cooperative behavior results if the interactions were random and homogeneous. Here we also consider a spatial Prisoner’s Dilemma game. The novelty is that the group of agents with which a given one interacts adapts endogenously during the dynamical evolution. The adaptation of the network builds up cooperation.
In our computer simulation of the game we implement two dynamical rules. The first one is an action update: At each time step, each agent plays the same strategy cooperate (C) or defect (D) with all its local neighbors. Then the agents revise their individual strategies and imitate the neighbors strategy with highest aggregate payoff. Only a few agents will be found to be satisfied and will keep their strategy. The second rule is the network update: Unsatisfied agents are allowed to change their local neighborhood. Specifically, we let defectors break with a certain probability any link with other defectors, and replace them with new neighbors selected randomly from the whole network. The motivation behind this rule is that two defectors playing a PD game would certainly prefer to change its neighbor in order to find a cooperator from whom to ‘exploit’ a better payoff.
The results of our simulations show that the network of agents reaches a steady state with a high degree of cooperative behavior. The fraction of agents that cooperate depends only slightly on the incentive to defect in the individual game. This behavior contrasts with previous studies on “spatial” PD games where partial cooperation was reached, but it was observed that the fraction of agents which are cooperators strongly decreases as the incentive to defect is increased. This feature results from the adaptation of the network and it is reflected in the non-homogeneous structure that it reaches during the dynamical evolution. We will show that the process of “searching” cooperative neighbors performed by defectors, results in the emergence of a leader agent, defined as the cooperator with the largest number of links with other agents in the network. When the leader is not the wealthiest (i.e., the one with largest payoff), the network is in an unstable situation and, depending on the parameter measuring network adaptation, recurrent global cascades may be observed. These cascades induce large oscillations in the fraction of agents which are cooperators, together with a large reorganization of the network. In most cases, a final state with a high degree of cooperation is reached. We have also tested the robustness of such cooperative state. We find that a perturbation (spontaneous change of strategy) on a non-leader usually results in a short transient dynamics returning to the steady state. However, when a leader is perturbed, global cascades may be observed in the system before a state with a high degree of cooperation is recovered. This identifies the importance of the highly-connected agents which play the role of social leaders in the collective dynamics of the system.
The paper is organized as follows. The next Section defines the spatial version of the PD game in an adaptive network. Section 3 describes our numerical results on the emergence of cooperation. In Section 4 we discuss the evolution of the network and the emergence of the ”leader” agents. Finally in Section 5, we summarize our results.
2 Spatial Prisoner s Dilemma in an adaptive network
We consider the following framework: agents sit in the nodes of an adaptive network where the links define their neighborhoods. Each agent plays a PD game only with those other agents directly connected by one link. In this paper, we will restrict ourselves to the case of bidirectional or undirected links, and interactions to first neighbors. Indirect interactions with neighbors’ neighbors have been studied for example in [5, 16, 7]. Thus, two agents are neighbors if they are directly connected by one link. We define the neighborhood of agent as the subset of which are neighbors of , and we represent it as neigh(); its cardinal is . The coordination number, , is defined as the average number of links per node
| (1) |
In this paper we consider random networks with coordination number formed by distributing links between pairs of nodes , with the constraint that (bidirectional links). The resulting distribution of the number of links in the network is Poissonian with the maximum located at the coordination number .
We denote by the strategy of agent at time step , where corresponds to play cooperation (C), and corresponds to defection (D), and will be referred to as C-agents or D-agents, respectively. The payoff matrix for a 2-agent PD game is shown in Table 1, where it is standard to take and .
| C | D | |
|---|---|---|
| C | ||
| D |
We consider the situation in which agents seek the largest possible benefit from their local interactions in the network . We assume each agent plays the same strategy with all its neighbors neigh(), and the strategy is updated by all the agents at the same time; synchronous update. The time evolution is as follows:
-
1.
Each agent plays the PD game with each neighbor using the same strategy and collecting a total individual payoff ,
(2) where is the number of links of agent and is the number of neighbors of agent that are C-agents.
-
2.
Agent revises its current strategy at each iteration of the game (i.e. at every time step), and updates it by imitating the strategy of its neighbor with a highest pay-off. Agent is said to be satisfied if it has the largest pay-off in his neighborhood. Otherwise it will be unsatisfied and it will revise its strategy.
-
3.
Network Rule: each agent may adapt its local neighborhood:
if agent is an unsatisfied D-agent then with probability breaks a link with a D-neighbor neigh(), and replace it with a new agent uniformly from .
This scheme leads to a time evolution of the structure of the whole network, but the coordination number remains constant: for each unsatisfied D-agent , it will replace (on average) D-neighbors by new neighbors randomly chosen for the whole set, and thus its local coordination number, , will not change; however, the replaced D-agents will lose one link and the new selected ones will gain one link.
The network rule justification is based on the assumption that given two D-agents playing a PD game, if they are unsatisfied, then they would prefer to exchange D-neighbors with the hope of finding a new C-neighbor from whom to exploit a much better individual payoff. This effectively amounts to ascribe a “searching” capability to D-agents. In our proposed setting the searching is not optimized, in the sense that the searching is random, so D-agents taking its chance to improve its payoff may end up with a new C-neighbor with a larger payoff, forcing it to replicate this new strategy in the next time step. In the same spirit, one could think that cooperators would also have a preference to break links with other D-agents. We prefer to keep this asymmetry in roles so that D-agents may be described as being competitive in nature, while C-agents remain conservative222In [1] agents may refuse to play with other agents irrespective of the strategy played..
The probability is a measure of the adaptability of the network. Dynamically, this parameter acts effectively as a time scale for the evolution of the network. For the network does not evolve and remains fixed, while for the evolution is very slow as the adaptation takes over only after several trials. For the adaptation is done at the same speed as the game is being played. In other terms, represents a transaction cost composed of two parts: first, the cost of breaking an agreement and second, the cost of finding a new partner and that this new partner accepts the agreement. One could separate these two costs, and would have a process of breaking links (with a given probability ) and another process of generation of links (with a probability ). However for the sake of simplicity we consider these two processes as a single one.
We have also investigated other variations of the network adaptation rule. For example, instead of breaking links with any of the unsatisfied D-neighbors, we also tested a rule which allows an unsatisfied D-agent break with probability solely the link with its D-neighbor with largest pay-off. The qualitative results obtained with this adaptation rule are rather similar [19].
It is worth making the following remarks:
-
•
Links between satisfied agents do not change, which it seems to be a reasonable assumption.
-
•
It is clear from the network adaptation rule, that not only D-agents may actively change their neighborhood, but also C-agents will passively evolve their own set of players by receiving new links from “searching” D-agents.
-
•
In the present model, we do not take into account spontaneous creation or destruction of links, therefore the total number of links in the network is conserved.
-
•
In a standard 2-agent Prisoner’s Dilemma game there exists a unique Nash equilibrium (D,D). In a previous work [19], we considered a variation of the PD payoff matrix with , for comparison with [14, 11]. In this situation the 2-agent PD game has as pure Nash equilibria either (C,D), (D,C) or (D,D). However the results in [14, 11] indicate that, at least for fixed regular network, no qualitatively difference is found in the spatial games when using .
In the next sections we present the results of computer simulations of the model described above. We take as a free parameter the incentive to defect . We consider random initial networks with coordination number and and several values of the adaptability parameter . We investigate, among others, the following statistical measures: (i) the fraction of cooperators, that it, the fraction of agents which are C-agents, denoted by , (ii) the average payoff per agent of the whole network and the distribution of payoff, (iii) the probability of having a link between two C-agents, , between a C-agent and a D-agent, , and between two D-agents, . These probabilities satisfy:
| (3) |
Throughout this work, the parameter which controls the incentive to defect was varied in the range , while the other PD payoff matrix elements were fixed to and . Finally, if not otherwise stated, the network consists of agents, with an initial fraction of C-agents randomly distributed in the network.
| 1.05 | 0.89 | 0.942 | 0.95 | 0.994 |
|---|---|---|---|---|
| 1.15 | 0.87 | 0.947 | 0.90 | 0.989 |
| 1.35 | 0.59 | 0.920 | 0.58 | 0.988 |
| 1.55 | 0.31 | 0.900 | 0.38 | 0.988 |
| 1.75 | 0.09 | 0.885 | 0.03 | 0.983 |
| 1.95 | 0.04 | 0.889 | 0.01 | 0.962 |
3 Cooperation enhancement in an adaptive network
The PD game with local interactions in non-adaptive () regular lattices, has been previously studied in Refs. [14, 15, 13]. These studies showed how partial cooperation can be sustained due to the local interactions, in spite of memory-less strategies. Several extensions to this spatial model have been studied in the literature. For example, introducing asynchronous updates [6] or introducing errors in the imitation process [12], the basic results persist [13].
For comparison with the adaptive network considered below, we give in Table 2 some numerical results for a fixed () random network. Such network is our initial condition for the adaptive network. We see that the average fraction of C-agents decreases with an increasing value of the incentive to defect . Notice that depending on the characteristic coordination number , there is a critical such that for larger values of the system reaches a state of all D-agents. That is, for partial cooperation is supported in these networks. We obtain for a critical . The numerical results also show that increasing the average size of the neighborhood (average number of links per agent, ) the average number of C-agents decreases faster with .
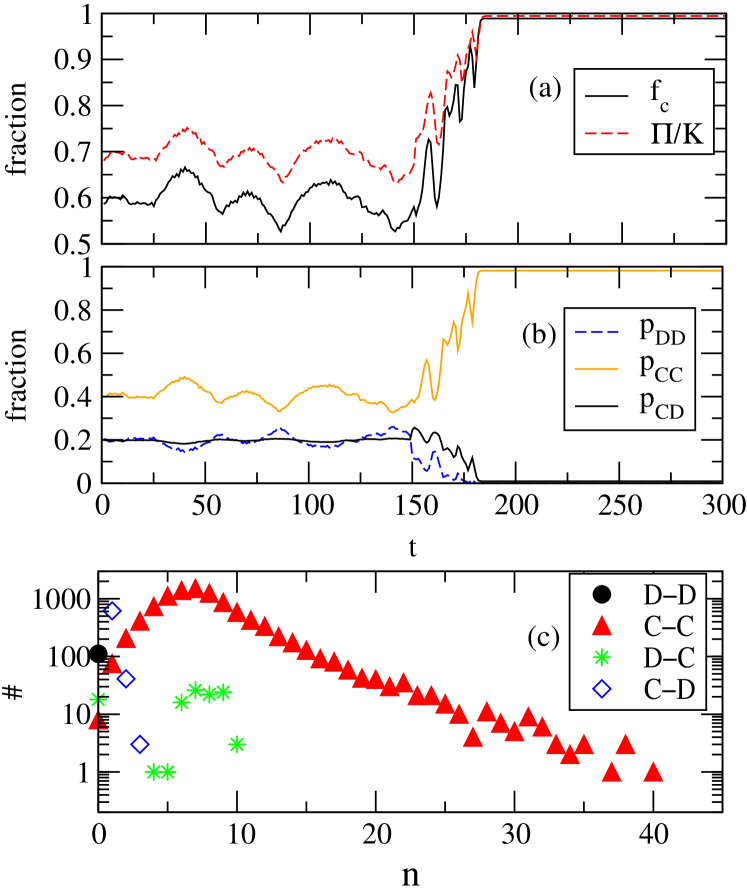
When the network is able to adapt with the outcome of the individual games, either the dynamics settles onto a steady state after some transient time, or the system reaches a full defect state where all the agents are playing D and the network is continuously evolving. To compare the asymptotic dynamics of the fraction of cooperators between the adaptive and non-adaptive case, we illustrate in Fig. 1 a time series of evolving for in a fixed network (), and then for with a fully adaptive network (). We observe that the fraction of cooperators increases as the adaptation is turned on. Table 2 illustrates this behavior for other values of . We conclude that the network adaptation enhances a highly cooperative network. Also notice that in the non-adaptive case, the fraction of cooperators fluctuates slightly, while in the adaptive case a steady state is reached.
It is important to notice that in order to obtain the above results, the initial fraction of cooperators in the network has to be sufficiently large. In all our numeric computations we took an initial fraction of of C-agents, which proved to be a good number for the coordination numbers studied. This was also noticed in previous spatial games and reflects the fact that the cooperative strategy will replicate throughout the network, only if (the approximate) average payoff of C-agents is larger than the one of D-agents. We will show below that in some circumstances, perturbations of the network may destroy the cooperative outcome and lead to a full defective network. Such asymptotic state is a dynamical state, since the network is continuously adapting but never finding a C-agent to exploit.
The steady state found in the adaptive network corresponds to a stationary network structure and to a stationary configuration of strategies. When the system reaches a steady state, there are necessarily no links between D-agents, thus (see Fig. 1(b)), except in the unlikely case of having exactly the same aggregate payoff. Also, in general we have that . Therefore, the steady state is composed by a collection of cooperators exploited by D-agents.
We define a chain of cooperators, as a connected component in of sites occupied by cooperators in which each cooperator except the last one is linked to a neighboring cooperator with larger pay-off. All cooperators in the chain except the last one are actually unsatisfied, but as they imitate the same strategy they were playing on the previous step, they never change their relative payoff. When the system reaches a steady state (), the only possibility for D-agents is to exploit the agents of a given chain and must necessarily be satisfied. In terms of payoff we say that D-agents are “passive” local maxima, in the sense that they have the maximum payoff in their neighborhood but nobody is imitating their strategy. In summary, every cooperator chain should satisfy the following ordering in terms of payoff:
| (4) |
where is a C-agent imitating from C-agent , and is an exploiting D-agent of . It is clear that the number of different steady states which one can construct satisfying eq. (4) is huge for a fair number of agents .
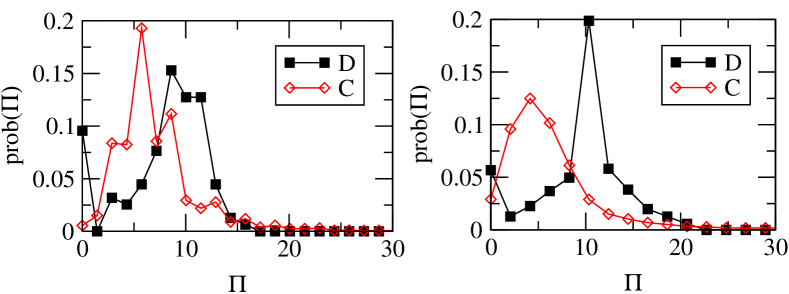
Finally, another salient feature of our cooperative network model is the inhomogeneous distribution of payoff for each subpopulation, which differs substantially from the non-adaptive network case. Figure 2 displays such distributions (normalized to the number of individuals in each subpopulation), and reveals that although defectors are outnumbered by cooperators, on average they are wealthier. This is an interesting result, which indicates that, in the long run, the searching capability of the D-agents rewards them. This behavior is observed systematically in the parameter regime for .
The above result seems surprising from the point of view of the traditional replication dynamics [18] used in evolutionary game theory, because one could conclude from Fig. 2 that D-agents should dominate the whole population. But our results indicate that the final highly cooperative state is not determined by average agents in the system, but rather by a small subset of those maximally connected C-agents. In the next section we discuss the important role played by these cooperative leaders, defined as those C-agents with the largest number of links.
4 Dynamics of network evolution and emergence of leaders
The network rule allows for the evolution of the connectivity of every agent and permits that the network reaches a steady state. The distribution of links in this steady state displays the heterogeneous structure of the network. Figure 1(c) shows the distribution of links between two C-, D-, and between D-C and C-D agents. Notice the broad band distribution of links between two C-agents, which may reach as 5 times the average connectivity of the network. Defectors, on the other hand, are shown to be connected only to C-agents, and have a narrow distribution centered at .
The tail of the distributions of links identifies a very small number of C-agents with a large number of links to other C-agents We define the C-agent with the maximum number of links as the leader. In a steady state this agent should be satisfied and leading a chain of cooperators. The number of C-agents which can fit on a given chain connected to the leader may be huge.
| 1.15 | 25.8 | 11.2 | 25.8 | 12.9 |
| 1.35 | 40.5 | 11.7 | 40.5 | 15.8 |
| 1.55 | 54.1 | 11.8 | 54.1 | 18.3 |
| 1.75 | 56.9 | 13.0 | 56.9 | 22.8 |
| 1.95 | 72.1 | 14.0 | 72.1 | 27.4 |
We have calculated the number of links of the leader agent for different values of the incentive to defect in a steady state. Table 3 gives a measure of the connectivity of the leader, labeled , compared with the number of links of the most connected D-agent labeled (recall that all connections are exploiting other C-agents), with their corresponding payoffs. Notice that for increasing the number of links of the leader increases while it remains essentially constant for the defector with largest number of links.
The leader agent leads the cooperative collective state of the system in several ways. On one hand, the leader favors the creation of chains of cooperators. On the other hand, and provided there are links between D-agents, leaders are selected through the dynamics of the adapting network, and are a direct consequence of the “searching” done by D-agents. Consider for example a D-agent which exchanges one of its D-neighbors with the leader . Assume that . In the next time step the D-agent will become a cooperator by imitation and
| (5) |
Whenever the payoff of the leader is the largest payoff in the whole network its connectivity increases as described by (5).
However, an unstable situation occurs whenever the leader does not have the largest payoff in the whole network. If the leader receives a D-neighbor with a larger payoff, in the subsequent time steps a drastic event happens, for and its associated chain will imitate the D-strategy. If after this cascading imitation there are C-agents left in the network, a new leader with a fewer number of links will be selected; otherwise a full defective network may be reached. This indicates the sensibility of the network structure to small perturbations on individual specially well-connected agents: A local event associated with a particular individual propagates in macrodynamical avalanches into the full network.
The phenomenon described above does not exclude the possibility that a D-agent selects a C-agent which would satisfy (4), allowing agent to become a passive local maximum and exploit the C-agent. In fact, it is by this mechanism that D-agents also increase their payoff.
We have performed several computer simulations to visualize the dynamic evolution of the network which we have just discussed. Each panel of Fig. 3 shows a comparison of the payoff of the leader with the payoff of the D-agent with largest payoff (labeled 333We remark that at every time step a different D-agent may become the agent with largest pay-off. This is a consequence of the competitive nature of D-agents in contrast to the conservative nature of C-agents.), together with the evolution of the fraction of cooperators in the network.
For small values of the adaptability parameter , as shown in panel (a), the typical time for the network to reach a steady state is very large, and the leader increase its connectivity via (5) very slowly. The fraction of cooperators increases on average as the leader increases its number of links. On the other hand for , the typical time to reach a steady state is very short (see Fig. 1), and in general the leader is always the wealthiest agent of the whole population.
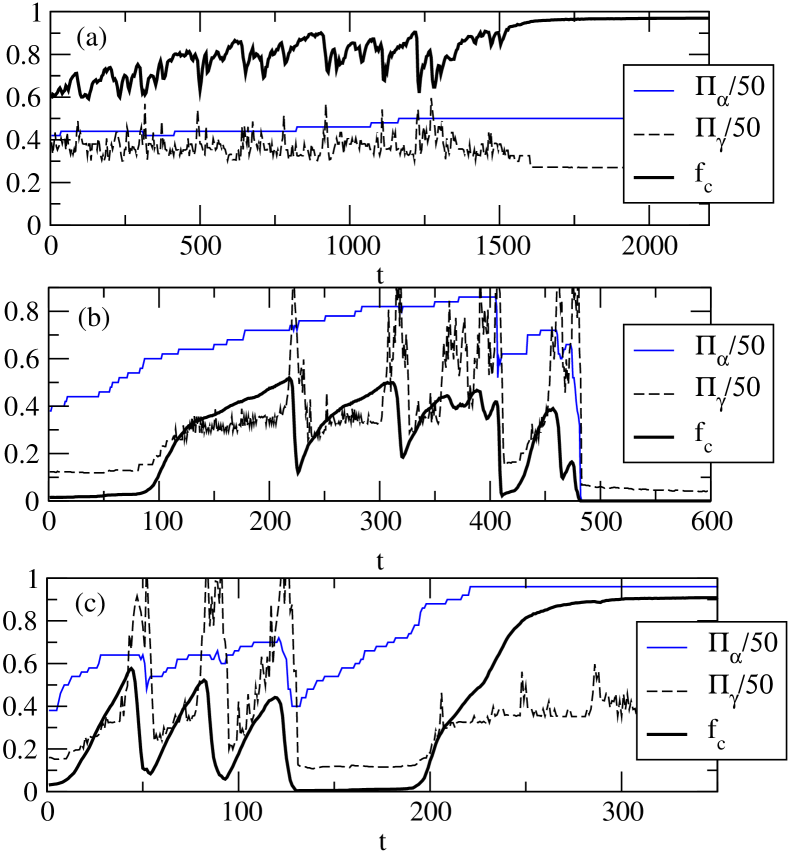
An interesting intermediate regime occurs for and high incentive to defect , where a competition between the cooperative leader and the most wealthy defector arises. In this regime the number of links of the leader does not grow so fast and defectors may get a significant large payoff due to the high value of . Panel (b) and (c) illustrates this situation. It is seen that there are time intervals in which the leader is not wealthier than the D-agent with largest payoff. Whenever this event occurs, large global cascades involving a large fraction of the whole population are observed, with a significant fraction of the whole population being affected. The initial dropout of the fraction of cooperators affects immediately the payoff of exploiting D-agents and reaches a minimum approximately when the leader becomes once again the wealthiest agent in the network. Once this stable situation is re-established, the leader may again increase its number of links until all D-agents have links exclusively with other C-agents ().
An extreme example is observed in panel (c) at , where the network is composed of mostly D-agents together with a very wealthy leader. The leader is able to increases its number of links by the intense (unsuccessful) “searching” done by D-agents, and by the fraction of cooperators also increases. This recovery shows the importance of a wealthy leader, which enables a full cooperative final outcome. Another situation worth mentioning is that whenever strong competition between the leader and the wealthiest D-agent occurs, there is a possibility that the system ends in a full defective network. This is what is shown happens in panel (b) of Fig. 3. We remark that provided the initial fraction of C-agents is large, the full defective network is rarely reached for high enough .
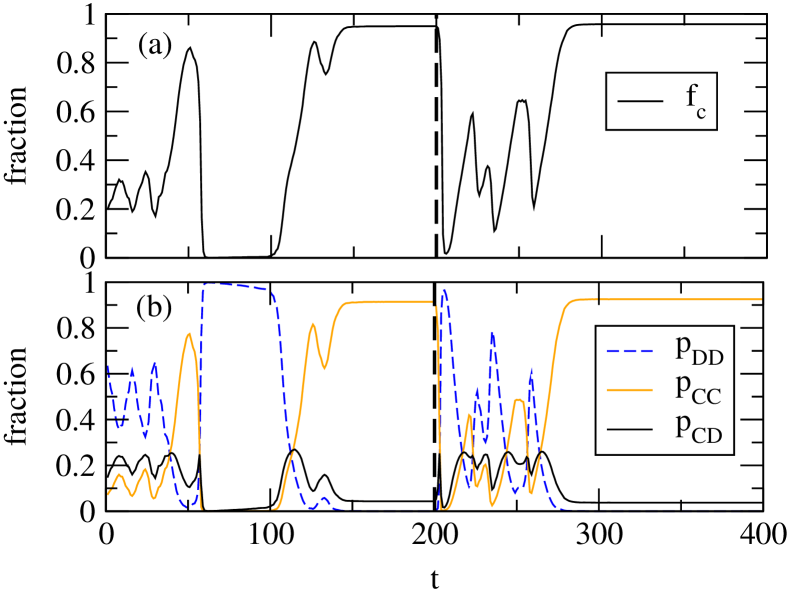
The above results show that the dynamic evolution of the network is intimately related to the fate of the leader. Another possible test, is to study how noise affects the network dynamics. If the noise is in the form of selecting a random agent and spontaneously changing its strategy, then the dominance of C-leaders is found to remain for nearly the whole range of , for a sufficiently small noise intensity. However when the probability of a spontaneous change of strategy is increased, we find that a transition to the full defective network becomes more probable444In fact a full defective network is reached for , where the critical depends on the noise intensity.. Clearly the leader may suffer such perturbations, and induce large cascades in the system. If such drastic perturbations have a small probability, the system has time to reach the cooperative outcome before the new leader is knocked down again. The simulation described in Fig. 4 illustrates how the system reaches a steady state at , and a spontaneous change of strategy was applied to the leader: large cascades results and a final cooperative outcome is again recovered. The transient oscillations observed in Fig. 4 at before a steady state is reached, as well as the ones originated by the change of strategy of the leader constitute a Sysiphus effect. The drop in the fraction of cooperators comes together with a large increase of . Thanks to its adaptability, the network reacts creating more C-C links. However the attempts to build up a large cooperative behavior are not always successful and the system goes through oscillations in which non-cooperative behavior with large values of is recovered. The frustrated attempts to build cooperation indicate that for cooperation to be robust, it has be built upon a specific networks of links. In the frustrated attempts to reach a collective stable cooperative state, the fraction of cooperators becomes large, but the spatial arrangement of links in the network is not the proper one.
5 Discussion
We have introduced a model of cooperation on an adaptive network, where cooperation is highly enhanced with respect to the situation of a fixed network. The network adaptation involves exclusively the D-agents, which in some sense are allowed to “search” for new neighbors, in the hope of finding C-agents to be exploited. Our study shows that this mechanism leads to a global cooperative state of the network. The asymptotic state reached by the system is a steady state in which the network structure and the average payoff per agent remains stationary. However, most agents are unsatisfied, and continuously imitate the strategy of their neighbors with highest payoff (most of them C-agents). The structure of the network can be understood in terms of chains of cooperators with D-agents exploiting some cooperators.
The network adaptation that we have implemented in our spatial game gives rise to the emergence of a leader, a cooperator with maximum number of connections. Whenever the leader is the wealthiest agent in the network, and defectors are still “searching”, the leader may increase its number of links with other cooperators. However, if some defector becomes wealthier than the leader, an unstable situation occurs and large global cascades may take place. Such cascades can also be induced if “noise” in the form of spontaneous change of the strategy is allowed.
We finally note that the dynamics described above cannot be explained in terms of average agents. In the final mostly cooperative state the average wealth of defectors is larger than the average cooperators wealth. The final collective state is dominated by rare individuals which build-up cooperation in the whole population because they have a number of links which is far from the average.
Acknowledgments
MGZ acknowledges financial support from FOMEC-UBA. VME acknowledges financial support from the Danish Natural Research Council. MSM acknowledges financial support from the Spanish Ministerio de Ciencia y Tecnología project BFM2000-1108.
References
- [1] D. Ashlock, M. D. Smucker, and L. Tesfatsion. Preferential partner selection in an evolutionary study of Prisoner’s Dilemma. BioSystems, 37(1-2):99–125, 1996.
- [2] R. Axelrod. The Evolution of Cooperation. Basic Books, New York, 1984.
- [3] R. Axelrod and W. D. Hamilton. The evolution of cooperation. Science, 211:1390–1396, 1981.
- [4] M. Cohen, R. Riolo, and R. Axelrod. The emergence of social organization in the prisoner’s dilemma: how context-preservation and other factors promote cooperation. Santa Fe Institute Working Paper 99-01-002, 1999.
- [5] S. Goyal and S. Joshi. Networks of collaboration in oligopoly. Mimeo, 1999.
- [6] B. A. Huberman and N. S. Glance. Evolutionary games and computer simulations. Proc. Natl. Acad. Sci. USA, 90:7716–7718, 1993.
- [7] M. O. Jackson and A. Watts. The evolution of social and economic networks. Vanderbilt University, Mimeo, 1999.
- [8] O. Kirchkamp. Spatial evolution of automata in the prisoners’ dilemma. Discussion Paper B-330, Rheinische Friedrich Wilhelms Universität Bonn, Mimeo, 1995.
- [9] A. Kirman. Aggregate activity and economic organisation. Revue Economique des sciences sociales, 113:189–230, 1999.
- [10] K. Lindgren. Evolutionary dynamics in game-theoretic models. In Durlauf, Arthur and Lane, editors, The Economy as an Evolving Complex System II, volume XXVII, pages 337–367. SFI Studies in the Sciences of Complexity, 1997.
- [11] K. Lindgren and M. G. Nordahl. Evolutionary dynamics of spatial games. Physica D, 75:292–309, 1994.
- [12] A. Mukherji, V. Rajan, and J. R. Slagle. Robustness of cooperation. Nature, 379:125–126, 1996.
- [13] M. A. Nowak, S. Bonhoeffer, and R. M. May. Spatial games and the maintenance of cooperation. Proc. Natl. Acad. Sci. USA, 91:4877–4881, 1994.
- [14] M. A. Nowak and R. M. May. Evolutionary games and spatial chaos. Nature, 359:826–829, 1992.
- [15] M. A. Nowak and R. M. May. The spatial dilemmas of evolution. Int. Jour. of Bif. and Chaos, 3(1):35–78, 1993.
- [16] A. Watts. A dynamic model of network formation. Vanderbilt University, Mimeo, 1999.
- [17] D. J. Watts and S. H. Strogatz. Collective dynamics of small-world networks. Nature, 393:440–442, 1998.
- [18] J. Weibull. Evolutionary Game Theory. MIT University Press, 1996.
- [19] M. G. Zimmermann, V. M. Eguíluz, M. San Miguel, and A. Spadaro. Cooperation in an Adaptive Network. In Ballot and Weisbuch, editors, Applications of Simulation to Social Sciences, Hermes Science Publications (Paris, France), 2000.