[
Submitted to Phys. Rev. B
The GaAs Equilibrium Crystal Shape from First-Principles
Abstract
Surface energies for different GaAs surface orientations have been calculated as a function of the chemical potential. We use an energy density formalism within the first-principles pseudopotential density-functional approach. The equilibrium crystal shape (ECS) has been derived from the surface energies for the (110), (100), (111), and (1̄1̄1̄) orientations. Under As-rich conditions all four considered surface orientations exist in thermodynamic equilibrium, in agreement with experimental observations. Moreover, our calculations allow us to decide on previous contradictory theoretical values for the surface energies of the (111) and (1̄1̄1̄) facets.
pacs:
PACS numbers: 68.35.Bs, 68.35.Md, 73.20.-r]
I Introduction
The equilibrium crystal shape (ECS) is that shape which, in the limit of infinitely large volume, yields the minimum free energy of a crystal. For a given arbitrary surface orientation and unit cell the atomic reconstruction that yields the lowest surface free energy can be determined. However, it is well known that in general this will not result in a thermodynamically stable situation, because the surface can further lower its energy by faceting on a macroscopic scale. The ECS provides a set of surface orientations that exist in thermodynamic equilibrium. Except for some situations with degenerate surface energies surfaces of any other orientations will facet.
The faceting of GaAs surfaces has been studied experimentally. Whereas Weiss et al. [2] studied the different surface orientations exposed on a round shaped crystal with low-energy electron-diffraction (LEED), Nötzel et al. [3] investigated various planar high-index surfaces with reflection high-energy electron-diffraction (RHEED). Both groups observed for different high-index surface orientations faceting into low-index surfaces. Moreover, surface energies play a major role in the formation of islands during heteroepitaxy. For example, InAs grows on GaAs in the Stranski-Krastanov mode. [4] The surface energy of InAs being lower than that of GaAs, first a uniform wetting-layer forms. During further deposition of InAs three-dimensional islands are formed due to strain relaxation. Recently, these quantum dots have attracted great interest. [4, 5, 6, 7] Besides other quantities like the elastic relaxation energy of the islands, the absolute InAs surface energies of the involved facets which we assume to be similar to those of GaAs enter into the theory of the shape and size of the islands.
Both experimental as well as calculated absolute values of the surface energy as a function of orientation are quite scarce. The surface energy has been measured for the GaAs (110) surface in a fracture experiment.[8] Relative surface energies and the ECS of Si have been determined [9, 10], but to our knowledge no such measurements have been carried through for GaAs. Moreover, it is often difficult to establish whether an observed surface really represents thermodynamic equilibrium. At low temperatures faceting and therefore thermodynamic equilibration may be hindered by insufficient material transport. At high temperatures, kinetics may govern the surface morphologies due to evaporation.
The purpose of this work is to present the absolute values for the surface energy of the GaAs (110), (100), (111), and (1̄1̄1̄) surfaces calculated from first principles, and the ECS constructed from these data. Empirical potentials do not produce reliable surface properties. Ab initio calculations have been carried out by various groups for different surface orientations of GaAs. Qian et al. [11] used an ab initio pseudopotential method to calculate the absolute surface energy of the GaAs (110) surface. They found very good agreement with the experimental cleavage energy. Northrup and Froyen [12], Qian et al. [13], and Ohno [14] determined the (100) reconstruction with lowest energy. The absolute surface energies for these reconstructions were not given, however. Kaxiras et al. [15] calculated energies for GaAs (111) reconstructions relative to the surface energy of the ideal (111) surface. For the (1̄1̄1̄) surface Kaxiras et al. [16] and Northrup et al. [17] calculated relative surface energies for different reconstructions. Based on their results they predicted the (1̄1̄1̄) equilibrium reconstruction.
However, for geometrical reasons it is impossible to derive absolute surface energies for the (111) and (1̄1̄1̄) orientations of GaAs from such total-energy calculations. Chetty and Martin [18, 19] solved this problem by introducing an energy density, which enables the computation of the energies of the top and the bottom surfaces of the slab separately. Having calculated the absolute surface energies for the ideal reference surfaces they transformed the relative surface energies of Kaxiras et al. [15, 16] and Northrup et al. [17] to absolute surface energies. A comparison of these absolute values, however, shows that the two results differ significantly. This difference is not yet understood, and we will come back to it in Section IV below.
We have calculated absolute surface energies for the different orientations directly (i.e., without introducing a reference surface) and consistently with one and the same set of parameters and pseudo-potentials. Before we will detail our results and the ECS of GaAs in Section IV, we will first give an overview of GaAs surface properties in Section II and describe the computational details in Section III.
II Chemical Potential and Surface Reconstruction
The stable surface reconstruction is the one with the lowest surface free energy. In our case the substrate consists of two elements and thus the difference of the number of atoms of the two species enters as another degree of freedom in addition to the atomic geometry. Non-stoichiometric surfaces are considered by allowing the surface to exchange atoms with a reservoir, which is characterized by a chemical potential. The equilibrium is determined by the minimum of the free energy
| (1) |
The surface free energy of the surface area has been calculated for zero temperature and pressure and neglecting zero point vibrations. The chemical potential is the free energy per particle in the reservoir for the species , and denotes the number of particles of the species . The temperature dependence is ignored because the contributions tend to cancel for free energy differences.
In experiment the value of the chemical potential can be varied over a certain interval. This interval is limited by the bulk chemical potentials of the condensed phases of Ga and As [13, 17], corresponding to the two following situations: On the one hand the surface can be in equilibrium with excess Ga-metal, which has the chemical potential , and the GaAs bulk with chemical potential . On the other hand the surface can be in equilibrium with bulk As and, again, the GaAs bulk. Both reservoirs can act as sinks and sources of surface atoms. The upper limit of each chemical potential is determined by the condensed phase of the respective element,
| (2) |
because otherwise the elemental phase would form on the GaAs surface. Furthermore, in thermodynamic equilibrium the sum of chemical potentials of Ga and As must be equal to the bulk energy per GaAs pair,
| (3) | |||||
| (4) |
For the heat of formation we have calculated a value of 0.64 eV using a plane-wave cutoff of 10 Ry which is in good agreement with the experimental value [20] of 0.74 eV. For the bulk calculations we computed the bulk energy of Ga in an orthorhombic structure [13] and the bulk energy of As in a trigonal structure [21].
In this work we give the surface energies in dependence of the As chemical potential. Therefore, we write equations (2) and (4) in the following form
| (5) |
The surface energy is calculated from the total energy ,
| (6) |
The stoichiometry of the surface, , determines the slope of the surface energy versus the chemical potential. A consistent counting method for has to be applied to all orientations. We apply the method of Chetty and Martin [22] which utilizes the bulk symmetries of the crystal. For example, following their counting method the ideal (110) cleavage surface is stoichiometric, i.e. the difference is equal to zero. Thus the surface energy of the (110) cleavage surface is independent of the chemical potential.
When the chemical potential is varied, different reconstructions with different surface stoichiometries become thermodynamically stable. All experimentally observed reconstructions, however, fulfill certain conditions. First of all, GaAs surfaces favor to be semiconducting, as this leads to a low surface energy. Surface bands in the bulk gap and especially surface bands crossing the Fermi-level will lead to a higher surface energy. The electron counting model [23, 24] gives a simple criterion whether a surface can be semiconducting or not. In the bulk the hybridized orbitals of GaAs form bonding and antibonding states. At the surface there are partially filled dangling bonds. Their energies are shown schematically in Fig. 1, they are estimated from the atomic and eigenenergies of either species.
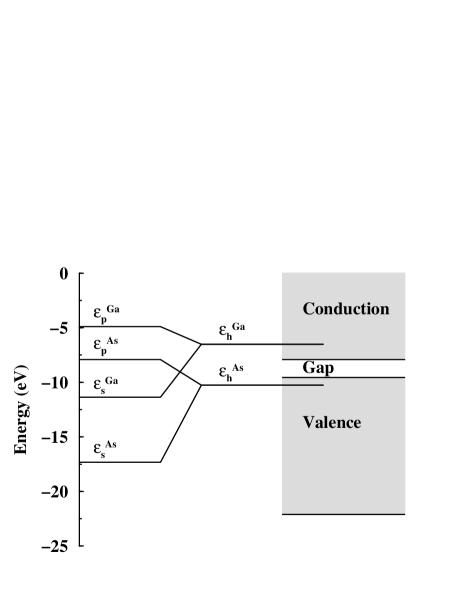
Compared to the dispersion of the conduction and the valence bands, the dangling bond energy of the cation (Ga) falls into the conduction band and therefore it should be empty. The dangling bond energy of the anion (As) lies in the valence band and therefore it should be filled. Thus there has to occur an electron transfer from the Ga to the As dangling bonds. For a low-energy semiconducting surface the dangling bonds in the conduction band have to be empty, exactly filling all the dangling bonds in the valence band. Otherwise the surface becomes metallic and has a higher surface energy. Ga and As surface atoms are added to, or removed from, the ideal bulk-truncated polar surfaces to obtain a low-energy semiconducting surface.
Secondly, the electron transfer from the Ga dangling bonds to the As dangling bonds has consequences for the geometry of the surface reconstructions. The surface Ga atom which has lost an electron favors a like hybridization. Therefore the Ga atom relaxes inwards and forms a more planar configuration. The dangling bond of arsenic is completely filled and the As atom prefers to form bonds with its three orbitals. Therefore the bond angle of the surface As atom is close to 90∘, and the As atom relaxes outwards. These configurations resemble the bond geometry of small molecules like GaH3 and AsH3 and are a general result for surfaces of III-V semiconductors. [25]
III Computational Details
To determine the surface energies we carried out total-energy calculations using density-functional theory.[26, 27] We applied the local-density approximation to the exchange-correlation functional, choosing the parameterization by Perdew and Zunger [28] of Ceperley and Alder’s [29] data for the correlation energy of the homogeneous electron gas. The surfaces were described by periodically repeated slabs. All computations were done with an extended version of the computer code fhi93cp. [30] The program employs ab initio pseudopotentials and a plane-wave basis-set. It was generalized to additionally compute the energy density according to Chetty and Martin. [18]
The slab geometry leads to serious problems when surface energies of zinc-blende structures are to be calculated for arbitrary orientations. To derive the surface energy from a total energy calculation both surfaces of the slab have to be equivalent. Though such slabs can be constructed for the (110) and the (100) orientation, this is impossible for the (111) orientation: The (111) and the (1̄1̄1̄) surfaces of GaAs are inequivalent. This follows from the simple geometric property of the zinc-blende structure that the Ga-As double layers are Ga and As terminated on the top and bottom side of the slab, respectively. Chetty and Martin[18] solved this problem by introducing an energy density. The energy density itself, however, does not bear any physical significance, only the integrals of the energy density over suitable parts of the supercell (e.g., volumes bounded by bulk mirror planes) lead to well-defined, physically meaningful energies. [18] We have checked the accuracy of this approach for our GaAs slabs: Variation of the surface reconstruction on the bottom side of the (100) and (111) slabs results in a negligible change of the surface energy of the surface on the top ( meV/Å2).
Ab initio norm-conserving pseudopotentials were generated with Hamann’s scheme. [31] The cutoff radii for pseudoization have been chosen equal to 0.58 Å, 0.77 Å, and 1.16 Å for the , , and wave-functions of Ga, and equal to 0.61 Å, 0.60 Å, and 1.07 Å for , , and wave-functions of As. The semi-local pseudopotentials were further transformed into fully separable Kleinman-Bylander pseudopotentials [32], with the potential chosen as the local potential. The logarithmic derivatives of the different potentials were examined and various transferability tests [33], e.g. “hardness” tests, were performed. All together the potentials showed good transferability. The structures of the bulk phases of Ga and As are well described by these potentials, the theoretical lattice constants being only slightly smaller than the experimental ones with a relative deviation below 3.5%.
The wave functions were expanded into plane waves [34] with a kinetic energy up to 10 Ry. This leads to a convergence error in the surface energies of less than 3 meV/Å2. The electron density was calculated from special k-point sets [35], their density in reciprocal space being equivalent to 64 k-points in the whole (100) () surface Brillouin-zone.
For the (100), (111), and (1̄1̄1̄) surfaces “pseudo-hydrogen” was used to saturate the bottom surfaces of the slabs. [36] Pseudo-hydrogen denotes a Coulomb-potential with a non-integer core-charge , together with electrons. The Ga and As atoms of these surfaces were fixed at their ideal bulk positions. The Ga terminated surface was saturated with pseudo-hydrogen with an atomic number of . On each dangling bond of a Ga surface atom one pseudo-hydrogen was placed. Similarly, the As terminated surface was saturated with pseudo-hydrogen with an atomic number of 0.75. The saturated surfaces are semiconducting without any surface states in the bulk band-gap. There are two main advantages using this pseudo-hydrogen. First of all, the interaction of both surfaces with each other is in this way minimal. Secondly, the surface atoms which are saturated with the pseudo-hydrogen can be kept fixed at ideal bulk positions. Thus thinner slabs can be used and charge sloshing is suppressed.
For polar surfaces, such as the ideal (111) surface, a difficulty arises due to charge transfer from one side of the slab to the opposite side. This charge transfer is hindered by a semiconducting surface, e.g. the pseudo-hydrogen saturated surface at the bottom of the slab. We estimate the uncertainty due to charge transfer to be smaller than 1.4 meV/Å2 for a polar surface, comparing the surface energies of the pseudo-hydrogen saturated surface derived from two calculations. One is carried through with a semiconducting surface on the top of the slab, the other one with a metallic surface.
We have carried out computations for a large variety of reconstructions of the GaAs (110), (100), (111), and (1̄1̄1̄) surfaces, which have previously been suggested in literature. Starting from some initial geometry, the atom positions in the topmost layers of the slab were relaxed until the forces on the atoms were smaller than 50 meV/Å. The other layers were kept fixed at their ideal bulk positions with a bulk lattice-constant of 5.56 Åwhich had been determined theoretically at the same cutoff energy as the slab calculations and using 384 k-points in the whole Brillouin-zone. This value is 1.4% smaller than the experimental lattice constant[37] neglecting zero point vibrations.
IV Results and Discussion
A (110) Surface
The (110) surface is one of the most extensively studied GaAs surfaces (Ref. [11, 38, 39, 25] and references therein). The (110) plane is the cleavage plane of III-V semiconductors. Containing the same number of cations (Ga) and anions (As) it is intrinsically neutral. The cleavage surface does not reconstruct, only a relaxation of surface atomic positions within the surface unit cell is observed. The charge from the Ga dangling-bond is transfered into the As dangling-bond, which becomes completely filled. The orbitals of both surface atoms rehybridize, and the zigzag chains of Ga and As surface atoms tilt, with the As atom being raised and the Ga atom being lowered. Thereby the Ga surface atom acquires a nearly planar bonding configuration, while the As surface atom relaxes towards a pyramidal configuration with orthogonal bonds.
We have calculated the surface energy of the relaxed cleavage surface shown in Fig. 2(a). It is stoichiometric () and semiconducting.
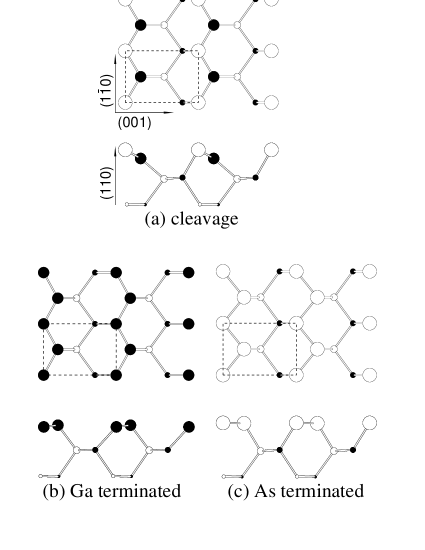
In addition, we considered two other surface structures: The Ga terminated (110) surface is shown in Fig. 2(b). Formally it can be constructed from the cleavage surface by substituting all top-layer As atoms by Ga atoms. This surface has a stoichiometry of per cell, and it fulfills the electron counting criterion. Nevertheless, it is not semiconducting, because the bands of the Ga-Ga surface bonds cross the Fermi-level. The Ga surface atoms do not relax in the same way as the respective Ga and As atoms in the cleavage surface, instead they almost stay in the same plane. Finally, we have calculated the surface energy of the As terminated (110) surface (see Fig. 2(c)). Here the Ga surface atoms have been replaced by As atoms, which yields a surface with a stoichiometry of per surface unit cell. Also this surface fulfills the electron counting criterion, and it is semiconducting. Both As dangling-bonds are completely filled and lie beneath the Fermi-level. Similar to the Ga terminated surface, the As surface atoms do not relax significantly, but stay in the same plane.
For all three (110) surface reconstructions we used the same super cell, with slabs composed of nine atomic layers and a vacuum region with a thickness equivalent to seven atomic layers. The whole surface Brillouin zone was sampled with 48 special k-points. [35]
The calculated surface energies are shown in Fig. 3 for the three surface structures we have considered.

For a large range of the chemical potential the cleavage surface is energetically most favorable. Our result for the surface energy of 52 meV/Å2 is in good agreement with the value of 57eV/Å2 meV which was calculated by Qian et al. [11] using essentially the same ab initio method. Both results compare very well with the experimental surface energy of 54 9 meV/Å2 from fracture experiments by Messmer and Bilello. [8] In As-rich environments we find the As terminated surface to exist in thermodynamical equilibrium, in agreement with Northrup’s calculation.[39] We obtain a value of 45 meV/Å2 for the surface energy in an As-rich environment. Kübler et al. [38] provided experimental evidence for the existence of this structure. Using LEED they observed that the surface relaxation was removed as the As coverage was increased. In contrast to the As terminated surface, we find the Ga terminated surface to be unstable even under the most extreme Ga rich conditions.
B (100) Surface
Among the different orientations the (100) surface is the one used most widely for the growth of opto-electronic devices. The (100) surface is polar, i.e. the planes parallel to the surface consist of either only Ga or only As atoms. As a consequence, the stable surface structure [24] displays various reconstructions which distinctly differ from those found on the (100) faces of the covalent group IV semiconductors. Däweritz et al. [40] have derived a steady state “phase” diagram for the surface reconstruction as a function of growth conditions. In their diagram they point out 14 different reconstructions. To our knowledge, the equilibrium phase diagram of the (100) surface has not yet been determined. However, there are certain reconstructions which are generally observed during and after growth. While heating the surface Biegelsen et al. [41] observed a sequence of phases from the As-rich , to the Ga-rich reconstructions. For each of these surface unit-cells there exists a large variety of possible atomic configurations.
Chadi [42] performed tight binding based total energy minimizations to examine the structure of the and reconstructed surface. For the he suggested two possible atomic configurations with three and two As-dimers ( and , notation according to Northrup et al. [43]) per surface unit-cell. Moreover, he determined the energy difference between the and the related reconstruction to be less than 1 meV/Å2. As the and the are very similar and have only small difference in surface energy, we have not calculated the centered reconstructions and . Ohno[14] and Northrup[12] carried through ab initio calculations of the surface energies. Ohno could exclude various configurations of the and surface unit-cell from being equilibrium structures. Moreover, he concluded that for the reconstruction the phase with three surface dimers is stable, which appeared to be in agreement with the STM observations of Biegelsen et al.[41] However, calculations by Northrup et al. [43] showed that the most stable reconstruction contains two As-dimers in the top layer, which has been confirmed by recent high resolution STM observations. [44] Northrup et al. also investigated the energetics of the and reconstructions. For the reconstruction they found a two-dimer phase to be energetically favorable in agreement with STM investigations.[45] However, a recent analysis of LEED intensities by Cerd\a’a et al.[46] suggests that the top layer consist of three Ga dimers per unit cell. For the reconstruction Northrup et al. considered a three-dimer phase[41] which they found to be stable in certain conditions with respect to the and reconstructions. On the other hand a two-dimer phase was suggested by Sauvage-Simkin et al. [47] on the basis of X-ray scattering experiments, and by Larsen et al. [48] who studied the surface with a number of different experimental techniques.
In our calculations we have considered all atomic configurations with a and a surface unit-cell that were previously investigated by Northrup et al. [12, 43] For the reconstruction we took into account the three-dimer phase [41] and a structure which has two instead of three As-dimers in the top layer. [47, 48] The total energy calculations were performed using supercells containing seven layers of GaAs. The thickness of the vacuum corresponded to five layers GaAs.
In Fig. 4 the geometries of those surface structures are shown that have minimum surface energy within some range of the chemical potential and therefore exist in thermodynamic equilibrium.
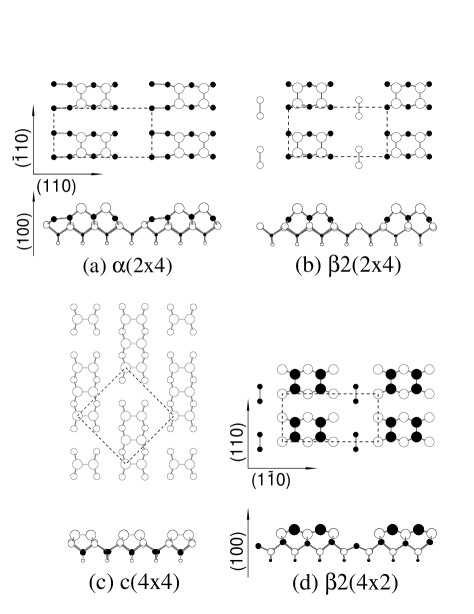
All four structures fulfill the electron counting criterion and are semiconducting, i.e., the anion dangling bonds are filled and the cation dangling bonds are empty. Furthermore the surfaces display Ga-Ga bonds and As-As bonds, both having filled bonding and empty antibonding states. The reconstruction (Fig. 4(a)) is stoichiometric (). In the top layer four As atoms are missing per cell. The surface As atoms form two dimers. The Ga-layer underneath is complete, but differs from the bulk geometry by two Ga-Ga bonds which are formed between the Ga atoms in the region of the missing As dimers. Removing the Ga atoms in the missing dimer region one obtains the structure in Fig. 4(b) with a stoichiometry of per unit cell. The completely As-terminated surface shown in Fig. 4(c) has a stoichiometry of per unit cell. It consists of three As-dimers which are bonded to a complete As-layer beneath. The structure shown in Fig. 4(d) represents the Ga-terminated counterpart of the reconstruction, with Ga atoms exchanged for As atoms and vice versa. Thus the top layer consists of two Ga dimers per cell, and the second layer lacks two As atoms. This results in a stoichiometry of per cell.
Our calculated surface energies of these four phases are shown in Fig. 5 as a function of the chemical potential.

We predict the same sequence of equilibrium surface structures as Northrup and Froyen [12, 43] as a function of increasing As coverage: (42), (24), (24), and c(44). The structure with only two surface As-dimers per unit cell, which we considered in addition to the structures investigated by Northrup and Froyen, turned out to be unstable. Though this structure is more Ga-rich than the c(44) three As-dimer structure shown in Fig. 4(c), even in the Ga-rich environment the two-dimer phase has a surface energy which is 5 meV/Å2 higher than for the three-dimer phase. Due to the lack of absolute values in previous calculations, quantitatively we can only compare energy differences between surfaces with the same stoichiometry. Further comparison is made difficult by the different range of the chemical potential in our versus Northrup and Froyen’s calculation [12, 43]: Their value for the heat of formation is = 0.92 eV, as opposed to our smaller value of = 0.64 eV. Comparing the three dimer phase with the two dimer phase , which both have the same stoichiometry, we find that the two dimer phase has a surface energy lower by 2 meV/Å2. This agrees with the result of Northrup and Froyen who report an energy difference of 3 meV/Å2, and it further confirms the conclusion that the three dimer phase does not exist in equilibrium. On the whole, the agreement with the relative surface energies calculated by Northrup et al. is good. They can be converted to absolute surface energies by shifting them by 65 meV/Å2, which results in a diagram similar to Fig. 5.
All investigated (100) surfaces display similar atomic relaxations which are characterized by the creation of dimers and the rehybridization of threefold coordinated surface atoms. The creation of surface dimers decreases the number of partially occupied dangling bonds, and by rehybridization the surface gains band structure energy. The calculated bond lengths in bulk Ga and As, 2.32 Å and 2.50 Å, respectively, can serve as a first estimate for the respective dimer bond lengths on the GaAs surface. Our calculations yield As-dimer lengths between 2.45 and 2.50 Å for the and surface reconstruction. This is within the range of experimentally deduced values which scatter between 2.2 and 2.9 Å [49, 50, 51] and it is similar to the dimer lengths of 2.53 and 2.55 Å which were determined by Northrup et al. [52] On the reconstructed surface the calculated As-dimer lengths are 2.57 Å for the central dimer and 2.53 Å for the two outer dimers of the three-dimer strings in the surface unit-cell. Using X-ray scattering Sauvage-Simkin et al. [47] determined these bond-lengths as Å and Å. Very recently Xu et al. [53] suggested that the dimers on the c(44) structure should be tilted by . However, as for the reconstructions we find the dimers to be parallel to the surface, in agreement with several previous experiments[41, 47]. Even when starting with an initial configuration with surface dimers tilted by we find the dimers to relax back to the symmetric positions with a residual tilt angle less than . The Ga-Ga dimer bond length is calculated to be 2.4 Å on the reconstruction and 2.5 Å on the structure which agrees with previous ab initio calculations. [52] From a recent LEED investigation of the Ga rich (100) surface Cerd\a’a et al.[46] deduced that the stable reconstructed surface displays three Ga-dimers per unit cell with unusual dimer lengths of 2.13 Å and 3.45 Å. In our calculation, however, this three dimer phase is energetically slightly less favorable than the two dimer phase by 0.8 meV/Å2. Therefore, it should not be stable at least at low temperatures. Furthermore, we found the Ga dimer length to be 2.4 Å and no local minimum for Cerd\a’a’s unusually large dimer length.
The rehybridization of the orbitals located at the threefold coordinated Ga-atoms drives the relaxation towards a preferentially flat Ga-bond configuration. On the Ga terminated structure this leads to a decreased spacing between the Ga top layer and the neighboring As layer which amounts to roughly half of the bulk interlayer spacing. Also on the and surfaces the threefold coordinated Ga atoms which bond to As relax towards the plane of their neighboring As atoms. Together with a slight upward shift of the top layer As atoms this leads to a steepening[14] of the As dimer block. The change of the angle between the bonds of the threefold coordinated As atoms is less pronounced. However, the trend is obvious: except for the structure, we find the As bond-angles to be always smaller than 109.5∘, which is the angle of the ideal tetrahedral coordination. The As bonds on the surface behave differently from those on the other three surfaces because the top-layer As atoms are bonded to a second layer which consist of As instead of Ga. A decrease of the angle between the bonds of all threefold coordinated As atoms would require a change in the As-As bond lengths, which probably costs more energy than would be gained from rehybridization.
C (111) Surface
The polar (111) orientation of GaAs has been studied within density-functional theory by Kaxiras et al. [54, 55, 15], who computed surface energies relative to the ideal unreconstructed surface for various atomic geometries. They found that under As-rich conditions an As trimer geometry yields the lowest surface energy, whereas a Ga vacancy reconstruction is preferred under Ga-rich conditions. Haberern and Pashley [56] and Thornton et al. [57] confirmed this experimentally. Haberern and Pashley interpreted their STM images to show an array of Ga vacancies with a (22) periodicity. Thornton et al. observed both the As triangle model and the Ga vacancy model in STM. Here we concentrate on the following reconstructions of the Ga terminated (111) surface: the As adatom, the As trimer, the Ga vacancy model, and, for comparison but not as a reference system as in previous work, the truncated-bulk geometry.
The ideal (111) surface (see Fig. 6(a)) has a stoichiometry .
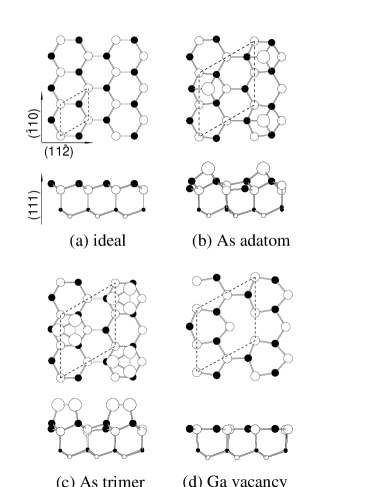
It does not fulfill the electron counting criterion. Each Ga dangling-bond is filled with 3/4 of an electron and therefore the ideal surface has to be metallic. To create a neutral semiconducting surface, following the electron counting criterion one can either add an As surface atom to, or remove a Ga surface atom from, every surface unit cell. Therefore we consider three different reconstructions. First of all, the As adatom model is shown in Fig. 6(b). This reconstruction is stoichiometric. The As adatom binds to the Ga surface atoms. It exhibits a nearly orthogonal bond configuration, while the Ga atom with the empty dangling bond relaxes towards the plane of the As atoms. Secondly, we consider the As trimer model shown in Fig. 6(c). This model has a stoichiometry , it also fulfills the electron counting criterion and it is semiconducting. The three extra As atoms form a trimer with each As atom binding to one Ga atom. The dangling-bonds of the As atoms are completely filled and the dangling-bond of the the Ga atom which is not bonded to As trimer atoms is completely empty. This Ga atom relaxes into the plane of the As atoms of the layer below. Finally, we calculated the Ga vacancy model (see Fig. 6(d)). The removal of one Ga surface atom causes the surface to be stoichiometric. The Ga surface atoms have completely empty dangling-bonds and relax into the plane of the As atoms. The three As atoms surrounding the vacancy have completely filled dangling-bonds.
We used the same super cell for the calculations of the (111) and the (1̄1̄1̄) surfaces. Only the bulk-truncated surface was calculated within a surface unit cell, else always a unit cell was used. The slab consisted of five (111) double layers. The vacuum region had a thickness equivalent to four (111) double layers. The whole Brillouin zone of the surface unit cell was sampled with 16 special k-points, corresponding to 64 k-points in the Brillouin zone of the cell. Absolute surface energies of the (111) reconstructions were determined using the energy density formalism. The results are shown in Fig. 7.

The Ga vacancy model is the most favorable reconstruction for a large range of the chemical potential from a Ga-rich to an As-rich environment. Only in very As-rich environments the As trimer model has a lower energy. The Ga vacancy model has a surface energy of 54 meV/Å2, whereas, the As trimer model has a surface energy of 51 meV/Å2 in As-rich environment at . The Ga vacancy reconstruction was observed experimentally by Haberern and Pashley [56] and Tong et al. [58] Thornton et al. additionally observed the As trimer reconstruction.
Two other groups have performed similar ab initio calculations. Using their energy density formalism, Chetty and Martin[19] derived a value of 131 meV/Å2 for the surface energy of the ideal (111) surface in a Ga-rich environment, which is much larger than our value of 93 meV/Å2. Secondly, we can compare our results to the relative surface energies of Kaxiras et al.[55, 16] They arrived at the same qualitative conclusions. However, quantitatively their relative surface energies are not easily comparable to ours because they used As4 gas to define the As-rich environment. Therefore they obtained a larger interval for the chemical potential. We derive for the surface energy difference of the As adatom and Ga vacancy structure a value of 13 meV/Å2, whereas Kaxiras et al. calculate a much larger difference of 47 meV/Å2. Using their own result for the ideal surface, Chetty and Martin transformed the relative surface energies of Kaxiras et al. to absolute surface energies. In comparison to our results, all these surface energies contain the same shift towards higher energy as the ideal surface mentioned above. We will discuss this difference below and explain, why we believe our results to be accurate.
Tong et al. [58] performed a LEED analysis for the geometry of the Ga vacancy reconstruction. Their geometry data compare very well with the theoretical data of Chadi [59], Kaxiras et al. [55] and ours. For the Ga vacancy reconstruction we find an average bond angle of the -bonded Ga surface atom of 119.8∘ in agreement with Tong et al. The bond angles of the -bonded As atom of 87.0∘ and 100.6∘ average to 91.5 ∘ which again compare very well with the value of 92.9∘ by Tong et al. The bonds of the -bonded As atom are strained by -1.6% and 2.6% with respect to the GaAs bulk bonds. Tong et al. measured a value -1.3% and 1.9%, respectively.
Furthermore, for the As trimer reconstruction we compare our geometry data to theoretical data of Kaxiras et al. [55] The threefold-coordinated As adatoms form bond angles to the neighboring As adatoms of 60∘ due to symmetry reasons. The bond angle of the As adatom to the next Ga atom is 106.2∘. Therefore we get an average bond angle of 90.8∘ which is in good agreement with the 91.7∘ of Kaxiras et al. The surface Ga-As bonds are strained by 1.4 %, whereas Kaxiras et al. find the same bond length as in the bulk. The As-As bonds have a bond length of 2.44 Å, 2.4 % shorter than that in As bulk. The Ga surface atom which is not bond to an As adatom relaxes into the plane of the As atoms with a bond angle of 118.4∘ and a bond length which is 2.6 % shorter than in GaAs bulk. These values are slightly larger than the 114.7∘ and 1.0 % reported by Kaxiras et al.
D (1̄1̄1̄) Surface
The polar GaAs (1̄1̄1̄) surface differs from the (111) surface, as the bulk-truncated (1̄1̄1̄) surface is terminated by As atoms, while the (111) surface is Ga terminated. At first sight the (1̄1̄1̄) surfaces might seem to be still analogous to the (111) surfaces, only that the Ga and As atoms have to be exchanged. However, this analogy is not useful, because As and Ga have different electronic properties, and therefore the (111) and (1̄1̄1̄) surfaces do not exhibit equivalent reconstructions. Stoichiometric (1̄1̄1̄) surfaces are gained by adding a Ga atom per surface unit cell to the bulk-truncated surface or by removing an As surface atom.
Kaxiras et al. [16] calculated the relative surface energy for various reconstructions. Biegelsen et al. [17] studied the (111) surface both experimentally and theoretically. Using STM they observed an As trimer reconstruction for As-rich environments. A reconstruction which is dominated by two-layer hexagonal rings was identified for Ga-rich environments.
Due to the large unit cell the reconstruction is computationally quite expensive, and in this work we thus only consider reconstructions. First of all, for comparison, we calculate the surface energy of the ideal (i.e., relaxed bulk-truncated) surface shown in Fig. 8(a).
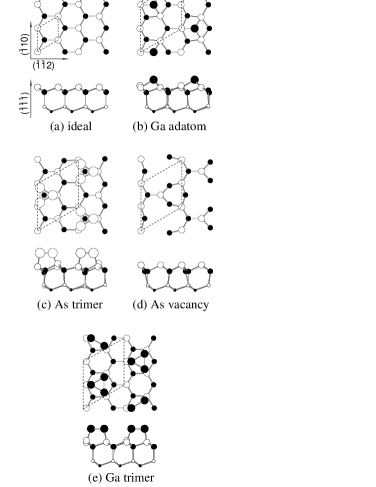
This surface is not stoichiometric . The dangling-bond of each As surface atom is filled with 5/4 of an electron. Therefore the surface is metallic. Secondly, the Ga adatom model shown in Fig. 8(b) was considered. Through adding of an additional Ga surface atom the surface has become stoichiometric and semiconducting. The dangling-bond of the Ga adatom is completely empty, whereas the dangling-bond of the As atom which is not bond to the Ga adatom is completely filled. Furthermore, we also consider an As trimer model (see Fig. 8(c)). In contrast to the (111) surface the As trimer is bond to As surface atoms. This reconstruction has a stoichiometry of per surface unit cell. Each As surface atom has a completely filled dangling-bond. Therefore, the surface is semiconducting. Furthermore, we calculate the surface energy for the As vacancy model which is shown in Fig. 8(d). The removal of the As surface atom causes the surface to be stoichiometric. The three neighboring Ga atoms have completely empty dangling-bonds. The surface fulfills the electron counting criterion and is semiconducting. Finally, we calculate the Ga trimer model (see Fig. 8(e)) to compare with Kaxiras et al. [16] and Northrup et al. [17] This surface model has a stoichiometry of per surface unit cell and also fulfills the electron counting criterion. However, it is metallic for the same reason as the Ga terminated (110) surface.
The calculations for the (1̄1̄1̄) surface were carried out with the same parameters and supercell as those for the (111) surface outlined in the previous section. The results are shown in Fig. 9.

For As-rich environments we find that the As trimer model is the most favorable reconstruction, as observed experimentally by STM and confirmed by previous ab initio calculations.[17] This reconstruction has a very low surface energy of 43 meV/Å2. In a Ga-rich environment the Ga adatom reconstruction has the lowest energy (69 meV/Å2) among all the structures we calculated. The reconstruction found experimentally was not included in our approach. However, as suggested by Biegelsen et al. our present data can be used to restrict the range of possible values for the surface energy of the reconstruction consistent with observation: It has to be smaller than the surface-energy of the Ga adatom model on the one hand, and it has to be larger than the minimum energy of the As-trimer surface (plus a small correction of meV/Å2 to account for the non-stoichiometry of the reconstruction) on the other hand. Therefore, we conclude that energy of the reconstruction is in the range between 40 and 69 meV/Å2. Considering also the energetical competition with facets of other orientations, even a slightly more stringent condition can be deduced: For the (1̄1̄1̄) surface in a Ga-rich environment to be stable against faceting into {110} surfaces, its surface energy has to be less than 63 meV/Å2.
In comparison to the relative surface energies calculated by Kaxiras et al. [16] our energy difference between the As vacancy and the Ga adatom structure of 2 meV/Å2 is only slightly smaller than their value of 6 meV/Å2. However, they state that for the Ga-rich environment the Ga trimer structure is 24 meV/Å2 more favorable than the Ga adatom structure. In contrast, we agree with Northrup et al. [17] that the Ga trimer is energetically quite unfavorable. It has a 29 meV/Å2 higher surface energy than the Ga adatom. Also the other relative surface energies compare quite well with the already mentioned calculations of Northrup et al. [17] although they derived a larger heat of formation (0.92 eV as opposed to our value of 0.64 eV). Relative to the Ga adatom our surface energies of the As trimer are about 10 meV/Å2 larger than theirs. Also, they find a slightly larger energetic separation between the As vacancy and Ga adatom structures. Their value for this energy difference is 6 meV/Å2, whereas our value is 2 meV/Å2. However, these differences are small and do not affect the physical conclusions. Chetty and Martin derived the absolute surface energies using their result for the ideal (1̄1̄1̄) surface and the relative surface energies of Kaxiras et al. and Northrup et al. In contrast to the (111) their value of 69 meV/Å2 for the ideal (1̄1̄1̄) surface in the Ga-rich environment is much smaller than ours of 97 meV/Å2. Therefore, this time in comparison to our data the results all contain the same shift to lower surface energies as the ideal surface. However, the sum of the (111) and (1̄1̄1̄) surface energies from Chetty and Martin is close to ours. Therefore it is the splitting of the slab total energy into contributions from the (111) and the (1̄1̄1̄) side that comes out differently. In our calculations both sides are energetically similar which seems to be plausible in view of the fact that the flat (i.e., not faceted) surfaces have been observed experimentally.
With respect to the calculated geometry we find that the As-As bond length in the trimer is 2.46 Å, 1.6 % shorter than in bulk As. The As trimer atoms each bind to an As atom 2.30 Å beneath the As trimer plane in agreement with Northrup et al. [17] The remaining As atom which is not bond to the trimer relaxes outwards and is 1.74 Å below the trimer plane. This compares reasonably well with the slightly larger value of 1.89 Å by Northrup et al. For the two Ga surface models the separation of the adatom or trimer plane and the closest As (rest atom) plane amounts to 0.98 Å for the Ga adatom model, and 1.98 Å for the Ga trimer model. Northrup et al. derived values of 0.98 Å and 1.90 Å.
E Equilibrium Crystal Shape (ECS)
As opposed to liquids, crystals have non-trivial equilibrium shapes because the surface energy depends on the orientation of the surface relative to the crystallographic axes of the bulk. Once is known, the ECS is determined by the Wulff construction, [60, 61] which is equivalent to solving
| (7) |
Here denotes the radius of the crystal shape in the direction . When the surface energy is drawn as polar plot, the ECS is given by the interior envelope of the family of planes perpendicular to passing through the ends of the vectors . Under the assumption that only the (110), (100), (111), and (1̄1̄1̄) facets exist, we construct the ECS from the calculated surface energies of these facets. Thus there may exist additional thermodynamically stable facets that are missing on our ECS. To be sure to construct the complete shape one would have to calculate the surface energy for every orientation. However, from experiments it is known that the low Miller-indices surface orientations we consider are likely to be the energetically most favorable ones.
As the GaAs surface energies depend on the chemical environment, the ECS becomes a function of the chemical potential. In Fig. 10 the ECS is shown for an As-rich environment and zero temperature.
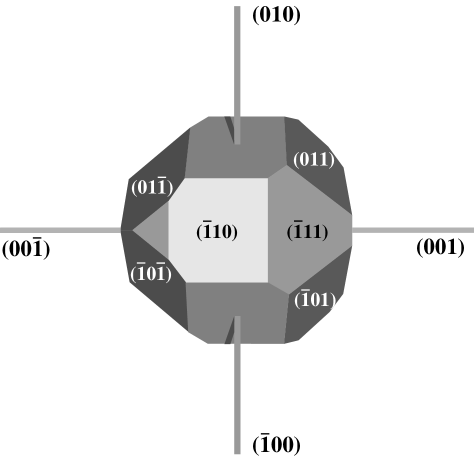
The different facets have been marked in the Figure and the ECS reflects the symmetry of bulk GaAs. To investigate the dependence of the ECS on the chemical potential we will focus on the cross-section of the ECS with a (11̄0) plane through the origin. This cross-section includes the complete information from all four calculated surfaces, because they all possess surface normals within this plane. The ECS is shown for three different chemical environments in Fig. 11.
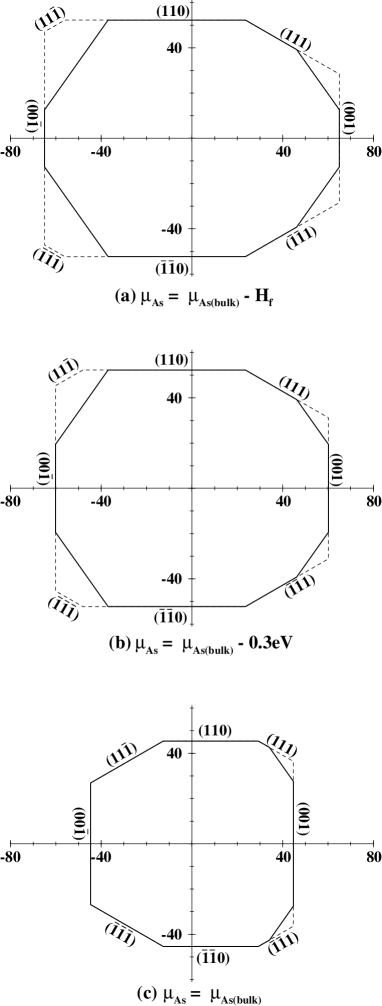
Note that in a Ga-rich environment the (1̄1̄1̄) reconstruction would be energetically more favorable than the (1̄1̄1̄)(22) Ga-adatom reconstruction used for the construction of the ECS at this chemical potential, i.e., the experimental (1̄1̄1̄) facet appears somewhat closer to the origin. For an As-rich environment we find that all four considered surface orientations exist in thermodynamic equilibrium. Furthermore, the (111) surface exists within the full range of accessible chemical potentials. This is in contrast to the result Chetty and Martin [19] derived from the work of Kaxiras et al. [15]: They stated that the (111) surface has a high energy and thus it should not exist as a thermodynamic equilibrium facet. However, experimental work of Weiss et al. [2] using a cylindrical shaped sample indicates that between the (110) and (111) orientation all surfaces facet into (110) and (111) orientations. The superstructure of the (111) surface has been observed on these faceted surfaces. If the (111) orientation of GaAs were instable, the appearance of facets other than (111) on the cylindrical crystal were to be expected.
In Fig. 11 one can see that the ECS becomes smaller for As-rich environments. The As terminated reconstructions have surface energies about 20 % smaller than those found in Ga-rich environments, which are mostly stoichiometric like the Ga vacancy. In contrast to the surface reconstructions found for As-rich environments no similar Ga terminated reconstructions are observed. Another remarkable feature of the ECS is that the surface energies do not vary very much with the orientation. For Ga-rich environments they vary by about , whereas for As-rich environments they vary only by .
Our calculated ECS imposes restrictions on the surface energies of other surface orientations: When it has been proven experimentally that a facet exists in thermodynamic equilibrium, one can derive a lower and an upper limit for its surface energy. The limits are given by the surface energy of the neighboring facets on our ECS together with appropriate geometry factors. They follow from the conditions that (a) the surface energy has to be sufficiently small, so that the surface does not facet into {110}, {100}, {111}, and {1̄1̄1̄} orientations, and (b) that the surface energy is not so small that neighboring facets are cut off by this plane and thus vanish from the ECS. In a similar way the Wulff construction yields a lower limit for the surface energy of any facet that does not exist in thermodynamic equilibrium.
Recently the shape of large three-dimensional InAs islands (diameter 2000 Å) grown by MOVPE on a GaAs(100) substrate has been observed by E. Steimetz et al. [62] These islands are presumably relaxed, the misfit of the lattice constants being compensated by a dislocation network at the InAs-GaAs interface. Thus the facets displayed on these islands should be identical to the facets on the ECS of InAs. In fact, the observed shapes are compatible with an ECS like that of GaAs shown in Fig. 10, with {110}, {100}, {111}, and {1̄1̄1̄} facets being clearly discernible. Due to the similarity between InAs and GaAs we take this as another confirmation of our results as opposed to those of Chetty and Martin. [19]
V Summary and Conclusion
The GaAs surface energies of different orientations have been calculated consistently with one and the same parameters and pseudo-potentials. The surface energies of the (110), (100), (111) and (1̄1̄1̄) surfaces are given in dependence of the chemical potentials.
For the (111) and (1̄1̄1̄) surfaces we find a large difference to previous results of Chetty and Martin. [19] They derived a difference of about 62 meV/Å2 between the surface energies of the ideal (111) and (1̄1̄1̄) surfaces, whereas we calculate a difference of about meV/Å2. Consequently the absolute surface energies calculated by Chetty and Martin using data of Kaxiras et al. [15, 16] and Northrup et al. [17] contain the above difference of 66 meV/Å2. This is due to a different splitting of the slab energy into contributions from the (111) and (1̄1̄1̄) surfaces, as Chetty and Martin’s and our sum of the (111) and (1̄1̄1̄) surface energies are essentially equal. Obtaining high surface energies for the (111) surfaces Chetty and Martin have to conclude that the (111) facet should be unfavorable and not exist in thermodynamic equilibrium. In contrast our surface energies for the (111) surface are lower and therefore we conclude that it exists in thermodynamic equilibrium which appears to be in agreement with experimental observations.
As already stated by Chetty and Martin [19] there are significant differences between the results of Kaxiras et al. and Northrup et al. for the (1̄1̄1̄) surface: Kaxiras et al. find the Ga trimer structure to be energetically favorable in Ga-rich environments, whereas we agree with Northrup et al. and find it energetically unfavorable. This is also confirmed by experiment.
Having calculated the absolute surface energies for different orientations we are in the position to construct the ECS of GaAs. We have to keep in mind, however, that it is implicitly assumed that only the (110), (100), (111) and (1̄1̄1̄) surfaces exist in equilibrium. For a more refined discussion of faceting further calculations also for higher-index surfaces would have to be performed. From our ECS we conclude that in As-rich environment all four orientations exist in thermodynamic equilibrium. For a given chemical potential the variation of the surface energy with orientation is small and less than . Our ECS of GaAs gives indication for the ECS of InAs or other III-V semiconductors which show similar surface reconstructions.
VI Acknowledgments
We thank E. Steimetz for helpful discussion and a copy of Ref. [62] prior to publication. This work was supported in part by the Sfb 296 of the Deutsche Forschungsgemeinschaft.
REFERENCES
-
[1]
Present Address: Department of Physics,
Massachusetts Institute of Technology,
Cambridge, Massachusetts 02139.
Electronic Address: moll@mit.edu - [2] W. Weiss, W. Ranke, D. Schmeisser, and W. Göpel, Surf. Sci. 221, 91 (1989).
- [3] R. Nötzel, L. Däweritz, and K. Ploog, Phys. Rev. B 46, 4736 (1992).
- [4] D. Leonard, M. Krishnamurthy, C. M. Reaves, S. P. Denbaars, and P. M. Petroff, Appl. Phys. Lett. 63, 3203 (1993).
- [5] J. M. Moison, F. Houzay, F. Barthe, L. Leprince, E. Andreè, and . Vatel, Appl. Phys. Lett. 64, 196 (1994).
- [6] M. Grundmann, J. Christen, N. N. Ledentsov, J. Böhrer, D. Bimberg, S. S. Ruvimov, P. Werner, U. Richter, U. Gösele, J. Heydenreich, V. Ustinov, A. Egorov, A. Zhukov, P. Kop’ev, and Z. Alferov, Phys. Rev. Lett. 74, 4043 (1995).
- [7] V. A. Shchukin, N. N. Ledentsov, P. S. Kop’ev, and D. Bimberg, Phys. Rev. Lett. 75, 2968 (1995).
- [8] C. Messmer and J. C. Bilello, J. Appl. Phys. 52, 4623 (1981).
- [9] D. J. Eaglesham, A. E. White, L. C. Feldman, N. Moriya, and D. C. Jacobson, Phys. Rev. Lett. 70, 1643 (1993).
- [10] J. M. Bermond, J. J. Métois, X. Egéa, and F. Floret, Surf. Sci. 330, 48 (1995).
- [11] G.-X. Qian, R. M. Martin, and D. J. Chadi, Phys. Rev. B 37, 1303 (1988).
- [12] J. E. Northrup and S. Froyen, Phys. Rev. Lett. 71, 2276 (1993).
- [13] G.-X. Qian, R. M. Martin, and D. J. Chadi, Phys. Rev. B 38, 7649 (1988).
- [14] T. Ohno, Phys. Rev. Lett. 70, 631 (1993).
- [15] E. Kaxiras, Y. Bar-Yam, J. D. Joannopoulos, and K. C. Pandey, Phys. Rev. B 35, 9625 (1987).
- [16] E. Kaxiras, Y. Bar-Yam, J. D. Joannopoulos, and K. C. Pandey, Phys. Rev. B 35, 9636 (1987).
- [17] D. K. Biegelsen, R. D. Bringans, J. E. Northrup, and L.-E. Swartz, Phys. Rev. Lett. 65, 452 (1990).
- [18] N. Chetty and R. M. Martin, Phys. Rev. B 45, 6074 (1992).
- [19] N. Chetty and R. M. Martin, Phys. Rev. B 45, 6089 (1992).
- [20] CRC Handbook of Chemistry and Physics, 67 ed., edited by R. C. West (CRC, Boca Raton, FL, 1986).
- [21] R. J. Needs, R. M. Martin, and O. H. Nielsen, Phys. Rev. B 33, 3778 (1986).
- [22] N. Chetty and R. M. Martin, Phys. Rev. B 44, 5568 (1991).
- [23] W. A. Harrison, J. Vac. Sci. Technol. 16, 1492 (1979).
- [24] M. D. Pashley, Phys. Rev. B 40, 10481 (1989).
- [25] J. L. A. Alves, J. Hebenstreit, and M. Scheffler, Phys. Rev. B 44, 6188 (1991).
- [26] P. Hohenberg and W. Kohn, Phys. Rev. 136, B864 (1964).
- [27] W. Kohn and L. J. Sham, Phys. Rev. 140, A 1133 (1965).
- [28] J. P. Perdew and A. Zunger, Phys. Rev. B 23, 5048 (1981).
- [29] D. M. Ceperley and B. J. Alder, Phys. Rev. Lett. 45, 566 (1980).
- [30] R. Stumpf and M. Scheffler, Comput. Phys. Commun. 79, 447 (1994).
- [31] D. R. Hamann, Phys. Rev. B 40, 2980 (1989).
- [32] L. Kleinman and D. M. Bylander, Phys. Rev. Lett. 48, 1425 (1982).
- [33] X. Gonze, R. Stumpf, and M. Scheffler, Phys. Rev. B 44, 8503 (1991).
- [34] J. Ihm, A. Zunger, and M. L. Cohen, J. Phys. C 12, 4409 (1979).
- [35] H. J. Monkhorst and J. D. Pack, Phys. Rev. B 13, 5188 (1976).
- [36] K. Shiraishi, J. Phys. Soc. Jap. 59, 3455 (1990).
- [37] Landolt-Börnstein, edited by K.-H. Hellwege (Springer-Verlag, Berlin, 1982), Vol. III/17a.
- [38] B. Kübler, W. Ranke, and K. Jacobi, Surf. Sci. 92, 519 (1980).
- [39] J. E. Northrup, Phys. Rev. B 44, 1349 (1991).
- [40] L. Däweritz and R. Hey, Surf. Sci. 236, 15 (1990).
- [41] D. K. Biegelsen, R. D. Bringans, J. E. Northrup, and L.-E. Schwartz, Phys. Rev. B 41, 5701 (1990).
- [42] D. J. Chadi, J. Vac. Sci. Technol. A 5, 834 (1987).
- [43] J. E. Northrup and S. Froyen, Phys. Rev. B 50, 2015 (1994).
- [44] T. Hashizume, Q. K. Xue, J. Zhou, A. Ichimiya, and T. Sakurai, Phys. Rev. Lett. 73, 2208 (1994).
- [45] Q. Xue, T. Hashizume, J. M. Zhou, T. Sakata, T. Ohno, and T. Sakurai, Phys. Rev. Lett. 74, 3177 (1995).
- [46] J. Cerd\a’a, F. J. Palomares, and F. Soria, Phys. Rev. Lett. 75, 655 (1995).
- [47] M. Sauvage-Simkin, R. Pinchaux, J. Massies, P. Calverie, N. Jedrecy, J. Bonnet, and I. K. Robinson, Phys. Rev. Lett. 62, 563 (62).
- [48] P. K. Larsen, J. H. Neave, J. F. van der Veen, P. J. Dobson, and B. A. Joyce, Phys. Rev. B 27, 4966 (1983).
- [49] S. A. Chambers, Surf. Sci. 261, 48 (1992).
- [50] H. Xu, T. Hashizume, and T. Sakurai, Jpn. J. Appl. Phys. 32, 1511 (1993).
- [51] H. Li and S. Y. Tong, Surf. Sci. 282, 380 (1993).
- [52] J. E. Northrup and S. Froyen, Mat. Sci. Eng. B 2, 81 (1995).
- [53] C. Xu, J. S. Burnham, R. M. B. S. H. Gross, and N. Winograd, Phys. Rev. B 52, 5172 (1995).
- [54] E. Kaxiras, Y. Bar-Yam, J. D. Joannopoulos, and K. C. Pandey, Phys. Rev. B 33, 4406 (1986).
- [55] E. Kaxiras, K. C. Pandey, Y. Bar-Yam, and J. D. Joannopoulos, Phys. Rev. Lett. 56, 2819 (1986).
- [56] K. W. Haberern and M. D. Pashley, Phys. Rev. B 41, 3226 (1990).
- [57] J. M. C. Thornton, P. Weightman, D. A. Woolf, and C. Dunscombe, in Proceedings of the Twenty-Second International Conference on the Physics of Semiconductors., edited by D. J. Lockwood (World Scientific, Singapore, 1995), p. 471.
- [58] S. Y. Tong, G. Xu, and W. N. Mei, Phys. Rev. Lett. 52, 1693 (1984).
- [59] D. J. Chadi, Phys. Rev. Lett. 52, 1911 (1984).
- [60] G. Wulff, Z. Kristallogr. 34, 449 (1901).
- [61] M. Wortis, in Chemistry and Physics of Solid Surfaces VII, edited by R. Vanselow and R. F. Howe (Springer-Verlag, Berlin, 1988).
- [62] E. Steimetz, F. Schienle, and W. Richter (unpublished).