DESY-99-038
NIKHEF-99-011
A QCD analysis of HERA and fixed target structure function data
Abstract
The parton momentum density distributions of the proton are determined from a next-to-leading order QCD analysis of structure functions measured at HERA and by fixed target experiments. Also included are data on the difference of the up and down anti-quark distributions. The uncertainties in the parton densities, structure functions and related cross sections are estimated from the experimental errors and those on the input parameters of the fit. Several QCD predictions based on the parton densities obtained from this analysis are calculated and compared to data.
1 Introduction
Parton momentum density distributions are important ingredients in the calculation of high energy hadron-hadron and lepton-hadron scattering cross sections. In these calculations the cross sections are written as a convolution of the parton densities and the elementary cross sections for parton-parton or lepton-parton scattering. Whereas the latter can be perturbatively calculated in the framework of the Standard Model, the parton densities are non-perturbative and cannot, at present, be calculated from theory; they are obtained from fits to a body of high energy scattering data. In these fits measurements of deep inelastic lepton-hadron scattering play an important rôle because in this process the hadron structure is directly probed by the structure-less incident lepton.
Standard sets of parton density distributions have been published by, among others, the groups CTEQ, MRS and GRV, see [1, 2, 3] for their most recent results. These parton distribution sets are widely used as an input to cross section calculations. However, estimates of the uncertainties on the parton densities are not provided. These uncertainties tend to dominate the errors on the predicted cross sections and are an increasingly important limitation on the interpretation of hadron-hadron or lepton-hadron collider data.
For instance with the integrated luminosity of about 50 pb-1 collected at HERA during the years 1994–1997 a new kinematic domain of large and becomes accessible for the study of deep inelastic scattering in collisions. Here with the four-momentum transfer from the incident electron to the proton and with the four-momentum of the proton. Measurements by ZEUS of the neutral current (NC) and charged current (CC) Born cross sections have recently been published [4, 5] (see [6] for recent NC and CC cross section measurements by H1). These data extend the largest measured value of from about 5000 GeV2 [7] to – GeV2. Standard Model predictions for the cross sections calculated with the parton distribution set CTEQ4 [8] are in good agreement with the NC results but fall below the ZEUS CC measurements at large and . This could be an indication of new physics beyond the Standard Model but might also be due to an imperfect knowledge of the parton densities in this kinematic region. For instance in [9] it is shown that a modification of the CTEQ4 down quark density yields predictions in agreement with the CC data.
To investigate these issues we have performed a next-to-leading order (NLO) QCD analysis of deep inelastic structure function data from HERA and fixed target experiments. The HERA data extend down to low values of where charm mass effects must be taken into account. For this we could have used, since it is implemented in the QCD evolution code, the heavy quark three flavor scheme of [10]. However, the CC cross sections and the Z-exchange contribution to the NC cross sections cannot be calculated in this scheme. Because we wish to compare the QCD predictions to the ZEUS NC and CC data at large we do not use the heavy quark scheme and assume, instead, that the charmed and bottom quarks are massless. As a consequence, we have restricted the kinematic domain of the analysis to larger values of where the massless approach is expected to yield reasonable QCD extrapolations to large , see Section 6.
In this paper we present the results of the QCD analysis including estimates of the uncertainties in the parton densities, the structure functions and the Standard Model predictions for the NC and CC cross sections. The results of this analysis, including the full error information, are available from the web site given in Section 7.
2 QCD fit
The data used in the fit were the proton structure function () measured at HERA by ZEUS [7] and H1 [11] together with the proton and deuteron () structure functions from fixed target experiments [12, 13, 14, 15]. Also included in the fit were measurements of the ratio by NMC [16] and neutrino data on from CCFR [17]. Recent results from E866 [18] on di-muon (Drell-Yan) production cross sections in and scattering yields information on the difference between the down and up anti-quark densities. Because a NLO calculation of the Drell-Yan cross sections is not incorporated in the present analysis we have, instead, constrained this difference by using their results on as an input to the fit.
Corrections for nuclear effects were applied to , and . For this purpose the structure function (per nucleon) of nucleus was parameterized as
| (1) |
where is the structure function of a free nucleon (taken to be the average of proton and neutron) as predicted by the QCD fit, is a parameterization of the ratio taken from the literature (see below) and is a parameter which controls the size of the nuclear correction applied.
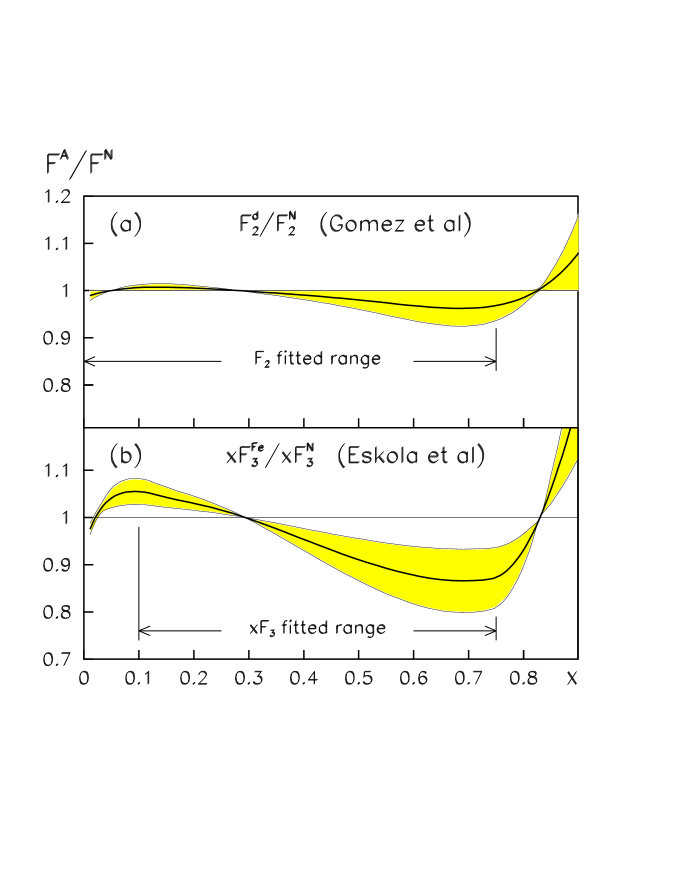
In Fig. 1a we plot the ratio versus as parameterized by Gomez et al [19]. We allow for an error of 100% on this nuclear correction as indicated by the shaded band in the figure, that is, we set . The nuclear correction applied to is shown in Fig. 1b. For this we took the parameterization of Eskola et al [20] of the nuclear correction for iron on the valence quark density . Here we allowed for an error of 50% i.e. (shaded band in Fig. 1b).
The QCD predictions for the structure functions were obtained by solving the DGLAP evolution equations [21] in NLO in the scheme [22]. These equations yield the quark and gluon momentum densities (and thus the structure functions) at all values of provided they are given as functions of at some input scale . Also required is an input value for the strong coupling constant which, in this analysis, was set to . With a charm (bottom) threshold of (5) GeV in the evolution of this corresponds to values of the QCD scale parameter MeV for flavors.
As already mentioned in the introduction, we use in this analysis the light quark variable flavor number scheme where all quarks are assumed to be massless and where charm and bottom are dynamically generated above some given thresholds and . These thresholds were set to 4 () and 30 GeV2 respectively.
The input scale of the DGLAP evolutions was chosen to be GeV2 and the gluon distribution (), the sea quark distribution (), the difference of down and up anti-quarks () and the valence distributions (, ) were parameterized as
| (2) | |||||
In the fit, we assume that the strange quark distribution is a given fraction of the sea at the scale GeV2, in accordance with the measurements of CCFR [23].
The parameters , and were fixed by the momentum sum rule and the valence quark counting rules:
where denotes the singlet quark density (sum of all quarks and anti-quarks). There are thus 16 free parameters describing the input parton densities.
From the evolved parton densities the relevant structure functions were calculated in NLO. In the calculations both the renormalization and the factorization scale were set equal to . Higher twist contributions to and were taken into account phenomenologically by describing these structure functions as
| (3) |
where obeys the QCD evolution equations. The function was parameterized as a fourth degree polynomial in with five free parameters:
| (4) |
We assume in this analysis that is the same for the proton and the deuteron [24] which implies that the ratio is not affected by higher twist contributions. We did not correct the data for target mass effects [25] so that these effectively are included in . No higher twist, target mass or slow rescaling corrections [25, 26] were applied to .
The normalizations of the ZEUS, H1 and NMC data sets were kept fixed to unity whereas those of E665, BCDMS, SLAC and CCFR were allowed to float within the quoted normalization uncertainties (7 parameters). There are thus in total 28 free parameters in the fit.
The following cuts were made on the data:
-
1.
Discard data with . This cut was introduced because the massless quark scheme used in this analysis is not suitable to describe low structure functions where the contribution from charm is large. For the data the cut was raised to to reduce the sensitivity to nuclear corrections at low ;
-
2.
Discard data with GeV2. This cut reduces the sensitivity to QCD corrections beyond NLO. Because the QCD evolution of the ratio is small, we apply a lower cut of 1 GeV2 to these data;
-
3.
Discard data with GeV2 ( is the mass of the proton) to reduce the sensitivity to higher twist contributions and target mass effects which become important at high and low .
3 Error propagation
In this section we describe how the errors are defined in this analysis. The calculation of the statistical and systematic errors is based on linear error propagation. This implies that asymmetries in the input errors, if any, are ignored and that the output statistical and systematic errors are, per definition, symmetric.
In this analysis we have incorporated the effects of the point to point correlated experimental systematic errors in the model prediction for the structure functions. This model prediction, calculated at the kinematic point (), is defined as
| (5) |
where is the QCD prediction and is the relative systematic error on data point stemming from source .111If the systematic error is asymmetric the average of the upper and lower error is taken. In Eq. (5) denotes the set of parameters describing the input parton densities and is a set of systematic parameters. Notice that the experiments, by giving central values and one standard deviation systematic errors, essentially provide ‘measurements’ of these systematic parameters: .
Assuming that the are uncorrelated and Gaussian distributed with zero mean and unit variance, the can be written as
| (6) |
where is the measured structure function and is the statistical error with the point to point uncorrelated systematic errors added in quadrature.
To propagate the statistical and systematic errors two Hessian matrices M and C were evaluated (with Minuit) at the minimum :
| (7) |
The statistical covariance matrix of the fitted parameters is, as usual, given by
| (8) |
A systematic covariance matrix of the fitted parameters can be defined as [29]
| (9) |
The error on any function of the parameters (parton densities, structure functions, cross sections etc.) is then calculated using the standard formula for error propagation
| (10) |
where V is the statistical, the systematic, or if the total error is to be calculated, the sum of both covariance matrices.
The sources which contribute to the error on the results of the fit are:
-
1.
The statistical and systematic errors on the data. These were propagated as described above. The following systematic errors were taken into account in this analysis: for the ZEUS data we included the 6 contributions as parameterized in [7]. The SLAC and BCDMS systematic errors were taken to be those used in the QCD analysis of [24]. For the other data sets we included the systematic uncertainties as published (for H1 and E665 only the normalization error and the total systematic error are available; the CCFR systematic errors are given in [30]). Apart from the 7 normalization constants which were left free parameters in the fit, 50 independent sources of systematic error were propagated taking into account the correlations between those of the NMC data sets. We assume, however, that the errors on are independent from those on and . This has little effect on the total error estimate since the contribution from is small;
-
2.
The error on the strong coupling constant , on the strange quark content of the proton and on the nuclear corrections to , and (, ). Also included is an assumed error on the charm threshold GeV2. To determine these uncertainties, the fits were repeated with the parameter lowered or raised by the error and the corresponding error band is defined as the envelope of the results from the central fit and these two additional fits;
-
3.
An additional error band (‘analysis error’) is defined as the envelope of the results from the central fit and several alternative fits described in Section 5;
-
4.
The renormalization scale uncertainty. Two fits were performed with the renormalization scale set to and while keeping the factorization scale fixed to . The error band is defined as the envelope of the results from these fits and the central fit;
-
5.
The factorization scale uncertainty. Here the factorization scale was varied in the range while keeping the renormalization scale fixed to .
Unless otherwise stated the errors shown in this paper are the quadratic sum of the contributions (1)–(3) listed above, that is, the scale errors are not included. The error contributions to the parton densities and several structure functions from each of the sources are given in Section 5 where also the scale uncertainties are shown.
4 Results
The fit yielded a good description of the data. Adding the statistical and systematic errors in quadrature a is obtained for 1578 data points and 28 free parameters. The values for each data set separately are listed in Table 1. The values of the fitted parameters are given in Table 2. Table 1 shows that the is rather high for the ZEUS data. This is caused by 7 data points, more or less randomly distributed in the kinematic plane, which carry 84 units of . We have verified that removing these data points does not significantly change the results of the analysis.
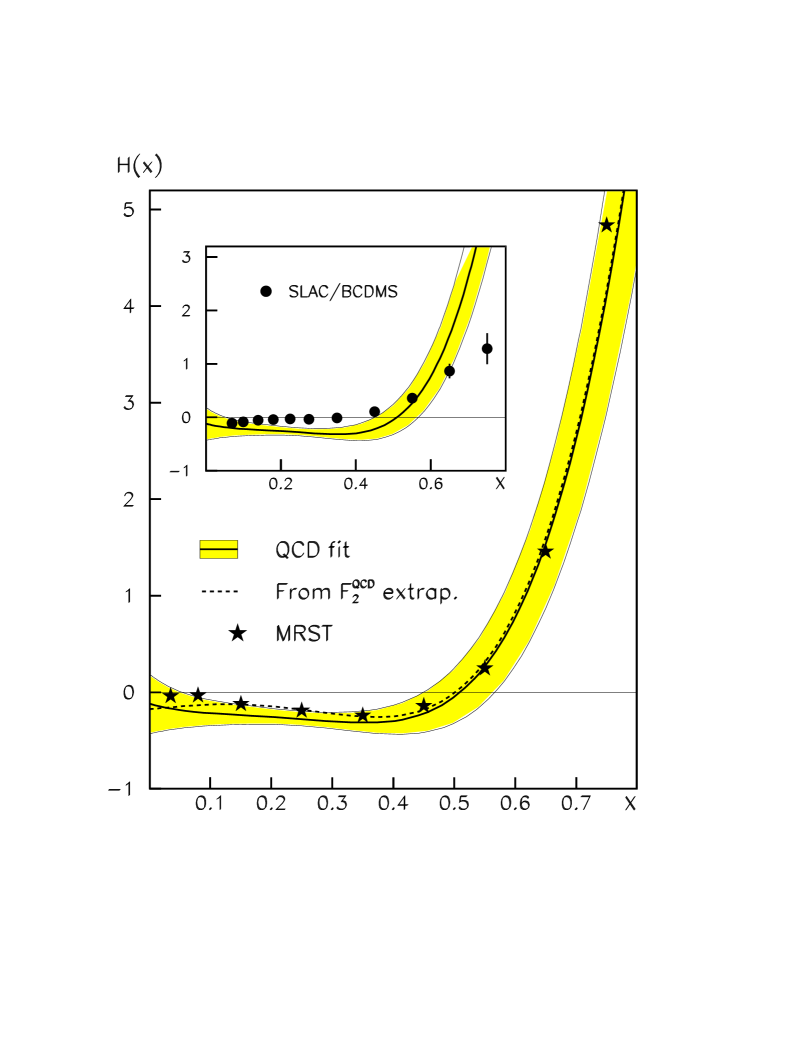
The good agreement between the data and the QCD fit can be seen from Fig. 2 where we show the dependence of at fixed values of . In Fig. 3 are plotted and from NMC, SLAC and BCDMS versus for . Again, the agreement between the data and the fit is satisfactory. The full (dotted) curves in this plot show the QCD prediction including (excluding) higher twist effects. The higher twist correction defined in Eq. (3) is plotted in Fig. 4 (full curve). This correction is negative for and becomes large and positive at high . The same trend is observed in the analysis of MRST [31] (asterisks). We refer to Section 5 for further investigations of higher twist effects. In the inset of Fig. 4 we compare from this analysis with the result from [24], averaged over proton and deuteron. We observe that the higher twist contributions obtained in this analysis are substantially larger although part of the difference may be due to the fact that the authors of [24] have corrected the data for kinematical higher twist contributions (target mass effects) before extracting .
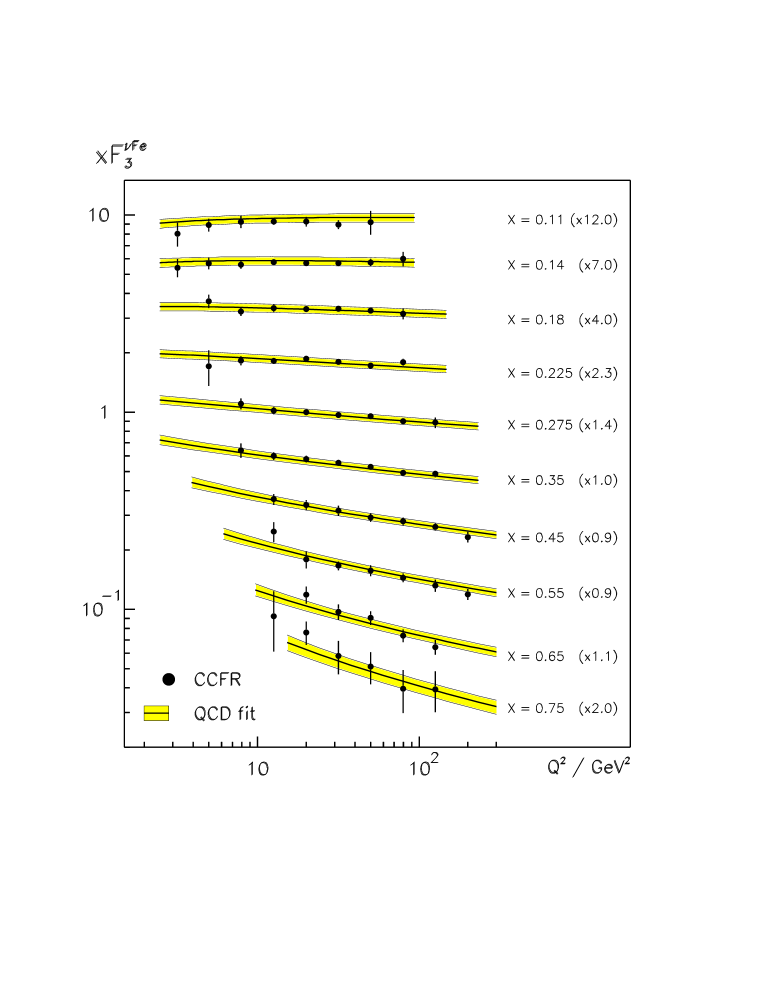
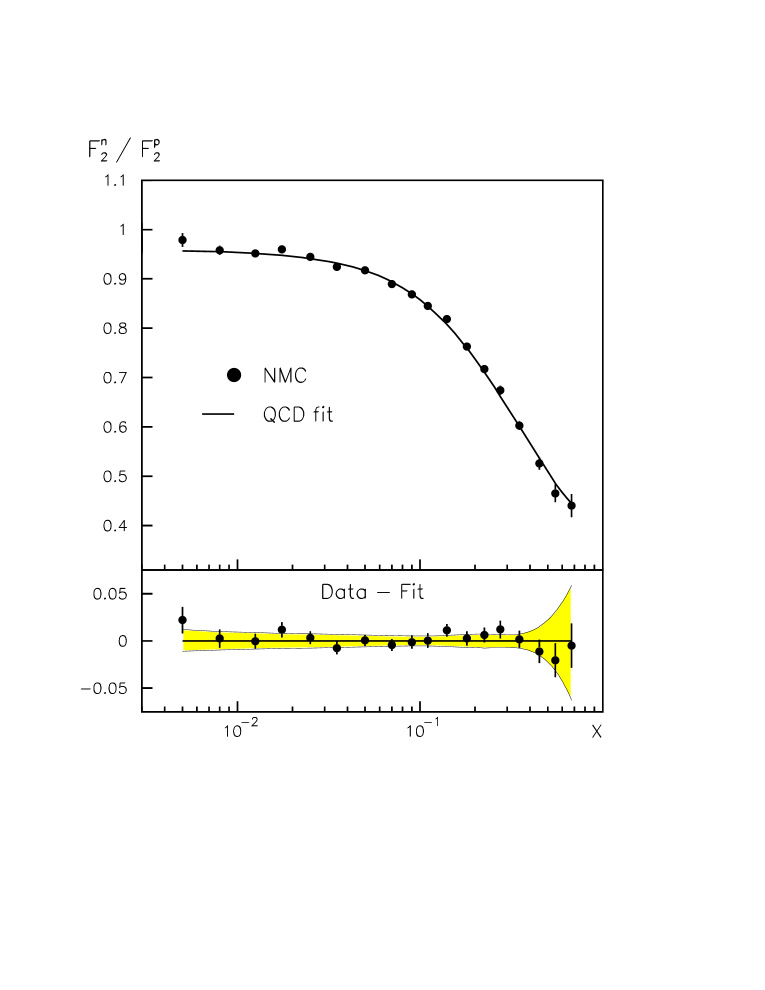
The dependence of for is shown in Fig. 5. There is good agreement between the data and the prediction from the QCD fit, corrected for nuclear effects as defined in Section 2. Also the ratio is well described as can be seen from Fig. 6 where we plot the dependence of , averaged over [16]. This figure shows that the error on the QCD prediction of rapidly increases above indicating that the ratio of to quark densities, which is directly related to , is not well constrained by the data at large .
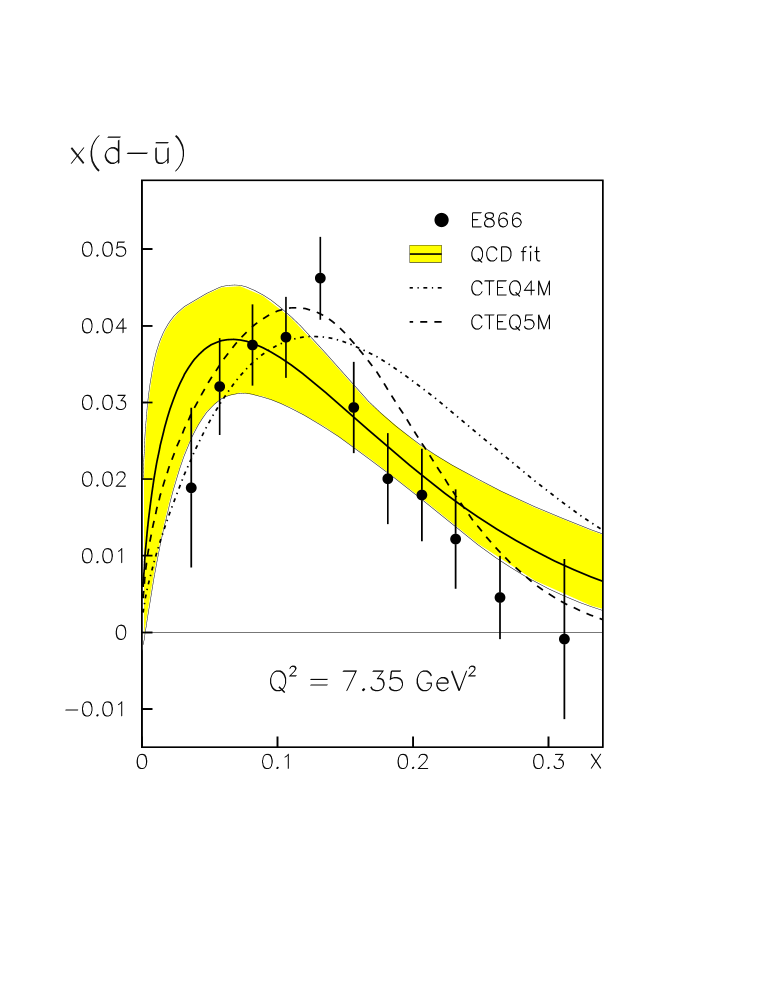
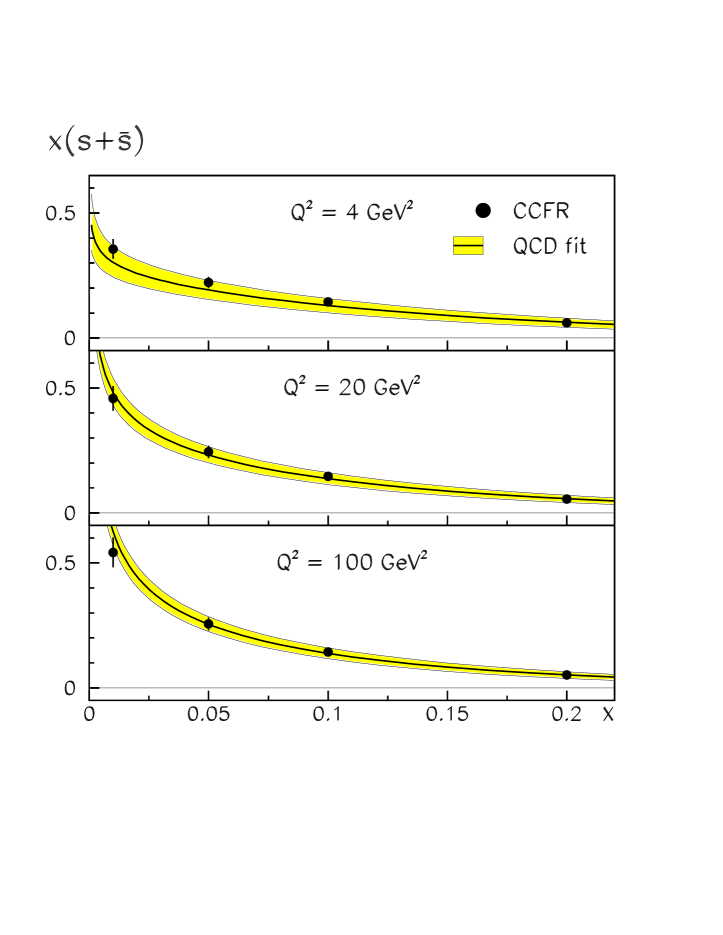
We show in Fig. 7 the density as a function of at GeV2. There is reasonable agreement between the E866 data and the fit. For comparison we also plot the prediction from the CTEQ4 (CTEQ5 [1]) parton distribution set which was obtained before (after) the E866 data became available. In Fig. 8 the strange quark density from the QCD fit is compared to the data from CCFR [23] (not included in the fit). The good agreement supports the description of with one fixed parameter (see Section 2). The shaded bands in Fig. 8 show that the error on the strange quark density, which is dominated by that on , is adequately taken into account by assuming .
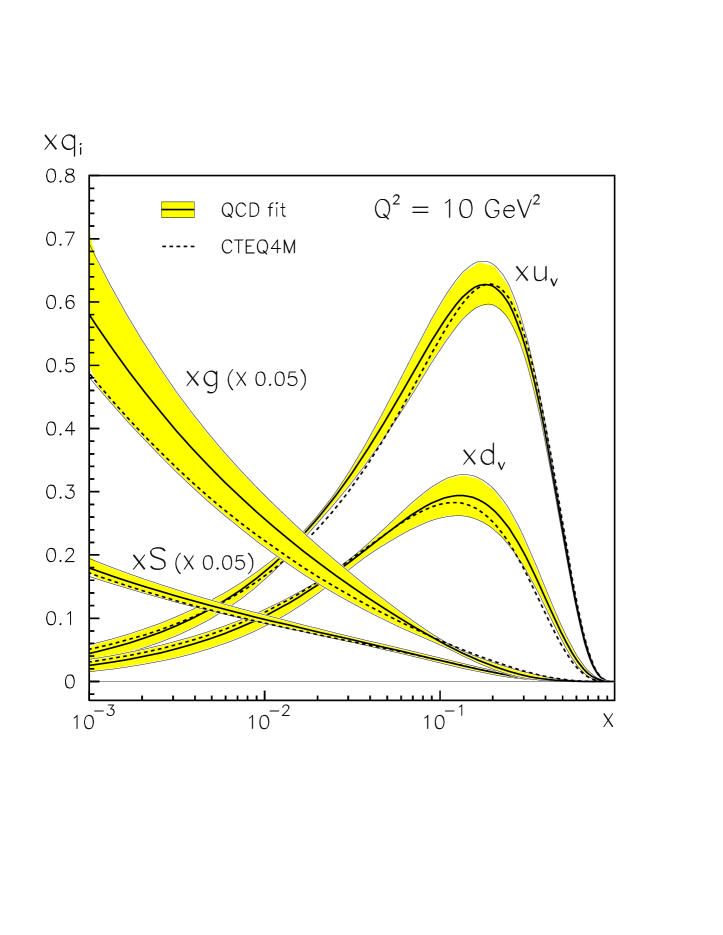
In Fig. 9 are plotted the parton densities from the QCD fit versus at GeV2. Integrating the parton densities over we find the following results for the momentum fractions carried by gluons and quarks at GeV2: , and (statistical and systematic errors added in quadrature). The error on the last integral is much smaller than that on the first two since the total momentum fraction was constrained to be unity in the QCD fit. This clearly illustrates the importance of taking into account the correlations between the errors on the parton densities. Notice that is the small contribution to the momentum sum, at GeV2, from the region .
Also shown in Fig. 9 are the parton densities from CTEQ4. There is, within errors, good agreement. Notice, however, that obtained in this analysis is slightly shifted towards larger values of .222 A similar shift is seen in the most recent parton distribution sets CTEQ5 and MRST [2]. Bodek and Yang [9] also obtain a harder density by modifying CTEQ4 (where the ratio as ) such that
| (11) |
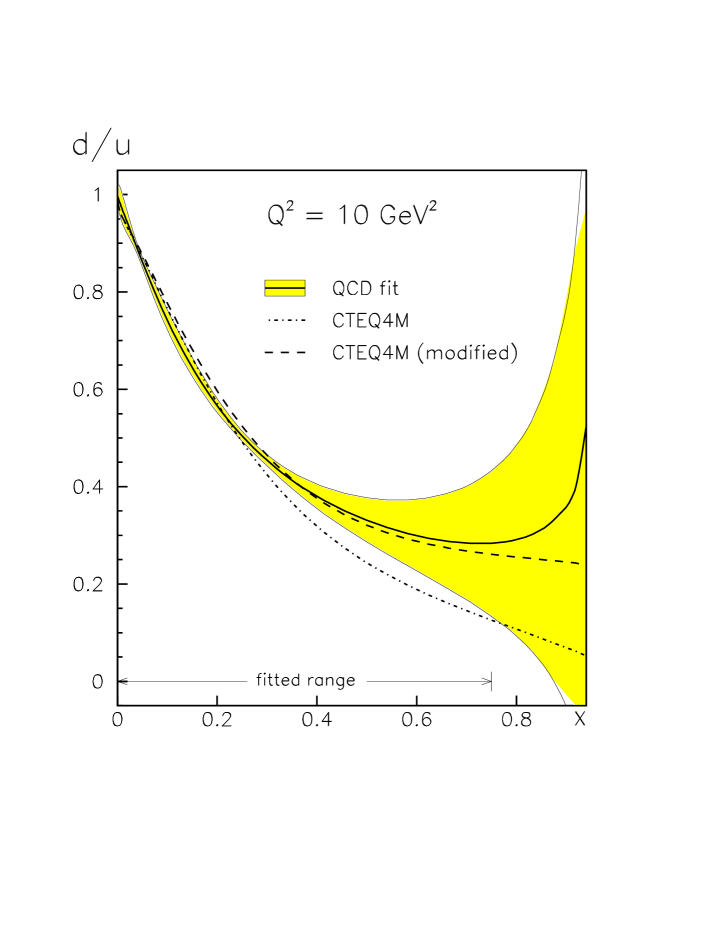
They find which implies that as .
The ratio is shown in Fig. 10. It is seen that the result from the QCD fit with (full curve) for is close to the modified CTEQ4 distribution with (dashed curve). If we parameterize the quark density according to Eq. (11) and leave a free parameter in the fit we obtain (statistical error), close to zero. In any case, the large error band shown in Fig. 10 clearly indicates that the exact behavior of at large is presently not well constrained by the data. This ratio might go to zero (CTEQ), to a constant (Bodek and Yang) or may even diverge (this analysis) as .
5 Systematic checks
To check the stability of the results we have performed a series of alternative fits:
-
1.
Use the quadratic sum of the statistical and systematic errors in the definition of the instead of taking statistical errors only;
-
2.
Release the momentum sum rule constraint. In this fit the total momentum fraction carried by quarks and gluons is found to be 1.03, close to unity. We did not perform a full error analysis for this fit but the uncertainty on the momentum sum is probably about the same as that given in Section 4 for the gluon and quark momentum fractions ();
-
3.
Set the value of the input scale to instead of to 4 GeV2;
-
4.
Lower the cut from 3 to 2 GeV2 and the cut from 7 to 5 GeV2;
-
5.
Raise the cut from 3 to 4 GeV2 and the cut from 7 to 10 GeV2;
-
6.
Remove the lower cut of on the data.
-
7.
Fix the normalization of the CCFR data (to , see Table 1) and let the nuclear correction on float by leaving a free parameter in the fit. This results in , consistent with the input value of ;
- 8.
-
9.
Leave the normalization of the NMC data free (one parameter for the 8 NMC data sets) so that all fixed target data are re-normalized with respect to HERA. This results in while the normalizations of the other data sets changed by less than 0.01, compared to the central fit;
- 10.
All the fits listed in items (1)–(10) above yielded good descriptions of the data with a per degree of freedom close to that of the central fit. To quantify the stability of the QCD analysis we define an ‘analysis error band’ as the envelope of the results from the central fit and these 10 alternative fits.
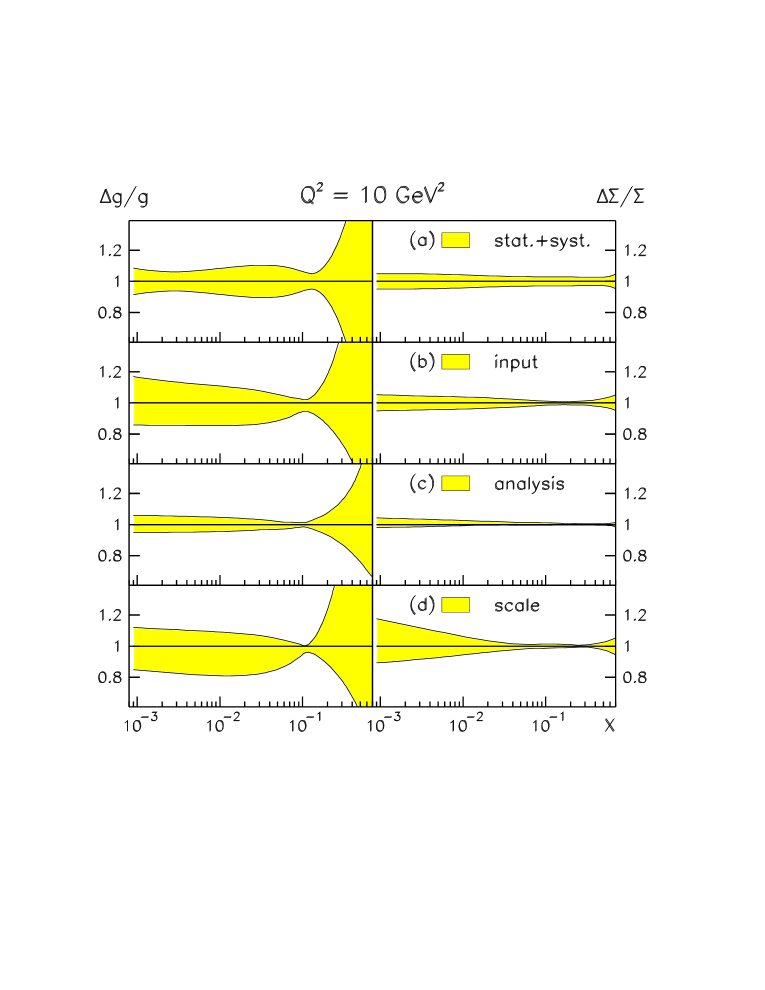
In Table 3 the contributions to the relative error on several parton densities and structure functions are given for each source listed in Section 3. These error contributions are calculated at GeV2 and are averaged over . In Fig. 11 we show as a function of at GeV2 the contributions to the relative error (left-hand plots) and (right-hand plots). It is seen that the experimental errors shown in Fig. 11a are roughly equal to the input errors which, in Fig. 11b, are calculated as the quadratic sum of the contributions listed in item (2) of Section 3. Compared to these two contributions the analysis error band is small (Fig. 11c). This illustrates the stability of the fit with respect to the ten alternatives listed above. The factorization and renormalization scale uncertainties added in quadrature are shown in Fig. 11d. For the gluon distribution the scale error is roughly equal to the other error contributions. For the quarks however the scale error, which is dominated by the factorization scale uncertainty, is the largest contribution to the total error.
To check the higher twist contributions obtained from the central fit, we have determined these in an alternative way as follows. First, we performed a fit with the and cuts raised to 10 and 35 GeV2 respectively. This restricts the kinematic region to a domain where higher twist effects are small (% as estimated from the results of the central fit) so that the evolution of the data can be described by perturbative QCD only. Keeping to zero in the fit, a good description of the data was obtained with a for 901 data points and 21 free parameters.333In addition to the five higher twist parameters the normalizations of the SLAC data sets were kept fixed because these data were almost entirely removed by the larger cuts. The parton densities obtained from this fit are, within errors, consistent with the central result.
Second, we used the parton densities obtained above to calculate the QCD predictions for and down to the standard cuts of and GeV2. Keeping in Eq. (3) fixed to these predictions we determined from a fit to the data on and . The result is compatible with that obtained from the central fit as shown by the dashed curves in Fig. 4. We conclude from this investigation that no significant bias is introduced by including, in the central fit, higher twist effects as parameterized in Eq. (3).
Finally, we performed a fit (with the standard cuts on the data) where the momentum sum rule constraint was removed and where in addition the higher twist contribution was kept fixed to zero. This resulted in a considerably worse for 1578 data points and 24 free parameters. Furthermore the total momentum fraction carried by quarks and gluons was found to be 1.20. This is so because a large gluon density is favored by the large slopes of the data at intermediate and low (see Fig. 3). We reject this fit as an alternative to the central result because of the large and the violation of the momentum sum rule.
6 Comparisons
In this section we calculate a few predictions based on the parton densities obtained from the QCD analysis and compare these to deep inelastic scattering data which are not included in the fit (except at large ).
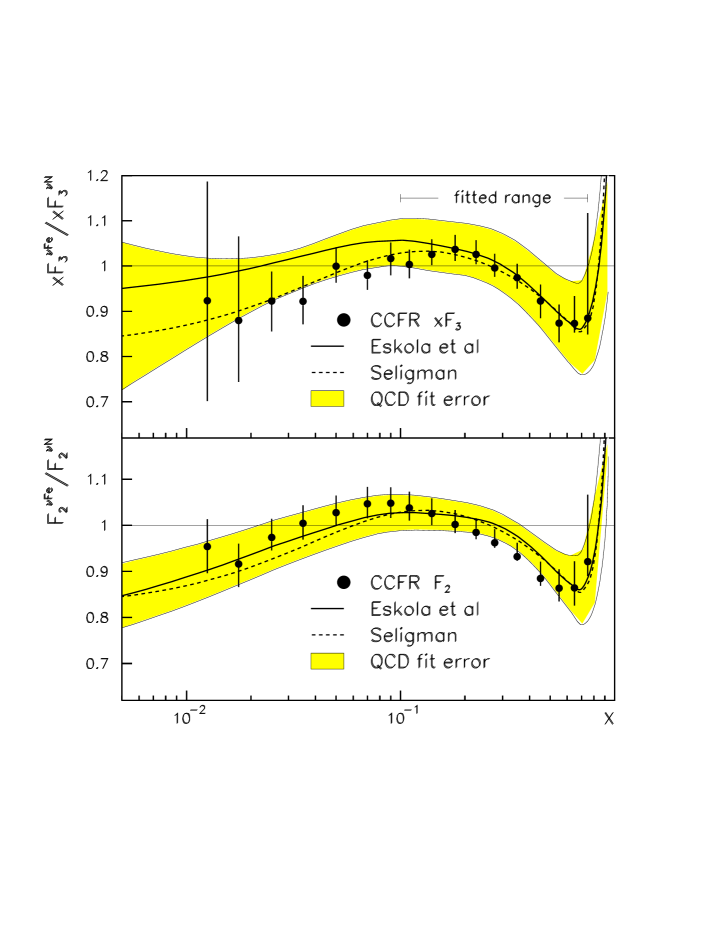
First, we investigate nuclear effects on the -Fe structure functions by calculating the ratio of the CCFR data to the predictions from the QCD fit of neutrino scattering on a free nucleon. We find that the ratios and do not, within errors, depend on in accordance with measurements of nuclear effects in charged lepton scattering where also no significant dependence has been observed [32]. We have therefore fitted the data to the parameterization
where was kept fixed to the QCD prediction and was left a free parameter for each bin of . In the fit only statistical errors on the data were taken into account. The upper (lower) systematic error on was estimated by offsetting the data with each source of systematic error in turn, repeating the fit and adding the deviations above (below) the central value in quadrature. Likewise the ratio was calculated for each bin of . In the fits only data were included above the charm threshold GeV2.
In Fig. 12 the results are plotted as functions of for (top) and (bottom). Both these ratios exhibit the typical dependence of nuclear effects including a hint for the rise at large due to Fermi motion in the nucleus. It is clear that nuclear effects in neutrino scattering on heavy targets are present and that corrections must be applied if these data are included in QCD fits. Also shown in Fig. 12 are two parameterizations of nuclear corrections from Eskola et al. (full curves)444Plotted are the nuclear corrections for iron on (see Section 2) and . and from Seligman [30] (dashed curves). Both these parameterizations are obtained from fits to data on nuclear effects in charged lepton scattering. To show the contribution to the errors on and from the QCD fit we have chosen to draw these as the shaded bands around the full curves. We conclude from Fig. 12 that, in the kinematic range explored and within the present errors, there is no strong indication for nuclear effects being different in neutrino or charged lepton deep inelastic scattering.
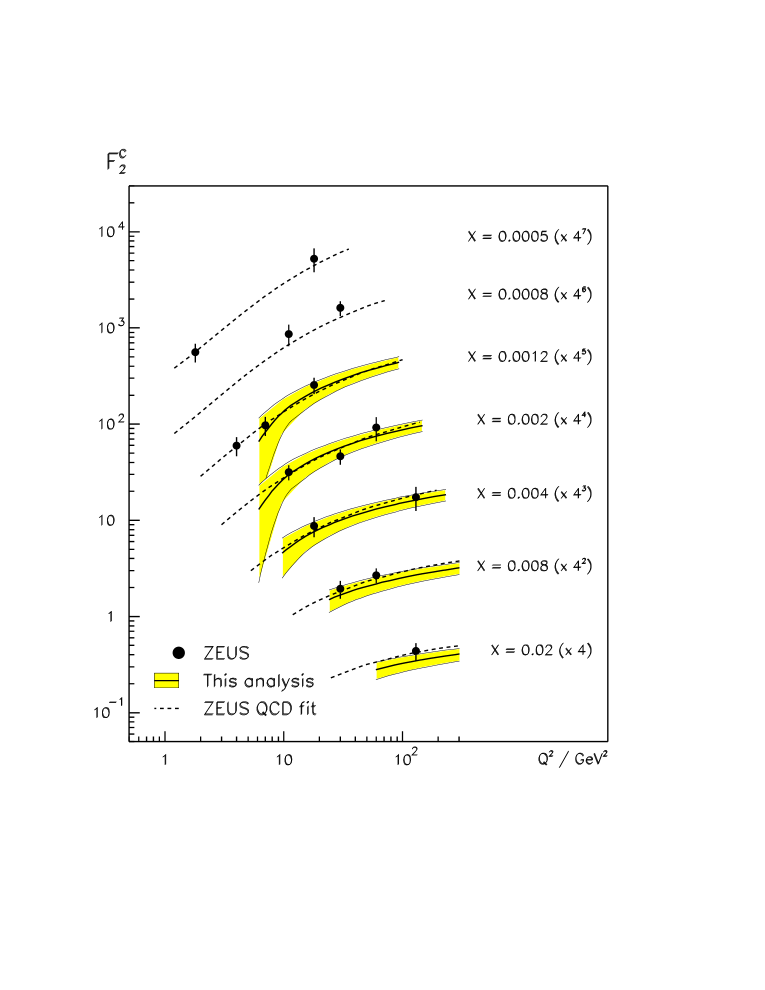
Next, we investigate to which extent the massless quark scheme used in this analysis is able to describe the charm contribution to the inclusive structure function. In Fig. 13 we show the recent data from ZEUS on [33] versus for . The full curves with the shaded error bands correspond to the prediction of from the QCD fit. Because these predictions are calculated with the assumption that the charmed quark is massless, the curves extrapolate to at the charm threshold GeV2 in disagreement with the data. For comparison we also plot in Fig. 13 the result from the ZEUS QCD analysis of [34] where charm mass effects were taken into account using the heavy quark three flavor scheme as defined in [10] (dashed curves). This heavy quark scheme gives a good description of over the full range down to the lowest measured value of , see [33]. However, it is seen from Fig. 13 that above GeV2 also the massless quark scheme describes the data well. This supports the assumption made in the remainder of this section that, at least for , quark mass effects do not spoil the QCD extrapolations to large .
To compare with the recent data from ZEUS [4, 5] we have used the parton densities from this analysis to calculate the Born cross sections for the processes (NC) and (CC). For unpolarized positrons and protons these cross sections are, at HERA energies, to good approximation given by
| (12) | |||||
Here is the fine structure constant, the Fermi constant and the mass of the boson. In Eq. (12), and with the square of the center of mass energy. The structure functions , and were calculated as functions of and in NLO using the expression given in [35] for . In the NC case contributions from exchange and - interference were taken into account. We refer to [4] and [5] and references therein for further details concerning the calculation of the NC and CC structure functions and for the input values of the electroweak parameters. We mention here that in leading order QCD the CC cross section can be written as [36]
| (13) |
from which it is seen that this cross section is predominantly determined by the down quark density.
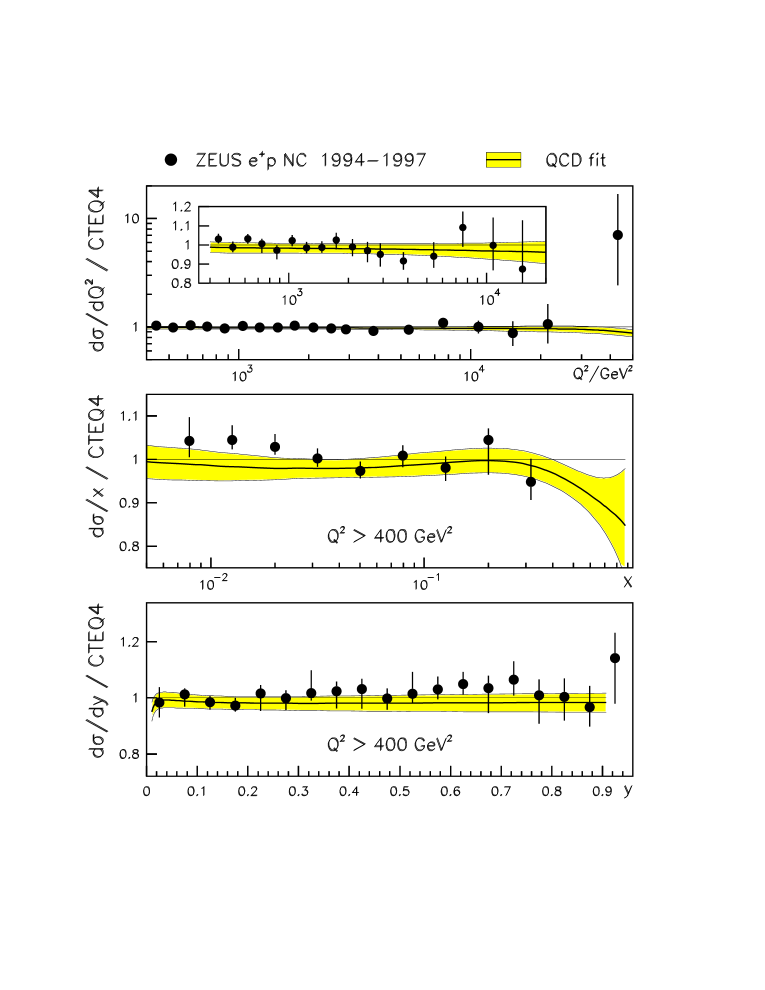
In Fig. 14 we plot the ZEUS data on the NC single differential cross sections , and for GeV2 together with the predictions from the QCD fit (full curves). Here both the data and the predictions are divided by the cross sections calculated from the CTEQ4D parton distribution set. This figure shows that the present analysis and CTEQ4 give a good description of the measurements although there is a slight tendency (%) of the QCD predictions to be below the data at low , low and large . These are the regions where the calculation of the cross sections might be sensitive to higher order QCD corrections on [37].
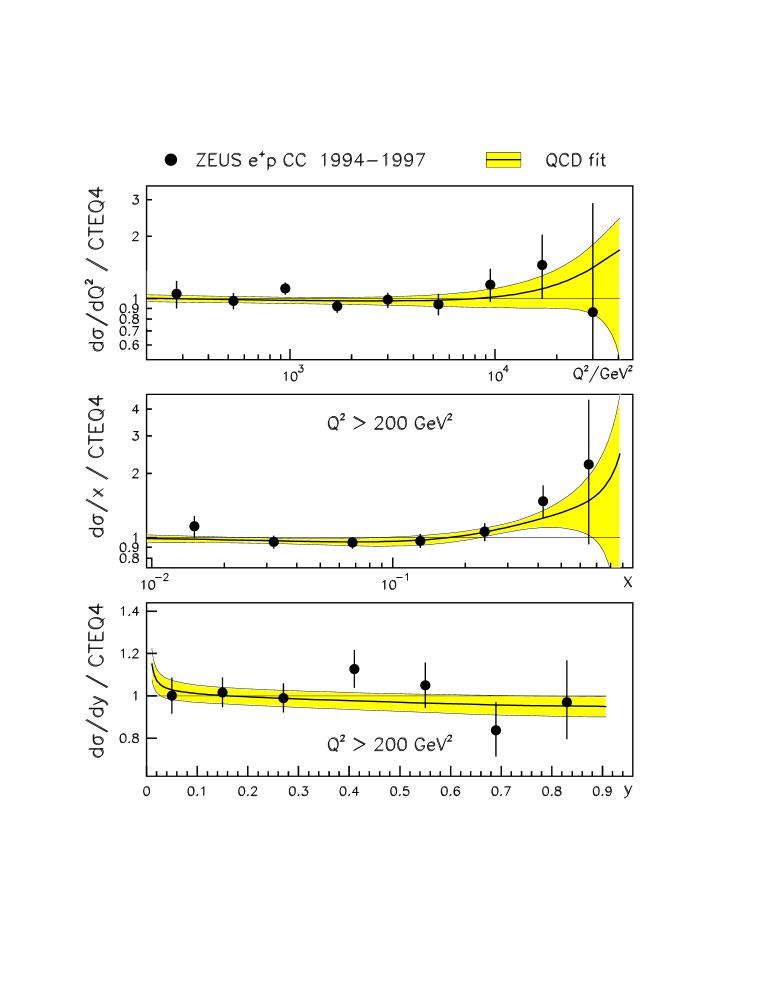
The ZEUS results on the CC single differential cross sections for GeV2 are shown in Fig. 15 (again divided by the CTEQ4 predictions). The agreement between the data and the predictions from the QCD fit (full curves) is excellent. The larger cross section at large and , compared to CTEQ4, is due to the harder distribution obtained in this analysis, see Fig. 9. We have verified that using the more recent parton distribution sets CTEQ5 and MRST, also with a harder density, yields results close to those presented here.
7 Summary
The parton momentum density distributions in the proton were determined from a NLO QCD analysis of structure functions measured at HERA and by fixed target experiments, together with measurements of the difference . The data included in the fit cover a kinematic range of , GeV2 and GeV2. The structure functions measured in nuclear targets were corrected for nuclear effects. Higher twist contributions to the proton and deuteron structure functions were taken into account phenomenologically. The fit was performed in the variable flavor number scheme where the charm and bottom quarks are assumed to be massless. It turns out that this scheme gives for and GeV2 a good description of the charm structure functions measured at HERA.
The uncertainties in the parton densities, structure functions and related cross sections were estimated from the experimental statistical errors, from the 57 independent sources of systematic uncertainty and from the errors on the input parameters of the fit. An additional analysis error is defined as the envelope of the results from the central fit and 10 alternative fits. This error gives a small contribution to the total error. Also estimated are the renormalization and the factorization scale uncertainties.
The fit yields a good description of the data. The higher twist contributions to and are found to be significant over the whole range covered in this analysis. The ratio of down to up quark densities at large is ill constrained by the data. As a consequence we find little sensitivity to a recently proposed parameterization of the quark density aimed at modifying at high .
Nuclear effects in neutrino scattering on iron were investigated by comparing measurements of and with the QCD predictions of neutrino scattering on a free nucleon. We do not, within the present errors, find a significant difference between nuclear effects in neutrino and charged lepton scattering.
From the evolved parton densities the NC and CC structure functions and Born cross sections were calculated. There is good agreement between these Standard Model predictions and the measurements by ZEUS of the NC and CC cross sections at large and .
The results of this analysis are stored on a computer readable file which is available from the web site http://www.nikhef.nl/user/h24/qcdnum. This file contains the statistical and systematic covariance matrices and, as functions of and , the parton densities as well as the derivatives of these densities to the fitted parameters. Also stored are the results of the systematic fits given in Section 3 item (2)–(5) as well as the analysis error band defined in Section 5. A Fortran program [38] is provided to read the file and it contains tools to propagate the errors to any function of the parton densities.
Acknowledgments
I would like to thank M. Cooper-Sarkar, R. Devenish, P. Kooijman, M. Kuze, E. Laenen and G. Wolf for discussions and comments on the manuscript. I am grateful to A. Vogt for many detailed comparisons of the GRV and Qcdnum evolution codes.
References
- [1] CTEQ Collab., H.L. Lai et al., MSU-HEP-903100, hep-ph/9903282 (1999).
- [2] A.D. Martin, R.G. Roberts, W.J. Stirling and R.S. Thorne, Univ. Durham preprint DTP-99-64, hep-ph/9907231 (1999).
- [3] M. Glück, E. Reya and A. Vogt, DO-TH-98-07, WUE-ITP-98-019, hep-ph/9806404 (1998).
- [4] ZEUS Collab., J. Breitweg et al., DESY-99-056, hep-ex/9905032 (1999).
- [5] ZEUS Collab., J. Breitweg et al., DESY-99-059, hep-ex/9907010 (1999).
- [6] H1 collab., C. Adloff et al., DESY-99-107, hep-ex/9908059 (1999).
- [7] ZEUS Collab., M. Derrick et al., Z. Phys. C72 (1996) 399.
- [8] CTEQ Collab., H.L. Lai et al., Phys. Rev. D55 (1997) 1280.
- [9] U.K. Yang and A. Bodek, Phys. Rev. Lett. 82 (1999) 2467.
- [10] E. Laenen, S. Riemersma, J. Smith and W.L. van Neerven, Nucl. Phys. B392 (1993) 162; S. Riemersma et al., Phys. Lett. B347 (1995) 143.
- [11] H1 Collab., S. Aid et al., Nucl. Phys. B470 (1996) 3.
- [12] E665 Collab., M.R. Adams et al., Phys. Rev. D54 (1996) 3006.
- [13] NMC, M. Arneodo et al., Nucl. Phys. B483 (1997) 3.
- [14] BCDMS Collab., A.C. Benvenuti et al., Phys. Lett. B223 (1989) 485 and Phys. Lett. B237 (1990) 592.
- [15] SLAC, L.W. Whitlow et al., Phys. Lett. B282 (1992) 475.
- [16] NMC, M. Arneodo et al., Nucl. Phys. B487 (1997) 3.
- [17] CCFR Collab., W. Seligman et al., Phys. Rev. Lett 79 (1997) 1213.
- [18] E866 Collab., E.A. Hawker et al., Phys. Rev. Lett. 80 (1998) 3715.
- [19] J. Gomez et al., Phys. Rev. D49 (1994) 4348.
-
[20]
K.J. Eskola, V.J. Kolhinen and C.A. Salgado, Eur. Phys. J. C9 (1999) 61;
K.J. Eskola, V.J. Kolhinen and P.V. Ruuskanen, Nucl. Phys. B535 (1998) 351. -
[21]
V.N. Gribov and L.N. Lipatov, Sov. J. Nucl. Phys. 15 (1972) 438, 675;
L.N. Lipatov, Sov. J. Nucl. Phys. 20 (1975) 94;
G. Altarelli and G. Parisi, Nucl. Phys. B126 (1977) 297;
Y. Dokshitzer, Sov. Phys. JETP 46 (1977) 641. -
[22]
G. Gurci, W. Furmanski and R. Petronzio, Nucl. Phys. B175 (1980) 27;
W. Furmanski and R. Petronzio, Phys. Lett. 97B (1980) 437 and Z. Phys. C11 (1982) 293. - [23] CCFR Collab., A.O. Bazarko et al., Z. Phys. C65 (1995) 189.
- [24] M. Virchaux and A. Milsztajn, Phys. Lett. B274 (1992) 221.
- [25] H. Georgi and D. Politzer, Phys. Rev. D14 (1976) 1829.
- [26] R.M. Barnett, Phys. Rev. Lett. 36 (1976) 1163.
- [27] M. Botje, QCDNUM version 16.12, ZEUS-97-066 (unpublished).
- [28] F. James, Minuit Version 94.1, CERN Program Library Long Writeup D506 (1994).
- [29] C. Pascaud and F. Zomer, preprint LAL 95-05 (1995).
- [30] W. Seligman, Ph.D. Thesis (Columbia University), Nevis Report 292 (1997).
- [31] A.D. Martin, R.G. Roberts, W.J. Stirling and R.S. Thorne, Phys. Lett. B443 (1998) 301.
- [32] NMC, A. Amaudruz et al., Nucl. Phys. B441 (1995) 3; M. Arneodo et al., Nucl. Phys. B441 (1995) 12; Nucl. Phys. B481 (1996) 23.
- [33] ZEUS Collab., J. Breitweg et al., DESY-99-101, hep-ex/9908012 (1999).
- [34] ZEUS Collab., J. Breitweg et al., Eur. Phys. J. C7 (1999) 609.
- [35] G. Altarelli and G. Martinelli, Phys. Lett. B76 (1978) 89.
- [36] U. Katz, ‘Deep-Inelastic Positron-Proton Scattering in the High Momentum-Transfer Regime of HERA’, to appear in Springer Tracts in Modern Physics (1999).
- [37] E. Zijlstra and W.L. van Neerven, Nucl. Phys. B383 (1992) 525.
- [38] M. Botje, ‘Fast access to parton densities, errors and correlations’, NIKHEF-99-034 (1999).
| Dataset | points | point | norm. | ||
|---|---|---|---|---|---|
| SLAC P | 61.3 | 56 | 1.10 | 0.988 | |
| SLAC D | 52.3 | 57 | 0.90 | 0.984 | |
| BCDMS P | 155.2 | 177 | 0.88 | 0.979 | |
| BCDMS D | 159.3 | 159 | 1.00 | 1.000 | |
| NMC E090 P | 46.0 | 44 | 1.04 | ||
| NMC E120 P | 63.2 | 53 | 1.19 | ||
| NMC E200 P | 75.4 | 64 | 1.18 | ||
| NMC E280 P | 65.2 | 72 | 0.91 | ||
| NMC E090 D | 47.2 | 44 | 1.07 | ||
| NMC E120 D | 43.5 | 53 | 0.82 | ||
| NMC E200 D | 47.6 | 64 | 0.74 | ||
| NMC E280 D | 51.4 | 72 | 0.71 | ||
| E665 P | 53.4 | 41 | 1.30 | 1.017 | |
| E665 D | 44.6 | 41 | 1.09 | 1.001 | |
| ZEUS | 235.1 | 147 | 1.60 | ||
| H1 | 98.2 | 150 | 0.65 | ||
| NMC | 189.1 | 205 | 0.92 | ||
| CCFR | 33.2 | 68 | 0.49 | 1.008 | |
| E866 | 16.9 | 11 | 1.54 | ||
| Total | 1537.2 | 1578 | 0.97 |
| Parameter | ||||||||||
| 1.32 | 0.81 | 0.03 | 0.31 | 0.10 | 2.72 | 1.98 | ||||
| 0.26 | 0.03 | 0.15 | 0.01 | 0.57 | 0.09 | 0.62 | 0.02 | 0.65 | 0.02 | |
| 5.19 | 1.53 | 3.96 | 0.19 | 7.47 | 1.00 | 3.89 | 0.02 | 3.07 | 0.18 | |
| 0.52 | 1.42 | 1.32 | 0.06 | 2.79 | 0.31 | 0.82 | 0.12 | |||
| 0.12 | 0.06 | 1.9 | 1.1 | 12.7 | 5.7 | 45.0 | 12.7 | 55.2 | 9.9 | |
| stat. | syst. | anal. | total | ||||||||
|---|---|---|---|---|---|---|---|---|---|---|---|
| 3.1 | 7.1 | 12.1 | 0.1 | 1.3 | 1.8 | 3.3 | 4.7 | 16.1 | 10.1 | 8.5 | |
| 0.7 | 3.9 | 1.2 | 1.2 | 0.3 | 0.8 | 2.5 | 1.6 | 5.5 | 0.6 | 5.8 | |
| 1.1 | 5.4 | 1.4 | 1.6 | 0.6 | 1.7 | 3.5 | 2.5 | 8.1 | 0.9 | 7.9 | |
| 0.9 | 3.4 | 1.5 | 0.0 | 1.3 | 3.6 | 0.1 | 1.0 | 5.7 | 2.1 | 1.4 | |
| 1.7 | 5.8 | 1.9 | 0.0 | 2.3 | 6.4 | 0.3 | 4.2 | 11.0 | 2.6 | 1.4 | |
| 0.3 | 3.3 | 0.1 | 0.0 | 0.1 | 0.2 | 0.1 | 0.8 | 3.4 | 0.2 | 0.3 | |
| 0.3 | 3.3 | 0.1 | 0.0 | 0.4 | 0.3 | 0.2 | 0.8 | 3.5 | 0.2 | 0.3 | |
| 0.1 | 0.4 | 0.0 | 0.0 | 0.3 | 0.1 | 0.0 | 0.1 | 0.6 | 0.1 | 0.0 | |
| 0.9 | 3.6 | 1.5 | 0.0 | 1.1 | 3.6 | 0.1 | 3.5 | 7.2 | 2.4 | 1.0 | |
| 9.7 | 21.7 | 1.9 | 0.2 | 29.0 | 9.5 | 5.2 | 14.4 | 45.5 | 10.9 | 4.1 |