Possibility of Large Final State Interaction Phases
in Light
of and Data
1Wei-Shu Hou and 2Kwei-Chou Yang
1Department of Physics, National Taiwan University,
Taipei, Taiwan 10764, R.O.C.
2Department of Physics, Chung Yuan Christian University,
Chung-li, Taiwan 32023, R.O.C.
Abstract
The newly observed mode is
quite sizable while is rather small.
Data also
hint at .
Though consistent with zero,
central values of violating asymmetries in
and show an interesting
pattern.
Taking cue from these, we suggest that,
besides
being large,
the rescattering
phase in and modes
may be greater than .
If this is true, not only the above trends can be accounted for,
one would
also find , and the
asymmetry
in vs. could be as large as .
These results can be tested in a couple of years.
pacs:
PACS numbers: 12.15.Ff, 11.30.Er, 13.25.Hw
††preprint:
]
The branching ratios (Br) of all four modes
as well as the mode have recently been reported by
the CLEO Collaboration [1].
The measurements of , ,
and modes have been improved,
while and modes are newly observed.
Direct CP asymmetries (s) in 5 charmless hadronic modes
have also been obtained [2] for the first time,
albeit with large errors.
The ratio suggests that
the unitarity phase angle () in
the Cabibbo-Kobayashi-Maskawa (CKM) matrix is of order .
Surveys of observed and emerging charmless rare B modes suggest that
[3, 4, 5, 6],
which is in some conflict with
obtained [7] from the global CKM fit
to data other than charmless hadronic B decays.
The ratio confirms
the expectation that the electroweak penguin (EWP) contribution
to the mode is constructive towards
the leading strong penguin (P) contribution [3, 5, 8].
These results illustrate the information contained in charmless B
decays that have been emerging in the past 3 years.
However, the strength of the newly observed mode,
at ,
is hard to understand, since EWP-P interference should be destructive.
One would have expected that ,
or .
The errors are still large,
but if we take the present central value seriously,
since mode is only weakly dependent on ,
a natural possibility is the presence of
strong final state interaction (FSI)
rescattering.
What is more, we find that present central values
as well as the indication that all offer some support for this possibility.
The long awaited mode is finally measured at
, which is rather small.
The data also hint at the mode.
Though not yet significant enough,
preliminary CLEO findings give
[1]
,
and the central values seem to indicate that
.
This could be brought about by large and/or large FSI phase.
The two pictures can be distinguished
by measuring [4, 8].
If small is due to
while FSI phase is small,
then is expected.
However, if the mechanism is due to large FSI phase , then can reach ,
i.e. as large as .
It is known that the s are very sensitive to FSI phases.
Although the present accuracy of s
in modes is limited by statistics,
the central values may already offer us a glimpse of
the trend of the FSI phase.
As we will show, we find
a coherent picture where not only is large,
but large is preferred as well,
if the current central values are taken at face value.
Moreover, large FSI phase
can not only be tested by finding ,
it can also be tested in the near future
by finding rather large in the mode.
The size of FSI phases in B decays is an issue of
great theoretical dispute [9],
which can only be settled by experiment.
We shall consider elastic rescattering phases
as the only long distance FSI phases,
returning to a more cautionary note towards the end of our discussion.
We do include short-distance rescattering phases arising from quark-gluon
diagrams. For simplicity, we shall also assume factorized amplitudes
that feed the elastic rescattering.
Let us study first the and modes
without assuming long distance FSI phase.
For the relevant effective weak Hamiltonian,
we refer to Refs. [8, 11, 12].
We take in penguin
coefficients to generate favorably large
quark level absorptive parts [13].
Adopting factorization approach with and
assuming that FSI rescattering is negligible
(i.e. setting the FSI phase ),
the Brs and s for the modes
are shown vs. in Figs. 1(a) and 1(b).
We have rescaled the value of
to fit the data,
and take
for SU(3)
breaking.
We use MeV since lower
improves agreement with data [4, 6].
Nonfactorizable effects are usually
lumped into an effective
.
In our case only and
have
color suppressed tree contribution and could
be sensitive to
if it is as small as .
However,
such a small value of is not reasonable.
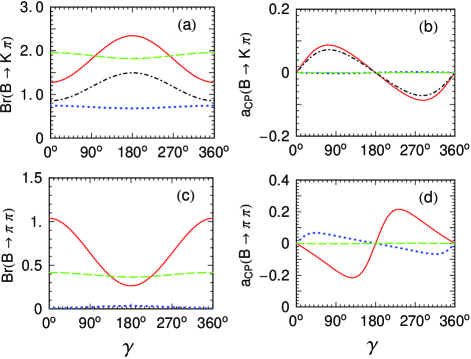
FIG. 1.:
Brs and s vs. for and
, respectively.
In (a) and (b), solid, dash,
dotdash and dots denote
, ,
and , respectively,
using 80 MeV.
For
(c) and (d), solid, dash and dots represent
,
and
with 4 MeV.
We have used
and Brs are in units of
.
The current data give , , , 1.88, 1.21, 1.82, 1.48
, respectively.
The observation
gives a strong hint for if is negligible.
The rate is weakly -dependent
since it receives only color suppressed tree (T) contribution.
Thus, as seen from the figure, the value of
has little impact on the rate.
Without EWP, one expects both and
,
where comes from the isospin wave function.
The ratio confirms numerically
the expectation that the mode is
enhanced by the EWP contribution.
However, EWP-P interference is expected to be destructive
in the amplitude,
hence the ratio
should decrease from 1/2 and read,
for MeV ( large),
(1)
where we have dropped the term for display purpose,
, and
.
Small can enhance slightly
the ratio
but does not help much in understanding data.
The s for modes are dominated by
Im(Re Im(
which peak at around .
But for modes,
which do not have sizable T component,
s are too small to be measureable.
Due to large errors in s so far,
it may be premature to compare theoretical results with data.
We note, nevertheless, that the present data [2]
give the central values for , and
as , and
, respectively,
which are not consistent with theoretical expectations of Fig. 1(b).
The T-P interference for
is anticorrelated [4, 10]
with the
case
because the penguin KM factors
are
and ,
which are opposite in sign since by definition.
Thus, are enhanced for
while is
suppressed,
as illustrated in Figs. 1(a) vs. 1(c).
Although experimental error for
mode is rather large,
the central value [1] seems to
suggest ,
hence is favored if FSI can be neglected.
The
for is given in Fig. 1(d),
which clearly is opposite in sign to .
It could be as large as at .
For this value, one would expect
,
which however
deviates considerably from the present observation
of , mainly in .
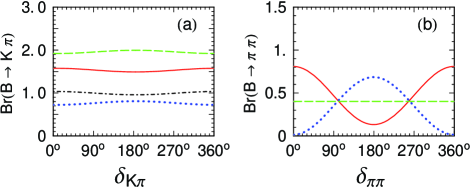
FIG. 2.: Brs for and vs. for
with notation as in Fig. 1.
Since large is favored but cannot explain
data completely,
could large
FSI phase alone work?
In Fig. 2, we show the Brs of and
vs. with [7].
Large could help explain [4, 8]
, but it fails badly in the
modes
since ,
while is only half of
and actually gains
little from the mode
via FSI rescattering.
We therefore conclude that large alone cannot account for data
and large
is still favored,
but large in this context should be further explored.
Before studying the case of having and both large,
let us make explicit our treatment of FSI phases
in and final states.
Following the notation of [14],
we decompose the
amplitudes as,
(2)
(3)
(4)
where correspond to final state isospin 0 and 2,
and are FSI phases.
For modes, we decompose the
amplitudes into
for
transitions to
final states,
and for
transitions to final states,
(5)
(6)
(7)
(8)
and are FSI phases.
Short distance quark-antiquark rescattering effects have been included,
which lead to small and calculable perturbative phases
for , and .
Because in modes the strength of EWP
is comparable to T,
it is known [15] that SU(3)
relations of Ref. [14] do not hold.
We refrain from discussing SU(3) but restrict ourselves to
SU(2) (isospin), where in
Eqs. (2) and (3) are nominally elastic FSI phases
but they model long-distance rescattering.
The phase differences are observable, which we denote as
and
.
Unlike the aforementioned case of EWP T
in the amplitudes and ,
electroweak effects in FSI rescattering are negligible
compared to strong FSI.
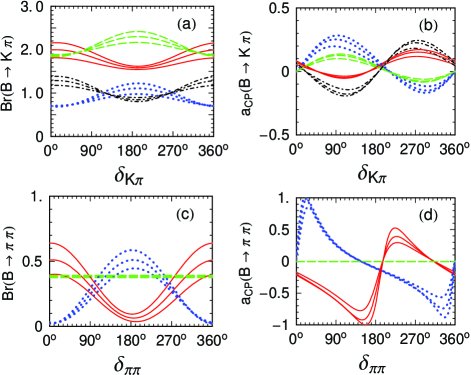
We plot in Fig. 3 the Brs and
s vs.
for and , respectively, for several large values.
From Fig. 3(a), we see that
FSI rescattering is magnified by large ,
while
rescattering
enhances .
This is because for ,
the T
contribution (hence ) changes sign,
leading to a
marked change in the rescattering pattern.
Taking and ,
we obtain ,
and the relative size of has
been enhanced by .
Such enhancement occur only when
.
Note that with larger , say
,
is still
possible if .
For even larger , in principle one can have
but then as well.
The preferred combination of and can be
better determined as data improve.
For the s, as
shown in Fig. 3(b), one has
,
respectively, for and ,
where the numbers in
parentheses are
the experimental central values.
Although
these numbers should not be taken too seriously at present,
we note that if current experimental
central values continue to hold,
they can be accounted for by having and both large.
Without final state rescattering,
the s for
are positive
and very close to each other, while
the s for
would be practically zero.
As illustrated here, with large
final state rescattering,
the s for
change sign,
while modes gain s
that are opposite to
modes.
These trends can be tested in the near future.
FIG. 3.: Brs and s for and vs.
.
For curves from:
(a) up (down) to down (up) for
() at
; and
(b) up (down) to down
(up) for
() at
; and
(c) down to up at ; and
(d) down to up for ()
at (),
are for
, and , respectively.
For the modes, as shown in Fig. 3(c),
could give
, which is hinted by present data.
For larger values, one has
less need for large phase.
Because FSI rescattering
feeds the mode,
becomes possible.
Observing large would be a
good indication [4, 8] for large FSI.
The s offer an even better test.
We plot in Fig. 3(d)
the s for modes.
For ,
the in can reach ,
which is 2–3 times larger than
the case without the phase.
We stress once again that, from Fig. 2, although a large
with small may
explain the small observed rate and ,
the ratio is
not very sensitive to
and would be too low compared to what is observed.
Before we conclude, we comment on some
uncertainties in the present study.
First, in factorization approach,
always appears together with .
We have used the set of
effective Wilson coefficients of [11].
To fit, for example the mode to data,
a larger would be accompanied by
a larger and vice versa.
The set of s adopted does not
change our conclusions.
Second, the rate is insensitive
to
and independent of ,
and is proportional to
.
Although our
result is below the present
experimental central value, the latter is not yet firm and
we have just concerned
ourselves with the ratio.
Third, factorization in the modes has been shown [16]
to follow from pQCD in the heavy quark limit.
One could extract the
effective from this study [11].
However, there are no significant changes
in and modes without considering
the long-distance FSI phase ,
which is the position taken in Ref. [16].
Note that the strong phases generated by
hard gluon rescattering off the spectator quark calculated in [16]
is destructive with the hard quark-antiquark rescatterings
in the penguin loop, resulting in
,
which is much smaller than shown in Fig. 1(d).
Thus, and
as large as would definitely indicate
the existence of large (elastic) FSI phase
arising from long distance effects,
something that is argued [16] to be () power suppressed.
That would be rather interesting,
since Regge [9] and other [17] arguments
give phase differences of order -.
As B factories at SLAC and KEK have already turned on,
together with the recent commissioning of the CLEO III detector at Cornell,
one should have at least ten times the present data in years.
It is
thus very likely that the FSI effects discussed
here would be tested in the near future.
Finally, we should caution that our illustration with
elastic strong FSI phase difference is
only phenomenological.
While is in principle possible [9],
FSI in B decays are expected to be highly inelastic [17].
A large strong phase could well be accompanied by
deviations in the magnitude of amplitudes
from factorized ones that we have used.
In conclusion, large is favored by data if
one considers together with data.
Although a large FSI phase
with the current
can account for the smallness of ,
it fails to explain the observed .
The strength of the observed mode,
the hint that ,
together with the current experimental central values for
in the modes,
all seem to suggest that on top of ,
the long-distance phase could be as large as
for both and modes.
If true, it would not only uphold the above indication and hints,
one would find an enhanced rate comparable to ,
and in the latter mode as large as .
These results should be testable in the next 2 years.
Acknowledgement. This work is supported in part by
the National Science Council of R.O.C.
under Grants NSC-89-2112-M-002-036
and NSC-89-2112-M-033-010.
We thank M. Suzuki for useful communications.
REFERENCES
[1]
CLEO Collaboration, Y. Kwon et al., CLEO-CONF 99-14 and
hep-ex/9908039.
[2]
CLEO Collaboration, T.E. Coan et al., CLEO-CONF 99-16 and
hep-ex/9908029.
[3] N.G. Deshpande et al.,
Phys. Rev. Lett. 82, 2240 (1999).
[6] W.S. Hou, J.G. Smith, F.
Würthwein, hep-ex/9910014.
[7] F. Parodi, P. Roudeau, A. Stocchi, hep-ph/9802289
and hep-ex/9903063;
S. Mele, Phys. Rev. D59, 113011 (1999).
[8] Y.H. Chen et al., Phys. Rev. D60, 094014 (1999).
[9] See e.g.
J.F. Donoghue, E. Golowich, A.A. Petrov, J.M. Soares,
Phys. Rev. Lett. 77, 2178 (1996);
D. Delépine, J.M. Gérard, J. Pestieau, J. Weyers,
Phys. Lett. B429, 106 (1998);
M. Suzuki, Phys. Rev. D58 111504 (1998);
J.L. Rosner, Phys. Rev. D60, 074029 (1999).
For a more complete list of references, see A.A. Petrov, hep-ph/9909312.
[10] J.P. Silva, L. Wolfenstein,
Phys. Rev. D49, 1151 (1994).