Measurement of the photon structure function at ALEPH
Abstract
The photon structure function has been measured with data taken by the ALEPH collaboration at LEP centre-of-mass energies with of 9.9, 20.7 and and with of 13.7 and . For the data at a two-dimensional unfolding method employing the principle of maximum entropy is used, which reduces the errors compared to one-dimensional methods.
1 INTRODUCTION
The photon structure function in collisions is measured [1, 2] where one of the incident beam leptons is scattered at sufficiently large angle to be detected. In these singly-tagged events the negative momentum transfer of the photon emitted by the tagged lepton is . The second lepton stays undetected so the momentum transfer is small.
The process then can be viewed as inelastic electron-photon scattering, where a quasi-real photon is probed by a virtual photon [3]:
| (1) |
with
| (2) | |||||
| (3) |
The inelasticity, measured with , is small and the term with may be neglected. Equation 1 can be used to relate the distribution in and to the structure function . A more elaborate introduction and discussion of you may find in Ref. [4].
In this article the recent measurements of with the ALEPH experiment are presented [1, 2]. Measurements at two different centre-of-mass energies and various have been performed. The data are used to test different model parameterizations of . Special emphasis has been put on a two-dimensional unfolding method to extract the true distribution from the measured data.
2 DATA
The ALEPH detector and its performance have been described in detail elsewhere [5]. Charged tracks and neutral calorimeter energy as defined by the ALEPH energy flow package [6] are used in these analyses.
Single tag events are selected by the lepton detected in the electromagnetic calorimeters of ALEPH: ECAL and LCAL for (LCAL and SiCAL for ). The scattering angle is measured in the range of in ECAL and in LCAL ( at ). Further cuts on and a veto on a second tag are applied.
The visible hadronic final state has to consist of at least three charged tracks and has to have an invariant mass . Further cuts for rejection of beam-gas events are applied. Additional cuts are required for the data at rejecting background from Z decays.
We are left with clean data samples with a remaining background of a few percent. The samples are divided into three (two) subsamples; see Table 1.
| # of | range | |||
| events | GeV2 | GeV2 | GeV | |
| ECAL | 163 | 35 - 3000 | 284 | 91 |
| LCAL | 1647 | 13 - 44 | 20.67 | 91 |
| LCAL | 1543 | 6 - 13 | 9.93 | 91 |
| SiCAL | 1208 | 7 - 24 | 13.7 | 183 |
| LCAL | 861 | 17 - 200 | 56.5 | 183 |
The data are corrected for trigger efficiency (which is close to 100%), downscaling, and acceptance. For the correction it is important to note that the invariant mass and therefore is poorly measured only, see Fig. 1. This

is especially due to the significant portion of the energy of the event which goes in the forward region where there is little or no tracking information. Therefore extraction of a measurement of the photon structure function from the data depends on the use of a model of the production of hadronic final states from collisions. There is at present no complete theoretical description of this process, so a number of phenomenological models are used.
Models giving reasonable descriptions of global event variables are then used to correct the data using an unfolding method.
The models chosen at are firstly a combination of QPM and VDM [3, 7], both with JETSET fragmentation [8], and secondly HERWIG [9] with GRV LO [10]. QPM and VDM are combined to form a single set, weighting each sample so as to give the best between distributions (the number of energy flow objects, the transverse momentum of all energy flow objects with respect to the beam direction, and the thrust of the event) predicted by the combined simulation and the data. In the HERWIG program the defaults for version 5.9 are used, apart from the intrinsic transverse momentum of the partons in the target photon. This was modified according to the scheme proposed by ZEUS and described in Ref. [11, 12].
3 UNFOLDING AND
EXTRACTION OF
As pointed out in the previous section, the invariant mass is poorly measured by current detectors and an unfolding method has to be employed. Both at and at a regularization procedure is used to suppress oscillations in the result.
At the unfolding was performed using the procedure proposed by Blobel [15]. This procedure fits a sum of spline curves to the data after passing them through the versus response matrix obtained from the simulated events (HERWIG and QPM+VDM), suppressing oscillations which have higher frequency. The structure function is then obtained using the GALUGA program [16], where is set to its theoretical value. With set to 1 the output is used as reference for the extraction of of the data.
At a new, recently proposed method [11] has been used for the unfolding (Ref. [2] and references therein). It uses the principle of maximum entropy. In addition, this method allows a two-dimensional unfolding to be applied. The regularization function used is the Shannon entropy [17]:
| (4) |
when are the parameters to be estimated in bin and is their sum. This entropy-based regularization makes no reference to the relative locations of any of the bins. Therefore the principle of maximum entropy can be directly applied to multidimensional distributions. This method reduces the model dependence by including for each event not only , but in addition some other variable characterizing the final state. For this, the variable has been introduced, defined as the total energy of the particles having angles with respect to the beam line less than . Here the resolution degrades considerably for increasing , see Fig. 2.
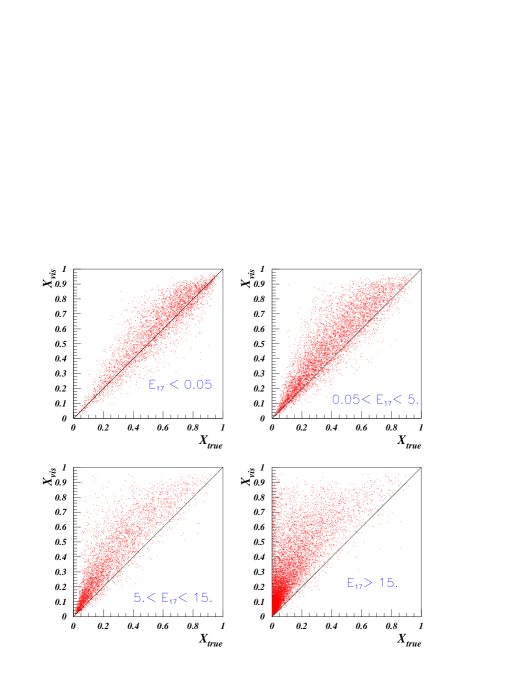
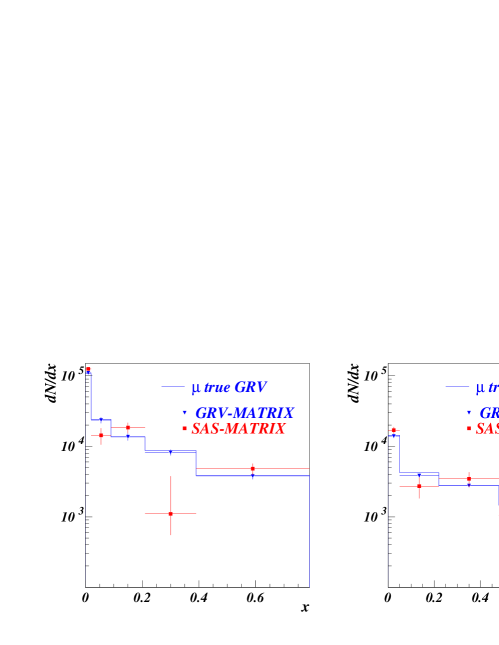
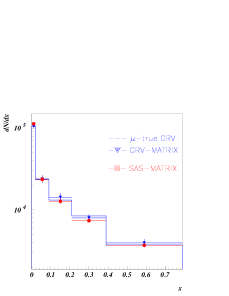
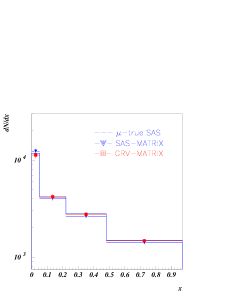
The two-dimensional unfolding leads to smaller statistical errors. This is because in the one-dimensional case, the effective weight of each event is determined by the average resolution in the bin. With two-dimensional unfolding, those events with low are given a higher weight in the final result. The improvements achievable by two-dimensional unfolding where investigated quantitatively in Ref. [11]. An example is shown in Fig. 3, where a toy-MC sample was used and two different response matrices to demonstrate the differences in one- and two-dimensional unfolding. Nevertheless the model dependence remains a significant source of systematic uncertainty, and several event generators are used in the presented analysis to account for this. After unfolding the structure function is obtained from the distribution using the same MC simulation that was used for the determination of the response matrix. The measurement in data is taken as the average of the distributions obtained with the response matrices of the models used.
4 RESULTS
4.1 Measurements for
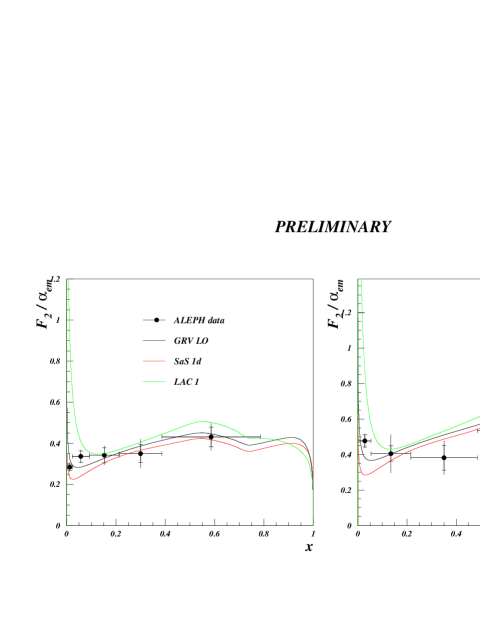
The final results for are shown in Fig. 4 for and in Fig. 5 for , resp. The inner error bars are statistical errors, the total error bars represent the quadratic sum of statistical and systematic errors. The systematic error comprise uncertainties from the unfolding (spread of the results based on the different models etc.), from detector efficiency and acceptance including trigger, selection criteria etc. The analysis includes a small theoretical error from the assumed form factor of the virtual photon as well as the dependence on the assumption of .


4.2 Comparison of to parameterizations
For both centre-of-mass energies and the different ranges all of the parameterizations provide a good description of the data for . For lower the LAC values are significantly too high. At a test has been made using event reweighting to ensure that the difference is not an artifact of the unfolding procedure; for more details see Ref. [1]. The low region is sensitive to the gluon content of the photon. A was calculated in the eleven bins in to quantify the comparison to various sets of the parton density function of the photon, see Table 2. Those that show significantly large values of such as LAC 1 and 2 and Whit 4,5, and 6, contain a large gluon content, resulting in a rapid rise in the structure function at low .
| DG Set 1 | 4.3 | DG Set 2 | 5.0 |
| LAC 1 | 107.2 | LAC 2 | 75.9 |
| LAC 3 | 3.9 | GS-96 HO | 7.6 |
| GS-96 LO | 8.9 | GRV HO | 4.9 |
| GRV LO | 3.8 | AFG HO | 4.6 |
| Whit 1 | 5.2 | Whit 2 | 13.9 |
| Whit 3 | 18.3 | Whit 4 | 40.0 |
| Whit 5 | 105.5 | Whit 6 | 130.8 |
| SaS Set 1D | 10.0 | SaS Set 1M | 4.3 |
| SaS Set 2D | 3.6 | SaS Set 2M | 3.7 |
4.3 Dependence of from
The values of for the three ranges at have been averaged over the region . A logarithmic rise with is seen as expected from theoretical predictions using the parameterizations listed in Table 2.
5 CONCLUSIONS
Single-tagged two-photon events recorded by the ALEPH detector at LEP I and LEP II have been studied in three and two bins of , which have a mean of 9.9, 20.7 and and 13.7 and . The data have been used to measure the hadronic structure function as a function of . The comparison with parameterizations show that those with parton density functions that contain a large gluon content are inconsistent with data. The rise of with is found compatible with the available parameterizations.
A two-dimensional unfolding technique using the principle of maximum entropy has been successfully applied; with the second variable chosen as , defined as the total energy of the particles having angles with respect to the beam line less than . This unfolding method reduces the statistical errors and the model dependence of the extracted as compared to one-dimensional procedures.
References
- [1] R. Barate et al. (ALEPH Collab.), preprint CERN-EP/99-063, submitted to Phys. Lett. B.
- [2] K. Affholderbach et al. (ALEPH Collab.), internal note CONF/99-022.
- [3] C. Berger and W. Wagner, Phys. Rep. 146 (1987) 1.
- [4] R. Nisius, this proceedings.
-
[5]
D. Decamp et al. (ALEPH Collab.),
Nucl. Instr. Meth. A294 (1990) 121;
D. Buskulic et al. (ALEPH Collab.), Nucl. Instr. Meth. A360 (1995) 481. - [6] D. Decamp et al. (ALEPH Collab.), Phys. Lett. B246 (1990) 306.
-
[7]
F.A. Berends, P.H. Daverveldt and R. Kleiss,
Computer Phys. Commun. 40 (1986) 285;
D. Buskulic et al. (ALEPH Collab.), Phys. Lett. B313 (1993) 509. - [8] T. Sjostrand, Computer Phys. Commun. 82 (1994) 74.
- [9] G. Marchesini et al., Computer Phys. Commun. 67 (1992) 465.
- [10] M. Glück, E. Reya and A. Vogt, Phys. Rev. D45 (1992) 3986; D46 (1992) 1974.
- [11] S. Cartwright et al., J. Phys. G 24 (1998) 457.
- [12] M. Derrick et al. (ZEUS Collab.), Phys. Lett. B354 (1995) 163.
- [13] G.A. Schuler and T. Sjöstrand, Z. Phys. C68 (1995) 607.
-
[14]
R. Engel, Z. Phys. C66 (1995) 203;
R. Engel and J. Ranft, Phys. Rev. D54 (1996) 4244. - [15] V. Blobel, in Proceedings of the CERN School of Computing, Aiguablava, Spain (1984), CERN 85-09.
- [16] G.A. Schuler, Computer Phys. Commun. 108 (1998) 279.
- [17] C.E. Shannon, Bell Sys. Tech. J.27 (1948) 379.