Mapping the QCD Phase Diagram
The QCD vacuum in which we live, which has the familiar hadrons as its excitations, is but one phase of QCD, and far from the simplest one at that. One way to better understand this phase and the nonperturbative dynamics of QCD more generally is to study other phases and the transitions between phases. We are engaged in a voyage of exploration, mapping the QCD phase diagram as a function of temperature and baryon number chemical potential . Because of asymptotic freedom, the high temperature and high baryon density phases of QCD are more simply and more appropriately described in terms of quarks and gluons as degrees of freedom, rather than hadrons. The chiral symmetry breaking condensate which characterizes the vacuum phase melts away. At high densities, quarks form Cooper pairs and new condensates develop. The formation of such superconducting phases [1, 2, 3, 4] requires only weak attractive interactions; these phases may nevertheless break chiral symmetry [5] and have excitations which are indistinguishable from those in a confined phase [5, 6, 7, 8]. These cold dense quark matter phases may arise in the centers of neutron stars; mapping this region of the phase diagram will require an interplay between theory and neutron star phenomenology. The goal of the experimental heavy ion physics program is to explore and map the higher temperature regions of the diagram. Recent theoretical developments suggest that a key qualitative feature, namely a critical point which in a sense defines the landscape to be mapped, may be within reach of discovery and analysis by the CERN SPS, if data is taken at several different energies [9, 10]. The discovery of the critical point would in a stroke transform the map of the QCD phase diagram which we sketch below from one based only on reasonable inference from universality, lattice gauge theory and models into one with a solid experimental basis.
1 The Critical Point on the Map
We begin our walk through the phase diagram at zero baryon number density, with a brief review [11] of the phase changes which occur as a function of temperature. That is, we begin by restricting ourselves to the vertical axis in Figures 1 through 4. This slice of the phase diagram was explored by the early universe during the first tens of microseconds after the big bang and can be studied in lattice simulations. As heavy ion collisions are performed at higher and higher energies, they create plasmas with a lower and lower baryon number to entropy ratio and therefore explore regions of the phase diagram closer and closer to the vertical axis.
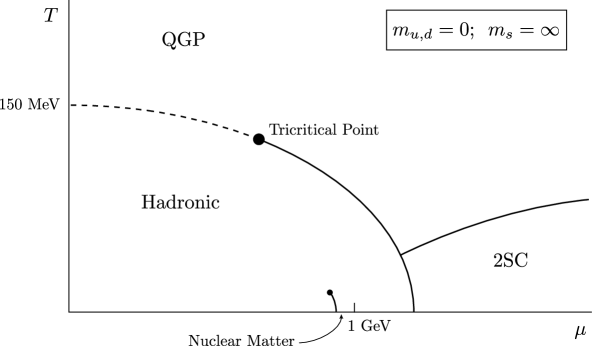
In QCD with two massless quarks (; ; Figure 1) the phase transition at which chiral symmetry is restored is likely second order and belongs to the universality class of spin models in three dimensions [12]. Below , chiral symmetry is broken and there are three massless pions. At , there are four massless degrees of freedom: the pions and the sigma. Above , the pion and sigma correlation lengths are degenerate and finite. In nature, the light quarks are not massless. Because of this explicit chiral symmetry breaking, the second order phase transition is replaced by an analytical crossover: physics changes dramatically but smoothly in the crossover region, and no correlation length diverges. Thus, in Figure 2, there is no sharp boundary on the vertical axis separating the low temperature hadronic world from the high temperature quark-gluon plasma. This picture is consistent with present lattice simulations [13], which suggest MeV [14].
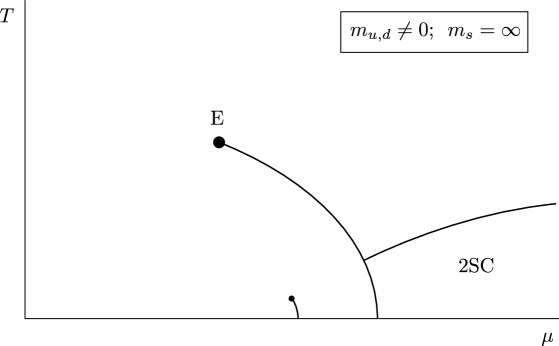
Arguments based on a variety of models [15, 16, 3, 4, 17, 18] indicate that the transition as a function of is first order at large . This suggests that the phase diagram features a critical point at which the line of first order phase transitions present for ends, as shown in Figure 2.111If the up and down quarks were massless, would be a tricritical point [21], at which the first order transition becomes second order. See Figure 1. At , the phase transition is second order and is in the Ising universality class [17, 18]. Although the pions remain massive, the correlation length in the channel diverges due to universal long wavelength fluctuations of the order parameter. This results in characteristic signatures, analogues of critical opalescence in the sense that they are unique to collisions which freeze out near the critical point, which can be used to discover [9, 10].
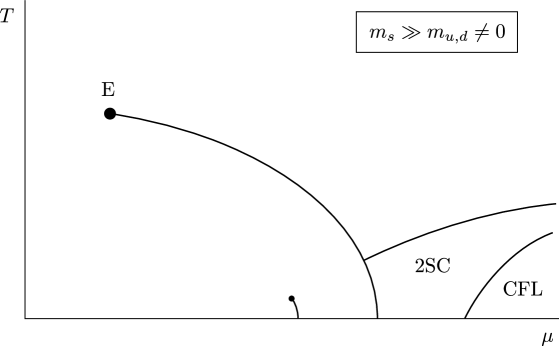
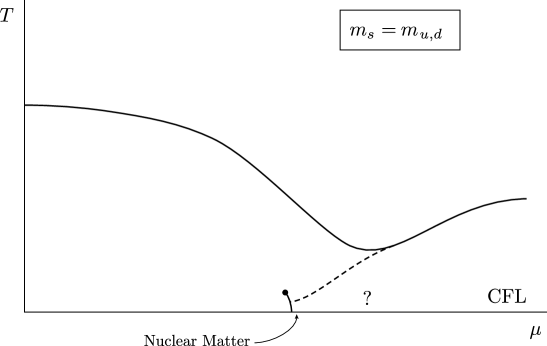
Returning to the axis, universal arguments [12], again backed by lattice simulation [13], tell us that if the strange quark were as light as the up and down quarks, the transition would be first order, rather than a smooth crossover. This means that if one could dial the strange quark mass , one would find a critical at which the transition as a function of temperature is second order [22, 11]. Figures 2, 3 and 4 are drawn for a sequence of decreasing strange quark masses. Somewhere between Figures 3 and 4, is decreased below and the transition on the vertical axis becomes first order. The value of is an open question, but lattice simulations suggest that it is about half the physical strange quark mass [23, 24]. These results are not yet conclusive [25] but if they are correct then the phase diagram in nature is as shown in Figure 3, and the phase transition at low is a smooth crossover.
These observations fit together in a simple and elegant fashion. If we could vary , what we would find is that as is reduced from infinity to , the critical point in the plane moves toward the axis [9]. This is shown in Figures 2-4. In nature, is at some nonzero and . When is reduced to , between Figure 3 and Figure 4, reaches zero. Of course, experimentalists cannot vary . They can, however, vary . The AGS, with beam energy 11 AGeV corresponding to GeV, creates fireballs which freeze out near MeV [26]. When the SPS runs with GeV (beam energy 158 AGeV), it creates fireballs which freeze out near MeV [26]. By dialing and thus , experimenters can find the critical point .
2 Discovering the Critical Point
The map of the QCD phase diagram which we have sketched so far is simple, coherent and consistent with all we know theoretically; the discovery of the critical point would provide an experimental foundation for the central qualitative feature of the landscape. This discovery would in addition confirm that in higher energy heavy ion collisions and in the big bang, the QCD phase transition is a smooth crossover. Furthermore, the discovery of collisions which create matter that freezes out near would imply that conditions above the transition existed prior to freezeout, and would thus make it much easier to interpret the results of other experiments which seek signatures which probe the partonic matter created early in the collision.
We theorists must clearly do as much as we can to tell experimentalists where and how to find . The “where” question, namely the question of predicting the value of and thus suggesting the to use to find , is much harder for us to answer. One of the things which is intrinsic to the picture we have described is that is sensitive to the mass of the strange quark, and therefore particularly hard to predict. Crude models suggest that could be MeV in the absence of the strange quark [17, 18]; this in turn suggests that in nature may have of order half this value, and may therefore be accessible at the SPS if the SPS runs with GeV. However, at present theorists cannot predict the value of even to within a factor of two. The SPS can search a significant fraction of the parameter space; if it does not find , it will then be up to the RHIC experiments to map the MeV region.
The other half of the “where” question is the question of how close does one have to come to to detect its presence. That is, how big steps in can one safely take and still be reasonably confident of discovering if it is there to be found? To answer this, we must estimate , the width in of the region centered at within which the correlation length is longer than fm, and thus detectable effects of arise [10]. Here again, only crude models are available. Analysis within the toy model of Ref. [17] suggests that in the absence of the strange quark, MeV for MeV. Similar results can be obtained [27] within a random matrix model [18]. It is likely over-optimistic to estimate MeV when the effects of the strange quark are included and itself is significantly reduced. A conservative estimate would be to use the models to estimate that in an infinite system. Finite size effects must increase . As a reasonable estimate, the best available at present for use in planning experimental strategy, one may take . This suggests that if experiments could be done at about four energies between AGS energy () and maximum SPS energy ( GeV), there would be a good chance of finding if it lies within the range . An SPS run at GeV (beam energy 40 AGeV) is already planned. This data, together with that already taken at GeV, together with data from two (or perhaps only one) additional beam energies in between would allow the SPS to search for the critical point over a substantial range of parameter space. There is therefore a strong scientific argument for an 80 AGeV run. If runs at two energies between 40 AGeV and 158 AGeV were possible, that would be ideal.
It should be clear by now that although we are trying to be helpful with the “where” question, we are not very good at answering it quantitatively. This question can only be answered convincingly by an experimental discovery. What we as theorists can do reasonably well is to answer the “how” question, thus enabling experimenters to answer “where”. This is the goal of a recent paper by Stephanov, myself and Shuryak [10, 28]. The signatures we have proposed are based on the fact that is a genuine thermodynamic singularity at which susceptibilities diverge and the order parameter fluctuates on long wavelengths. The resulting signatures are nonmonotonic as a function of : as this control parameter is varied, we should see the signatures strengthen and then weaken again as the critical point is approached and then passed.
The simplest observables we analyze are the event-by-event fluctuations of the mean transverse momentum of the charged particles in an event, , and of the total charged multiplicity in an event, . We calculate the magnitude of the effects of critical fluctuations on these and other observables, making predictions which, we hope, will allow experiments to find . As a necessary prelude, we analyze the contribution of noncritical thermodynamic fluctuations. We compare the noncritical fluctuations of an equilibriated resonance gas to the fluctuations measured by NA49 at GeV [29]. The observed fluctuations are as perfect Gaussians as the data statistics allow, as expected for freeze-out from a system in thermal equilibrium. The width of the event-by-event distribution of the mean is in good agreement with predictions based on noncritical thermodynamic fluctuations.222This width can be measured even if one observes only two pions per event [30]; large acceptance data as from NA49 is required in order to learn that the distribution is Gaussian, that thermodynamic predictions may be valid, and that the width is therefore the only interesting quantity to measure. The data on multiplicity fluctuations show evidence for a nonthermodynamic contribution, which is to be expected since the extensive quantity is sensitive to the initial size of the system and thus to nonthermodynamic effects like variation in impact parameter. The contribution of such effects to the fluctuations have now been estimated [31, 32]; the combined thermodynamic and nonthermodynamic fluctuations are in satisfactory agreement with the data [32]. We use our analysis to argue [10] that NA49 data are consistent with the hypothesis that almost all the observed event-by-event fluctuation in mean , an intensive quantity, is thermodynamic in origin. This bodes well for the detectability of systematic changes in thermodynamic fluctuations near .
As one example, consider the ratio of the width of the true event-by-event distribution of the mean to the width of the distribution in a sample of mixed events [10]. We called this ratio . NA49 has measured [29, 10], which is consistent with expectations for noncritical thermodynamic fluctuations.333In an infinite system made of classical particles which is in thermal equilibrium, . Bose effects increase by [33, 10]; an anticorrelation introduced by energy conservation in a finite system — when one mode fluctuates up it is more likely for others to fluctuate down — decreases by [10]; two-track resolution also decreases by [29]. The contributions due to correlations introduced by resonance decays and due to fluctuations in the flow velocity are each significantly smaller than [10]. We argue [10] that critical fluctuations can increase by , fifty times the statistical error in the present measurement. We have focussed on this observable because data on it has been analyzed and presented by NA49. There are, however, other observables which are much more sensitive to critical effects. For example, a , defined using only the softest of the pions in each event, may easily be affected at the factor of two level.
We have estimated the magnitude of the effect of critical fluctuations on many other observables [10], including the event-by-event fluctuations in , and the correlation between fluctuations in and . We also note one observable, the multiplicity of soft pions, which may be used to detect the critical fluctuations without an event-by-event analysis. The post-freezeout decay of sigmas, which are copious and light at freezeout near and which decay subsequently when their mass increases above twice the pion mass, should result in a population of pions with which appears only for freezeout near the critical point [10]. The variety of observables which should all show nonmonotonic behavior near the critical point is sufficiently great that if it were to turn out that MeV, making inaccessible to the SPS, all four RHIC experiments could play a role in the study of the critical point.
NA49 data demonstrates very clearly that SPS collisions at GeV do not freeze out near the critical point. has not yet been discovered. The nonmonotonic appearance and then disappearance (as is varied) of any one of the signatures of the critical fluctuations we have described would be strong evidence for critical fluctuations. If nonmonotonic variation is seen in several of these observables, with the maxima in all signatures occurring at the same value of , this would turn strong evidence into an unambiguous discovery of the critical point. The quality of the present NA49 data, and the confidence with which we can use it to learn that collisions at GeV do not freeze out near the critical point make us confident that the program of experimentation which we have described can realistically be expected to teach us much about the phase diagram of QCD, and could result in a discovery of perhaps the most fundamental feature of the landscape. Once the critical point is discovered, it will be prominent on the map of the phase diagram which will appear in any future textbook on QCD.
3 Color Superconductivity and Color-Flavor Locking
As in my talk in Torino, I devote the final Section of this review to recent developments in our understanding of the low temperature, high density regions of the QCD phase diagram. In this regime, the relevant degrees of freedom are those which involve quarks with momenta near the Fermi surface. At high density, when the Fermi momentum is large, the QCD gauge coupling is small. However, because of the infinite degeneracy among pairs of quarks with equal and opposite momenta at the Fermi surface, even an arbitrarily weak attraction between quarks which allows a pair of quarks with momenta to scatter into a pair with momenta renders the Fermi surface unstable to the formation of a condensate of quark Cooper pairs. Pairs of quarks cannot be color singlets, and in QCD with two flavors of massless quarks the Cooper pairs form in the color channel [1, 2, 3, 4]. The resulting condensate gives gaps to quarks with two of three colors and breaks to an subgroup, giving mass to five of the gluons by the Anderson-Higgs mechanism. In QCD with two flavors, the Cooper pairs are flavor singlets and the global flavor symmetry is intact. There is also an unbroken global symmetry which plays the role of . Thus, no global symmetries are broken in this 2SC phase. There must therefore be a phase transition between the 2SC and hadronic phases on the horizontal axis in Figure 1, at which chiral symmetry is restored. This phase transition is first order [3, 17, 19, 20] as is to be expected as it is characterized by a competition between chiral condensation and diquark condensation [17, 20]. There need be no transition between the 2SC and quark-gluon plasma phases in Figure 1 because neither phase breaks any global symmetries. However, this transition, which is second order in mean field theory, is likely first order in QCD [17].
In QCD with three flavors of massless quarks, the Cooper pairs cannot be flavor singlets, and both color and flavor symmetries are necessarily broken. The symmetries of the phase which results have been analyzed in [5, 6]. The attractive channel favored by one-gluon exchange exhibits “color-flavor locking.” A condensate involving left-handed quarks alone locks flavor rotations to , in the sense that the condensate is not symmetric under either alone, but is symmetric under the simultaneous rotations.444It turns out [5] that condensation in the color channel induces a condensate in the color channel because this breaks no further symmetries [7]. The resulting condensates can be written in terms of and where . Here, and are color indices running from to , and are flavor indices running from to , and the Kronecker ’s lock color and flavor rotations. A condensate involving right-handed quarks alone locks flavor rotations to . Because color is vectorial, the result is to lock to , breaking chiral symmetry.555Once chiral symmetry is broken by color-flavor locking, there is no symmetry argument precluding the existence of an ordinary chiral condensate. Indeed, instanton effects do induce a nonzero [5], but this is a small effect [34]. Thus, in quark matter with three massless quarks, the symmetry is broken down to the global diagonal group. All nine quarks have a gap. All eight gluons get a mass. There are nine massless Nambu-Goldstone bosons. There is an unbroken gauged symmetry which plays the role of electromagnetism. (Under this symmetry, all the quarks, all the massive vector bosons, and all the Nambu-Goldstone bosons have integer charges.) The CFL phase therefore has the same symmetries as baryonic matter with a condensate of Cooper pairs of baryons [6]. Furthermore, many non-universal features of these two phases correspond [6]. This raises the possibility that quark matter and baryonic matter may be continuously connected [6], as shown in Figure 4.
The physics of the CFL phase has been the focus of much recent work [5, 6, 7, 8, 34, 35, 36, 37]. Nature chooses two light quarks and one middle-weight strange quark, rather than three degenerate quarks as in Figure 4. A nonzero weakens those condensates which involve pairing between light and strange quarks. The CFL phase requires nonzero and condensates; because these condensates pair quarks with differing Fermi momenta they can only exist if they are larger than of order , the difference between the and Fermi momenta in the absence of pairing. If one imagines increasing at fixed , one finds a first order unlocking transition [7, 8]: for larger only and quarks pair and the 2SC phase is obtained. Conversely, as is reduced in going from Figure 2 to 3 to 4, the region occupied by the CFL phase expands to encompass smaller and smaller [7, 8]. For any , the CFL phase is the ground state at arbitrarily high density [7]. For larger values of , there is a 2SC interlude on the horizontal axis, in which chiral symmetry is restored, before the CFL phase breaks it again at high densities. For smaller values of , the possibility of quark-hadron continuity as shown in Figure 4 arises. It should be noted that when the strange and light quarks are not degenerate, the CFL phase may be continuous with a baryonic phase in which the densities of all the nucleons and hyperons are comparable; there are, however, phase transitions between this hypernuclear phase and ordinary nuclear matter [7].
The Nambu-Goldstone bosons in the CFL phase are Fermi surface excitations in which the orientation of the left-handed and right-handed diquark condensates oscillate out of phase in flavor space. The effective field theory describing these oscillations has recently been constructed [36]. This effective theory will be useful for many purposes, including for answering the question posed in Ref. [35]: what are the properties of the solitons, if any, in the CFL phase? The dispersion relations describing the quasiparticle excitations in the CFL phase have also received attention [7, 37]. One interesting possibility is that at the lowest densities at which the CFL phase exists, just above the first order unlocking transition between CFL and 2SC, the CFL phase may be a superconductor in the sense that all eight gluons are given a mass by the Meissner effect, but there may nevertheless be gapless quasiparticle excitations [37].
Much effort has gone into estimating the magnitude of the condensates in the 2SC and CFL phases [2, 3, 4, 5, 7, 8, 17, 20, 34, 40, 41, 42, 43, 44, 45, 46, 47, 48, 49, 50]. It would be ideal if this task were within the scope of lattice gauge theory as is, for example, the calculation of the critical temperature on the vertical axis of the phase diagram. Unfortunately, lattice methods relying on importance sampling have to this point been rendered exponentially impractical at nonzero baryon density by the complex action at nonzero .666Note that quark pairing can be studied on the lattice in some models with four-fermion interactions and in two-color QCD [38]. The case has also been studied analytically in Refs. [4, 39]; pairing in this theory is simpler to analyze because quark Cooper pairs are color singlets. The limit of QCD is often one in which hard problems become tractable. However, the ground state of QCD is not a color superconductor [51]. This is of no concern at , however: Shuster and Son [52] have shown that color superconductivity persists up to ’s of order tens of thousands before being supplanted by the phase described in Ref. [51]. In the absence of lattice methods, the magnitude of the gaps in quark matter at large but accessible density has been estimated using two broad strategies. The first class of estimates are done within the context of models whose parameters are chosen to give reasonable vacuum physics. Examples include analyses in which the interaction between quarks is replaced simply by four-fermion interactions with the quantum numbers of the instanton interaction [3, 4, 17] or of one-gluon exchange [5, 7] and more sophisticated analyses done using the instanton liquid model [20, 34]. Renormalization group methods have also been used to explore the space of all possible effective four-fermion interactions [40, 41]. These methods yield results which are in qualitative agreement: the favored condensates are as described above; the gaps range between several tens of MeV up to as large as about MeV; the associated critical temperatures (above which the diquark condensates vanish) can be as large as about MeV. This agreement between different models reflects the fact that what matters most is simply the strength of the attraction between quarks in the color channel, and by fixing the parameters of the model interaction to fit, say, the magnitude of the vacuum chiral condensate, one ends up with attractions of similar strengths in different models.
The second strategy for estimating gaps and critical temperatures is to use physics as a guide. At asymptotically large , models with short-range interactions are bound to fail because the dominant interaction is due to the long-range magnetic interaction coming from single-gluon exchange [43, 44]. The collinear infrared divergence in small angle scattering via one-gluon exchange (which is regulated by dynamical screening [44]) results in a gap which is parametrically larger at than it would be for any point-like four-fermion interaction. At , where , the gap takes the form ; the dependence was discovered in Ref. [44] and has now been confirmed using a variety of methods [47, 48, 49, 50]. A consequence of this result is that the magnitude of the condensates increases slowly as ; this means that the CFL phase is favored over the 2SC phase for for any [7]. The -independent prefactor has been estimated in Refs. [47, 48, 49]. As conjectured in [7], this prefactor is such that if this asymptotic expression is applied to accessible densities, say MeV, it predicts gaps as large as about MeV and critical temperatures as large as about MeV [47]. The weak-coupling calculation of the gap in the CFL phase is the first step toward the weak-coupling calculation of other properties of this phase, in which chiral symmetry is broken and the spectrum of excitations is as in a confined phase, like for example the coefficients in the effective field theory of Ref. [36] which describes the physics of the Nambu-Goldstone bosons.
It is satisfying that two very different approaches, one using zero density phenomenology to normalize models, the other using weak-coupling methods valid at asymptotically high density, yield predictions for the gaps and critical temperatures at accessible densities which are in good agreement. MeV is much larger relative to the Fermi momentum (say MeV) than in low temperature superconductivity in metals. This reflects the fact that color superconductivity uses attraction due to the primary, strong, interaction in the theory, rather than having to rely on much weaker secondary interactions, as in phonon mediated superconductivity in metals. Quark matter is a high- superconductor by any reasonable definition. It is unfortunate that its is nevertheless low enough that it is unlikely the phenomenon can be realized in heavy ion collisions.
Neutron stars have , relative to the scales of Figures 1-4. If they have quark matter cores, those cores are color superconductors, in either the 2SC or CFL phase. The higher temperature regions of the phase diagram are being mapped in heavy ion collisions; we need to learn how to use neutron star phenomenology to map the high density regime. The qualitative questions to which analysis of neutron star phenomenology may yet provide answers include: Does baryonic matter change continuously into quark matter in the CFL phase as a function of increasing density (increasing depth) within a neutron star? This would require that the high density region of the phase diagram be similar to Figure 4. Or, as in Figure 3, do neutron stars have a 2SC core, perhaps with a CFL inner core? Or, of course, do neutron stars not have quark matter cores at all? Further work is required. The rate of cooling of neutron stars by neutrino emission from their cores may yield useful information: both the emission rates and the heat capacity are affected by diquark condensates [53] and the cooling rates resulting in the 2SC and CFL phases differ [54]. The -mode instability is sensitive to the presence of quark matter within neutron stars [55]; it remains to be seen whether it differentiates between the 2SC and CFL phases. Pulsars are characterized by strong magnetic fields; further work is required to determine how the field configuration would be affected by the presence of a 2SC or CFL core [56], and whether the time evolution of pulsar magnetic fields would be affected.
The answer to the question of whether the QCD phase diagram does or does not feature a 2SC interlude on the horizontal axis, separating the CFL and baryonic phases in both of which chiral symmetry is broken, depends on whether the strange quark is effectively heavy or effectively light. This is the central outstanding question about how to draw the high density region of the map. The central question at higher temperatures, namely where does nature locate the critical point , also depends on the strange quark mass. Both questions are hard to answer theoretically with any confidence. The higher temperature region of the map is in much better shape, however, because the program of experimentation described in the previous Section allows heavy ion collision experiments to search for the critical point . Theorists have described how to use phenomena characteristic of freezeout in its vicinity to discover ; this enables experimentalists to answer the question of its location convincingly. The discovery of would allow us to draw the higher temperature regions of the map of the QCD phase diagram in ink. Theorists have much work to do, however, before a program of astrophysical observations which would allow the inking in of the boundaries of the 2SC and CFL phases can be proposed.
References
- [1] B. Barrois, Nucl. Phys. B129 (1977) 390. S. Frautschi, Proceedings of workshop on hadronic matter at extreme density, Erice 1978, CALT-68-701.
- [2] D. Bailin and A. Love, Phys. Rept. 107 (1984) 325.
- [3] M. Alford, K. Rajagopal and F. Wilczek, Phys. Lett. B422 (1998) 247.
- [4] R. Rapp, T. Schäfer, E. V. Shuryak and M. Velkovsky, Phys. Rev. Lett. 81 (1998) 53.
- [5] M. Alford, K. Rajagopal and F. Wilczek, Nucl. Phys. B537 (1999) 443.
- [6] T. Schäfer and F. Wilczek, Phys. Rev. Lett. 82 (1999) 3956.
- [7] M. Alford, J. Berges and K. Rajagopal, hep-ph/9903502.
- [8] T. Schäfer and F. Wilczek, hep-ph/9903503.
- [9] M. Stephanov, K. Rajagopal and E. Shuryak, Phys. Rev. Lett. 81 (1998) 4816.
- [10] M. Stephanov, K. Rajagopal and E. Shuryak, hep-ph/9903292.
- [11] For a longer review, see K. Rajagopal, in Quark-Gluon Plasma 2, (World Scientific, 1995) 484, ed. R. Hwa.
- [12] R. Pisarski and F. Wilczek, Phys. Rev. D29 (1984) 338.
- [13] For reviews, see E. Laermann Nucl. Phys. Proc. Suppl. 63 (1998) 114 and A. Ukawa, Nucl. Phys. Proc. Suppl. 53 (1997) 106.
- [14] For example, S. Gottlieb et al., Phys. Rev. D55 (1997) 6852 and R. Mawhinney, talk at ISMD99, Providence, RI, 1999.
- [15] S.P. Klevansky, Rev. Mod. Phys. 64 (1992) 649; A. Barducci, R. Casalbuoni, G. Pettini and R. Gatto, Phys. Rev. D49 (1994) 426.
- [16] M. Stephanov, Phys. Rev. Lett. 76 (1996) 4472; Nucl. Phys. Proc. Suppl. 53 (1997) 469.
- [17] J. Berges and K. Rajagopal, Nucl. Phys. B538 (1999) 215.
- [18] M. A. Halasz, A. D. Jackson, R. E. Shrock, M. A. Stephanov and J. J. M. Verbaarschot, Phys. Rev. D58 (1998) 096007.
- [19] R. Pisarski and D. Rischke, Phys. Rev. Lett. 83 (1999) 37.
- [20] G. Carter and D. Diakonov, Phys. Rev. D60 (1999) 016004.
- [21] For a review, see I. Lawrie and S. Sarbach in Phase Transitions and Critical Phenomena 9, (Academic Press, 1984) 1, ed. C. Domb and J. Lebowitz.
- [22] F. Wilczek, Int. J. Mod. Phys. A7 (1992) 3911; K. Rajagopal and F. Wilczek, Nucl. Phys. B399 (1993) 395.
- [23] F. Brown et al, Phys. Rev. Lett. 65 (1990) 2491.
- [24] JLQCD Collaboration, Nucl. Phys. Proc. Suppl. 73 (1999) 459.
- [25] Y. Iwasaki et al, Phys. Rev. D54 (1996) 7010.
- [26] See, e.g., P. Braun-Munziger and J. Stachel, Nucl. Phys. A606 (1996) 320.
- [27] M. Stephanov, private communication.
- [28] For more complete treatments of the results of Ref. [10], still shorter than Ref. [10], see M. Stephanov, hep-ph/9906242; hep-ph/9907312; K. Rajagopal, hep-ph/9903547.
- [29] NA49 Collaboration, hep-ex/9904014.
- [30] A. Bialas and V. Koch, Phys. Lett. B456 (1999) 1.
- [31] G. Baym and H. Heiselberg, nucl-th/9905022.
- [32] G. Danilov and E. Shuryak, nucl-th/9908027.
- [33] St. Mrówczyński, Phys. Lett. B430 (1998) 9.
- [34] R. Rapp, T. Schäfer, E. V. Shuryak and M. Velkovsky, hep-ph/9904353.
- [35] D. K. Hong, M. Rho and I. Zahed, hep-ph/9906551.
- [36] R. Casalbuoni and R. Gatto, hep-ph/9908227.
- [37] M. Alford, J. Berges and K. Rajagopal, hep-ph/9908235.
- [38] UKQCD Collaboration, Phys. Rev. D59 (1999) 116002; S. Hands, J. B. Kogut, M.-P. Lombardo and S. E. Morrison, hep-lat/9902034; S. Hands and S. E. Morrison, hep-lat/9902011; hep-lat/9902012; hep-lat/9905021; M.-P. Lombardo, hep-lat/9908006.
- [39] J. B. Kogut, M. A. Stephanov and D. Toublan, hep-ph/9906346.
- [40] N. Evans, S. D. H. Hsu and M. Schwetz, Nucl. Phys. B551 (1999) 275; Phys. Lett. B449 (1999) 281.
- [41] T. Schäfer and F. Wilczek, Phys. Lett. B450 (1999) 325.
- [42] N. Agasian, B. Kerbikov and V. Shevchenko, hep-ph/9902335.
- [43] R. Pisarski and D. Rischke, nucl-th/9903023.
- [44] D. T. Son, Phys. Rev. D59 (1999) 094019.
- [45] D. K. Hong, hep-ph/9812510; hep-ph/9905523.
- [46] D. K. Hong, V. A. Miransky, I. A. Shovkovy and L. C. R. Wijewardhana, hep-ph/9906478.
- [47] T. Schäfer and F. Wilczek, hep-ph/9906512.
- [48] R. Pisarski and D. Rischke, nucl-th/9907041.
- [49] W. Brown, J. Liu and H. Ren, hep-ph/9908248.
- [50] S. D. H. Hsu and M. Schwetz, hep-ph/9908310.
- [51] D. V. Deryagin, D. Yu. Grigoriev and V. A. Rubakov, Int. J. Mod. Phys. A7 (1992) 659.
- [52] E. Shuster and D. T. Son, hep-ph/9905448.
- [53] C. Schaab et al, Astrophys. J. Lett 480 (1997) L111 and references therein.
- [54] D. Blaschke and D. Voskresensky, in preparation.
- [55] J. Madsen, Phys. Rev. Lett. 81 (1998) 3311 and references therein.
- [56] M. Alford, J. Berges and K. Rajagopal, in preparation.