Predicting Proton-air Cross Sections at TeV,
using Accelerator and Cosmic Ray Data
Abstract
We use the high energy predictions of a QCD-inspired parameterization of all accelerator data on forward proton-proton and antiproton-proton scattering amplitudes, along with Glauber theory, to predict proton–air cross sections at energies near 30 TeV. The parameterization of the proton-proton cross section incorporates analyticity and unitarity, and demands that the asymptotic proton is a black disk of soft partons. By comparing with the p-air cosmic ray measurements, our analysis results in a constraint on the inclusive particle production cross section.
Cosmic ray experiments measure the penetration in the atmosphere of particles with energies in excess of those accelerated by existing machines—interestingly, their energy range covers the energy of the Large Hadron Collider (LHC) and extends beyond it. However, extracting proton–proton cross sections from cosmic ray observations is far from straightforward [1]. By a variety of experimental techniques, cosmic ray experiments map the atmospheric depth at which cosmic ray initiated showers develop. The measured shower attenuation length () is not only sensitive to the interaction length of the protons in the atmosphere (), with
| (1) |
but also depends on the rate at which the energy of the primary proton is dissipated into electromagnetic shower energy observed in the experiment. The latter effect is parameterized in Eq. (1) by the parameter ; is the proton mass and the inelastic proton-air cross section. The value of depends on the inclusive particle production cross section in nucleon and meson interactions on the light nuclear target of the atmosphere and its energy dependence. We here ignored the fact that particles in the cosmic ray ”beam” may be nuclei, not just protons. Experiments allow for this by omitting from their analysis showers which dissipate their energy high in the atmosphere, a signature that the initial energy is distributed over the constituents of a nucleus.
The extraction of the pp cross section from the cosmic ray data is a two step process. First, one calculates the -air total cross section from the measured inelastic cross section
| (2) |
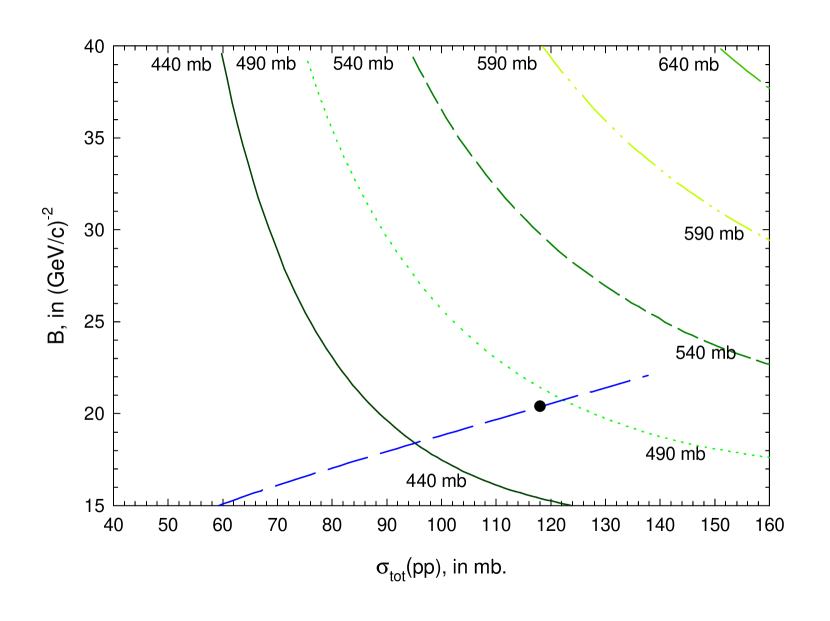
Next, the Glauber method[2] is used to transform the measured value of into a proton–proton total cross section ; all the necessary steps are calculable in the theory. In Eq. (2) the measured cross section for particle production is supplemented with and , the elastic and quasi-elastic cross section, respectively, as calculated by the Glauber theory, to obtain the total cross section . The subsequent relation between and involves the slope of the forward scattering amplitude for elastic scattering, ,
| (3) |
and is shown in Fig. 1, which plots against , for 5 curves of different values of . This summarizes the reduction procedure from to [1]. Also plotted in Fig. 1 is a curve of vs. which will be discussed later.
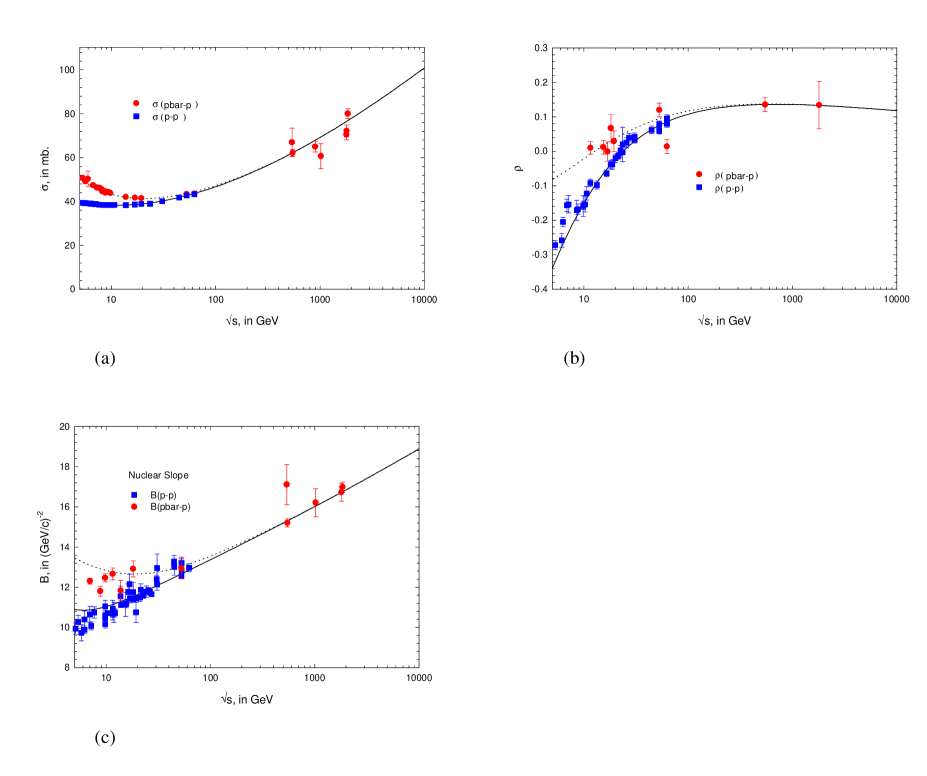
A significant drawback of the method is that one needs a model of proton–air interactions to complete the loop between the measured attenuation length and the cross section , i.e., the value of in Eq. (1). A proposal to minimize the impact of theory is the topic of this letter. We have constructed a QCD-inspired parameterization of the forward proton–proton and proton–antiproton scattering amplitudes[3] which is analytic, unitary and fits all data of , and , the ratio of the real-to-imaginary part of the forward scattering amplitude; see Fig. 2. We emphasize that all 3 quantities are simultaneously fitted. Using vector meson dominance and the additive quark models, it accommodates a wealth of data on photon-proton and photon-photon interactions without the introduction of new parameters[4]. Because the model is both unitary and analytic, it has high energy predictions that are essentially theory–independent. In particular, it also simultaneously fits and , forcing a relationship between the two. Specifically, the vs. prediction of the model is shown as the dashed curve in Fig. 1. The dot corresponds to our prediction of and at = 30 TeV. It is seen to be slightly below the curve for 490 mb, the lower limit of the Fly’s Eye measurement, which was made at 30 TeV. The percentage error in the prediction of at TeV is %, due to the statistical error in the fitting parameters (see references [3],[4]).
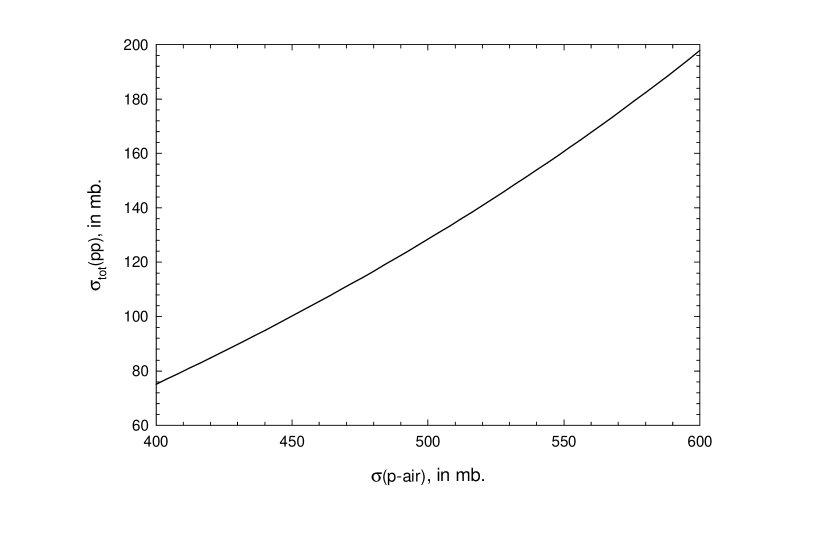
In Fig. 3, we have plotted the values of vs. that are deduced from the intersections of the - curve with the curves of Fig. 1. Figure 3 allows the conversion of the measured to . The percentage error in is % near mb, due to the error in from the model parameter uncertainties.
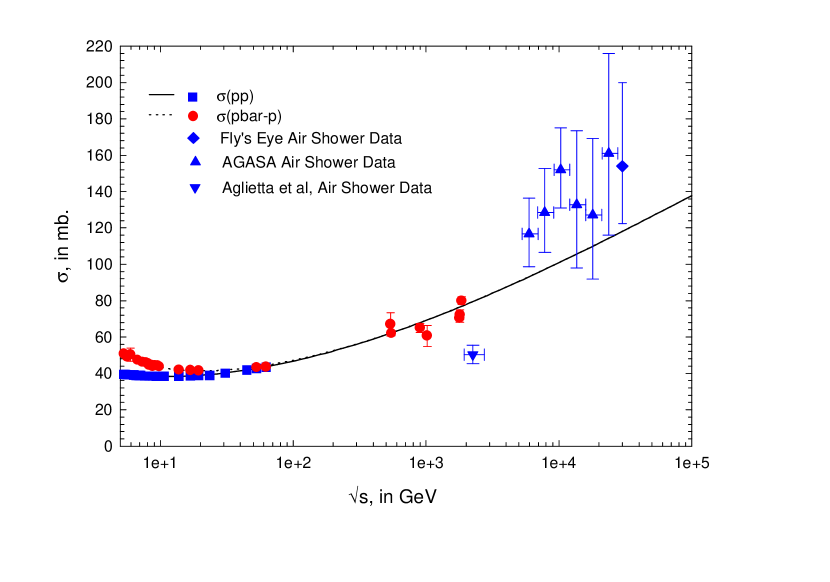
Our prediction for the total cross section as a function of energy is confronted with all of the accelerator and cosmic ray measurements[5, 6, 7] in Fig. 4. For inclusion in Fig. 4, we have calculated the cosmic ray values of from the published experimental values of , using the results of Fig. 3. We note the systematic underestimate of the cosmic ray points, roughly about the level of one standard deviation.
It is at this point important to recall Eq. (1) and consider the fact that the extraction of from the measurement of requires a determination of the parameter . The measured depth at which a shower reaches maximum development in the atmosphere, which is the basis of the cross section measurement in Ref. [5], is a combined measure of the depth of the first interaction, which is determined by the inelastic cross section, and of the subsequent shower development, which has to be corrected for. The position of also directly affects the rate of shower attenuation with atmospheric depth which is the alternative procedure for extracting .
The model dependent rate of shower development and its fluctuations are the origin of the deviation of from unity in Eq. (1). Its values range from 1.5 for a model where the inclusive cross section exhibits Feynman scaling, to 1.1 for models with large scaling violations[1]. The comparison between data and experiment in Fig. 4 is further confused by the fact that the AGASA[6] and Fly’s Eye[5] experiments used different values of in the analysis of their data, i.e., AGASA used and Fly’s Eye used .
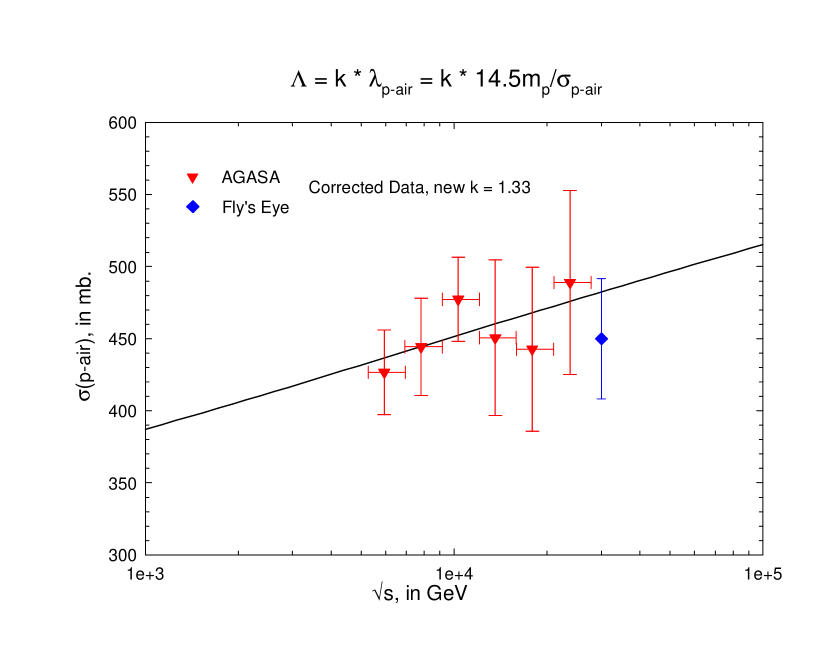
We therefore decided to match the data to our prediction and extract a common value for . This neglects the possibility that may show a weak energy dependence over the range measured. By combining the results of Fig. 2 (a) and Fig. 3, we can plot our prediction of vs. . To obtain , we leave it as a free parameter and make a fit to the rescaled high energy cosmic ray data for . In Fig. 5 we have replotted the published high energy data for , against our prediction of vs. , using the common value of , obtained from a fit. The error of is the statistical error of the fit, whereas the error of is the systematic error due to the error in the prediction of . Clearly, we have an excellent fit, with good agreement between AGASA and Fly’s Eye. The analysis gives for 6 degrees of freedom (the low is probably due to overestimates of experimental errors). Of course, the improved fit of the cosmic ray data has no effect on the fit to the accelerator data.
Our result for is interesting—it is close to the value of obtained using the SIBYLL simulation[8] for inclusive particle production. This represents a consistency check in the sense that our model for forward scattering amplitudes and SYBILL share the same underlying physics. The increase of the total cross section with energy to a black disk of soft partons is the shadow of increased particle production which is modeled by the production of (mini)-jets in QCD. The difference between the values of 1.20 and 1.33 could be understood because the experimental measurement integrates showers in a relatively wide energy range, which tends to increase the value of .
We predict mb for the total cross section at LHC energy (14 TeV), where the error is due to the statistical errors of the fitting parameters. In the near term, we look forward to the possibility of repeating this analysis with the higher statistics of the HiRes [9] cosmic ray experiment that is currently in progress and the Auger [10] Observatory.
Acknowledgments
This research was supported in part by the U.S. Department of Energy under Grants No. DA-AC02-76-ER02289 Task B and No. DE-FG02-95ER40896 and in part by the University of Wisconsin Research Committee with funds granted by the Wisconsin Alumni Research Foundation. The research of TS is supported in part by the U.S. Department of Energy under Grant No. DE-FG02-91ER40626. One of us (MMB) would like to thank the Aspen Center for Physics for its hospitality during the preparation of this manuscript.
REFERENCES
- [1] R. Engel et al., Phys. Rev. D58 014019, 1998.
- [2] T. K. Gaisser et al., Phys. Rev. D36, 1350, 1987.
- [3] M. M. Block et al., Phys. Rev. D45, 839, 1992.
- [4] M. M. Block et al., Photon-proton and photon-photon scattering from nucleon-nucleon forward amplitudes, e-Print Archive: hep-ph/9809403, Phys. Rev. D,60 054024, 1999.
- [5] R. M. Baltrusaitis et al., Phys. Rev. Lett. 52, 1380, 1984.
- [6] M. Honda et al., Phys. Rev. Lett. 70, 525, 1993.
- [7] M. Aglietta et al, Proc 25th ICRC (Durban) 6, 37, 1997.
- [8] R. S. Fletcher et al., Phys. Rev. D50, 5710, 1994.
- [9] See http://sunshine.chpc.utah.edu/research/cosmic/hires/
- [10] The Pierre Auger Project Design Report, Fermilab report (Feb. 1997).