Measurement of the diffractive structure function
Abstract
Measurements of the diffractive structure function , describing the process , are presented in the two kinematic regions , , , and , , both with , and . Together with published measurements at intermediate , the data are compared with models based on QCD and Regge phenomenology. The diffractive trajectory is found to have an intercept larger than that describing soft hadronic data and consistent with that determined using previously published H1 measurements at intermediate alone. The data are also parameterised using a QCD motivated model based on the exchange of two gluons from the proton. In this model, the higher twist contribution to at large is found to be important at low . The data are also compared with models based on BFKL dynamics.
1 Diffractive structure function measurement
In this paper, we report measurements of the diffractive structure function based on deep-inelastic scattering (DIS) data taken between 1995 and 1997 by the H1 collaboration. The measurement describes the process . As in our previous analysis of 1994 data [1], the two distinct hadronic systems and are separated by the largest interval in rapidity between final state hadrons. The system is closest to the direction of the outgoing proton beam.
The kinematics of the process can be described by the invariant masses and of the systems and , and the Lorentz scalars
| (1) | |||||
| (2) |
where and are the 4-momenta of the incident proton and electron respectively, is the 4-momentum of subsystem and is the 4-momentum of the exchanged virtual photon coupling to the electron. The measurements presented here are corrected to the region and . The following variables are also defined:
| (3) | |||||
| (4) |
where is the center of mass energy squared of the virtual photon-proton system, the proton mass and is the Bjorken scaling variable.
During the 1994/95 HERA shutdown, the backward region of the H1 detector [2] (the direction of the outgoing electron beam) was upgraded, allowing an extension of the measurement to lower and values compared to 1994 [3]. Using data taken during a period when the interaction vertex was shifted by in the proton beam direction, the accessible kinematic range is extended still further. The minimum value of at which is measured is thus reduced by a factor 10 and the minimum by a factor 40 compared to the previous measurement [1].
The good running of the HERA machine in recent years has enabled a large increase in the integrated luminosity recorded by H1. One impact of this increase in statistics is the extension of the accessible kinematic range to higher values of . A measurement of for is presented in this paper, based on positron-proton scattering data collected in the years 1995-1997. This data sample represents an increase in statistics by a factor of around 15 compared to previous H1 measurements [1].
The structure function is calculated from the differential cross section according to the formula
| (5) |
taking the ratio of the longitudinal to the transverse cross sections to be 0.
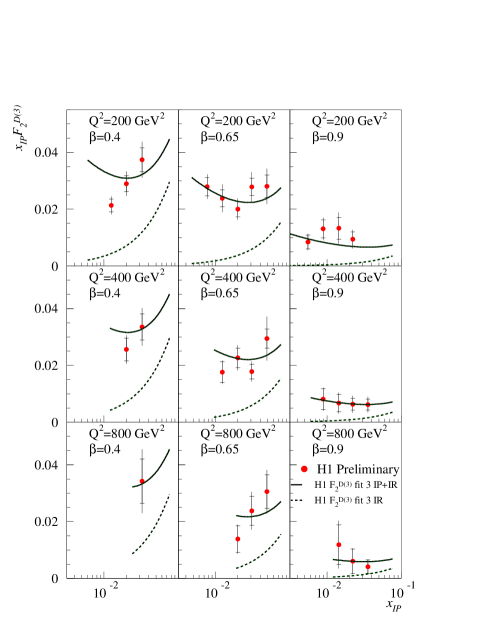
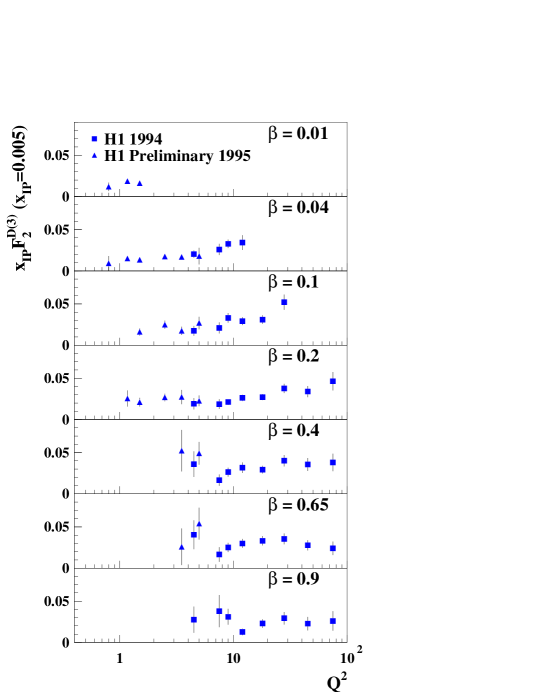
The high data are shown in the form of in figure 1. Due to the kinematic constraints imposed by the large values, the measurements are restricted to and relatively large . In Figure 2, the and dependences of the 1994 and low 1995 measurements of are shown at a fixed small value of (), for which sub-leading exchange contributions are small. We clearly see changes of slopes of scaling violations at low ( GeV2). In the large , low region, additional structures are observed. These are presumably related to higher twist contributions, in particular, the resonant production of vector mesons.
2 Interpretation and comparison with models
The results are first used to further constrain the Regge phenomenological model investigated previously [1]. A fit to the combined 1994/1995 points of a single pomeron trajectory with intercept is not able to describe the data. Addition of a sub-leading (reggeon) trajectory with independent normalisation yields a significantly better description. The intercept trajectories are consistent with the published values [1]. Fits with zero and maximal interference between the two trajectories describe the data equally well. An extension to the fit in which the pomeron intercept takes the form gives a value of compatible with zero.
The scaling violations of as a function of motivate an analysis of the data in which the and dependence of the structure function is understood in terms of parton distribution functions for the pomeron, evolved with perturbative QCD. The quark flavour-singlet and gluon distributions are evolved in with the NLO DGLAP equations and fitted, in combination with a reggeon contribution, to the combined data. The extracted parton density functions indicate a large gluonic content () of the pomeron.
Then we consider the two gluon exchange model for interaction. In a recent paper [5], a parameterization of the diffractive structure function in terms of three main contributions was proposed. The photon fluctuates into partonic states which scatter diffractively. At the beginning of the scattering process, the photon splits into a pair, and at sufficient , the pair can radiate an additional gluon before it reaches the proton at rest. At small diffractive masses, it is expected that the longitudinal cross section for pair production is not small compared to the transverse cross section, this third term appear to be a higher twist contribution. A fit is performed to the combined 1994 and 1995 data with the restriction to remain in the domain of perturbative QCD. Two solutions are found (see figure 3) corresponding to large and low where is a parameter which describes the dependance of the contribution.
The 1994 and 1995 measurements of are also compared with two additional models, the QCD dipole model in which the diffractive interaction is based on BFKL [4] dynamics [6] and the model of Nikolaev et al. [7] (see figure 3). The distinction between these models will be hardly feasible using data alone. Final state and longitudinal structure function measurement may give more hints to distinguish between them.
References
- [1] H1 Collab., C.Adloff et al., Z. Phys. C76 (1997) 613.
- [2] H1 Collab., I.Abt et al., Nucl. Instr. and Meth. A386 (1997) 310 and 348.
- [3] T.Nicholls, PhD Thesis, Univ. of Birmingham, April 1997, M.Dirkmann, PhD Thesis, Univ. of Dortmund, 1997, C.Royon, habilitation thesis, University of Orsay, April 1998.
-
[4]
V.S.Fadin, E.A.Kuraev, L.N.Lipatov
Phys. Lett. B60 (1975) 50.
I.I.Balitsky, L.N.Lipatov, Sov. J. Nucl. Phys. 28 (1978) 822. -
[5]
J.Bartels, J.Ellis, H.Kowalski, M.Wuesthoff, preprint
DESY 98-034,
J.Bartels, C.Royon, preprint DESY 98-152 - [6] A.Bialas, R.Peschanski, C.Royon, Phys. Rev. D57 (1998) 6899, H.Navelet, R.Peschanski, Ch.Royon, S.Wallon, Phys. Lett. B385 (1996) 357, S.Munier, R.Peschanski, C.Royon, Nucl. Phys. B534 (1998) 297.
-
[7]
M.Bertini et al., Phys. Lett. B422 (1998) 238
M.Genovese, N.N.Nikolaev, J. Exp. Theor. Phys. 81 (1995) 633.