DTP/99/64
OUTP/9931P
RAL-TR-1999-047
hep-ph/9907231
July 1999
Parton Distributions and the LHC: and Production
A. D. Martina, R. G. Robertsb, W. J. Stirlinga,c and R. S. Thorned
Department of Physics, University of Durham,
Durham, DH1 3LE
Rutherford Appleton Laboratory, Chilton,
Didcot, Oxon, OX11 0QX
Department of Mathematical Sciences, University of Durham, Durham, DH1 3LE
Jesus College, University of Oxford, Oxford, OX1 3DW
and bosons will be produced copiously at the LHC proton-proton collider. We study the parton distribution dependence of the total production cross sections and rapidity distributions, paying particular attention to the uncertainties arising from uncertainties in the parton distributions themselves. Variations in the gluon, the strong coupling, the sea quarks and the overall normalisation are shown to lead to small but non-negligible variations in the cross section predictions. Ultimately, therefore, the measurement of these cross sections will provide a powerful cross check on our knowledge of parton distributions and their evolution.
1. Introduction
A precise knowledge of parton distribution functions (pdf’s) is absolutely vital for reliable predictions for signal and background cross sections at the LHC. Uncertainties can arise both from the starting distributions, obtained from a global fit to deep inelastic scattering and other data, and from DGLAP evolution to the higher scales typical of LHC hard scattering processes.
There are several reasons why it is very difficult to derive ‘one sigma’ errors on parton distributions of the form . In the global fit there are complicated correlations between a particular pdf at different values, and between the different pdf flavours. To give an example: the charm distribution is correlated with the gluon distribution, the gluon distribution at low is correlated with the gluon at high via the momentum sum rule, etc. Secondly, many of the uncertainties in the input data or fitting procedure are not ‘true’ errors in the statistical sense. To give an example: the uncertainty in the high– gluon in the MRST fits [1] derives from a subjective assessment of the impact of ‘intrinsic ’ on the prompt photon cross section.
However, faced with the difficulties in trying to formulate global pdf errors, what one can do is make a detailed assessment of the pdf uncertainty for a particular cross section of interest, by determining which partons contribute and at what and values, and then systematically tracing back to the data sets that constrained the distributions in the global fit. Individual pdf sets can then be constructed to reflect the uncertainty in the particular partons determined by a particular data set (see Section 2). The purpose of this paper is to show how this can be done for the particular (test) case of and production at the LHC. The advantage of choosing these cross sections is that the theoretical technology for calculating them is very robust. The total cross sections are known to NNLO in QCD perturbation theory [2], and the input electroweak parameters (, weak couplings, etc.) are known to high accuracy. The complete electroweak radiative corrections are known, see for example Ref. [3].111Since the electroweak radiative corrections depend on the nature of, and experimental cuts on, the final state and decay products [3], we do not include them in our study. Theoretically, therefore, the main uncertainty derives from the input pdfs and, to a lesser extent, .222The two are of course correlated, see for example [1].
Knowledge of the uncertainty on the theoretical prediction allows one to assess the impact of an eventual experimental measurement. For example, with what precision would a measurement of, say, have to be made to provide an additional constraint on the pdfs? We will not address any experimental issues here. Some studies of the likely experimental precision have already been performed, see for example Ref. [4], with encouraging results.
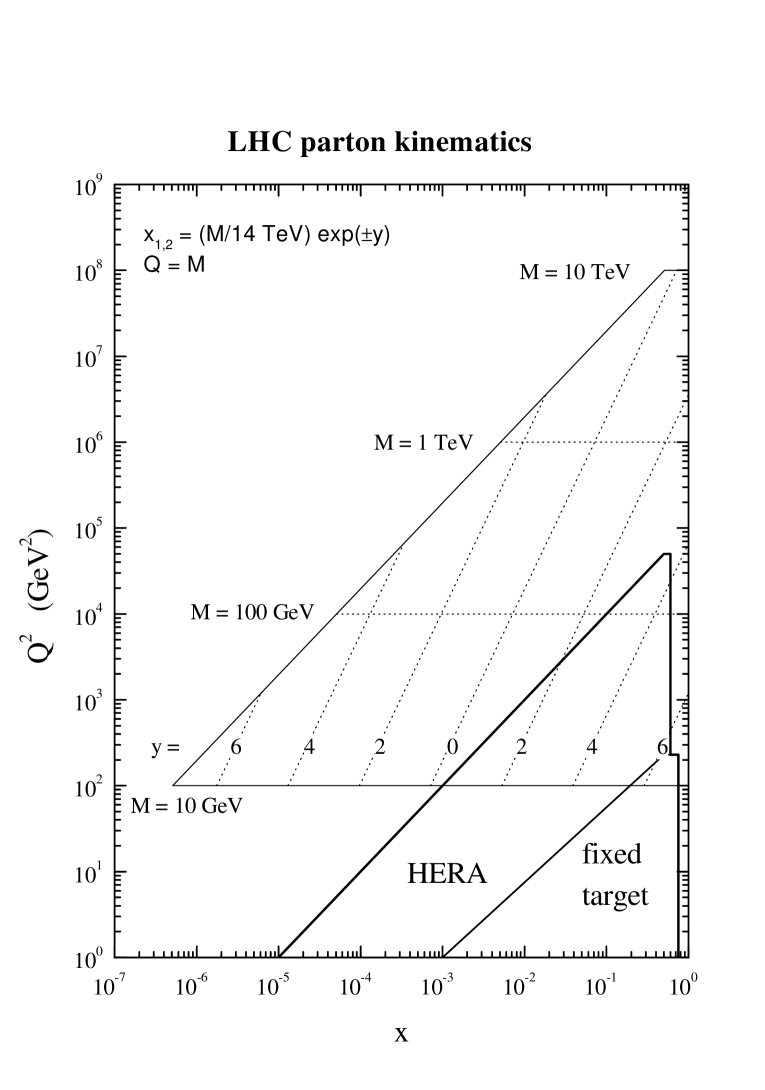
Before discussing the and cross sections in detail, we begin with some general remarks about the range of and values that are probed by LHC cross sections. Figure 1 shows the values corresponding to the production of a heavy object (e.g. a or Higgs boson, a pair, a multijet final state etc.) of mass and rapidity . We assume leading order kinematics, so that and . As an example, a boson () produced at rapidity corresponds to the annihilation of quarks with and , probed at . Notice that quarks with these values are already ‘measured’ in deep inelastic scattering (at HERA and in fixed–target experiments respectively), but at much lower , see Fig. 1.
2. Parton sets used in this study
In Ref. [1] we presented a set of pdfs, labelled MRST, that gave the best overall fit to the global set of data in that analysis. Associated with this set was a ‘central’ gluon distribution (at the starting scale of GeV2) and a ‘central’ value of . This set resulted from a NLO analysis in the scheme and we can regard this particular set as a base from which we wish to explore the degree of latitude that relevant parameters can range over while still maintaining an acceptable description of all the data. Already two degrees of freedom were explored in Ref. [1], (i) the variation of the average transverse momentum in prompt photon production, which resulted in a range of gluon distributions at large , and (ii) the variation in the value of . These uncertainties were reflected in alternative sets of pdfs MRST(), MRST(), MRST() and MRST() in which the extremes of an allowed range of values are taken and still yield acceptable fits. Again these sets were relevant to a NLO analysis in the scheme.333In ref. [5] we extended the analysis to provide equivalent sets of pdfs in the DIS scheme and also at LO.
As we shall see below, the level of precision with which we should be able to make predictions for and cross sections at the Tevatron and LHC is of the order of . It goes without saying that the numerical precision with which the pdfs are extracted and evolved should be much smaller than this. It is therefore worrying that a comparison of the values obtained using the default MRST partons and the recent (default) CTEQ5 partons [6] reveals differences at the level of , even though the data sets, theoretical assumptions and fitting procedures are largely the same in the two analyses. This difference has prompted us to re-examine the numerical accuracy of the MRST evolution code. As a result we discovered two small errors which affect the resulting pdfs at the level. Further details can be found in the Appendix. The basic five parton sets used in this analysis are not therefore the five sets presented in Ref. [1], but rather their corrected versions, which we denote by MRST99, MRST99(), …etc.444The FORTRAN code for all the MRST99 parton sets described in this paper can be obtained from http://durpdg.dur.ac.uk/HEPDATA/PDF, or by contacting W.J.Stirling@durham.ac.uk. The and Tevatron total cross section predictions using the MRST99 sets are some larger than the corresponding MRST values presented in Ref. [1].555In contrast, the LHC cross sections are essentially unchanged, due to a slight dependence of the correction factor. The difference between the CTEQ5 and MRST cross sections is only slightly reduced by using the corrected MRST99 partons. We will return to this below.
Varying the gluon and about their central values does not span the full range of uncertainties in the pdfs. Obviously, varying the normalisation of sets of input data to the analysis will result in a corresponding variation of the output pdfs and so this is an additional degree of uncertainty which we now explore. Since in this work we are primarily interested in uncertainties which most affect and production at collider energies, i.e. uncertainties at small , we focus mainly on the normalisations of the HERA structure function data. The quoted normalisation uncertainties of from H1 and ZEUS vary with , but a mean value of 2.5% [7, 8] is appropriate. We then proceed to make two fits to all the data where we renormalise the HERA data first upwards by 1.025, and then downwards by 0.975, and allow the normalisations of the remaining DIS datasets to vary within their quoted uncertainties in order to get the best fit. We label these two pdf sets as MRST() and MRST().
In Figs. 2 and 3 we show comparisons of these two pdf sets with the default set at two values of , a low value typical of the range of the fitted DIS data, and a high value typical of that probed in , production at hadron colliders. One can see that when and increase to describe the larger , momentum conservation demands a decrease in the gluon distribution and vice versa. Because of the way charm and bottom pdfs are generated (by photon–gluon fusion), the heavy flavour pdfs simply ‘mirror’ the modified gluon. Increasing the normalisation also produces, at large , a slightly increased ratio (and vice versa) but this corresponds to a very small variation of . For example, at and GeV2, .
This variation of the normalisation effectively implies that the pdf sets MRST() and MRST() give a measure of overall uncertainty on the and quarks. Next we try to get a corresponding measure of uncertainty on the strange quark distribution. The strange sea is assumed to be identical in shape to the non-strange sea at the starting scale , but there is a strong flavour asymmetry due presumably to the larger mass of the strange quark. A suppression factor , at GeV2 of 0.5 is consistent with the di-muon production data of CCFR [9]. Fig. 4 shows that a variation of this suppression is a realistic measure of the uncertainty in the CCFR estimate. Consequently we provide two more sets of pdfs corresponding to these upper and lower estimates for the strange sea suppression, labelled MRST() and MRST()
The only parameter characterising the charm distribution in the MRST analysis is the charm mass, . In the updated default set GeV and we find a satisfactory description of provided the variation of is within 0.15 GeV [10]. So to complete our family of pdfs which explore individual degrees of uncertainty, we provide two sets MRST() and MRST() in which = 1.28 and 1.58 GeV respectively. A summary table of this ‘MRST family’ is given in Table 1. Note that an additional set MRST()) will be introduced and described in Section 4.
| set | comment | |
|---|---|---|
| MRST | 0.1175 | default set |
| MRST() | 0.1175 | larger gluon at large |
| MRST() | 0.1175 | smaller gluon at large |
| MRST() | 0.1225 | larger |
| MRST() | 0.1125 | smaller |
| MRST() | 0.1178 | larger () quarks at large |
| MRST() | 0.1171 | smaller () quarks at large |
| MRST() | 0.1175 | larger () strange quarks |
| MRST() | 0.1175 | smaller () strange quarks |
| MRST() | 0.1175 | larger charm quarks ( GeV) |
| MRST() | 0.1175 | smaller charm quarks ( GeV) |
| MRST() | 0.1175 | larger ratio at large |
3. and total cross sections
The total and cross sections probe quark distributions in a fairly narrow region around and at .666For the subset of s and s produced with large transverse momentum the next-to-leading order scattering processes are also important, and as a result there is additional sensitivity to the gluon distribution in roughly the same region – we will not discuss this further here. The inclusive rapidity distributions select particular values of parton (see Fig. 1) but, at least in the case of production, are presumably more difficult to measure. They will be discussed in the following section.
We have already argued that the dominant theoretical uncertainty comes from parton distributions, and so we fix all electroweak parameters at standard values 777The Standard Model values and are used. The electroweak boson masses are taken to be and . and vary only the input pdfs (and where appropriate).
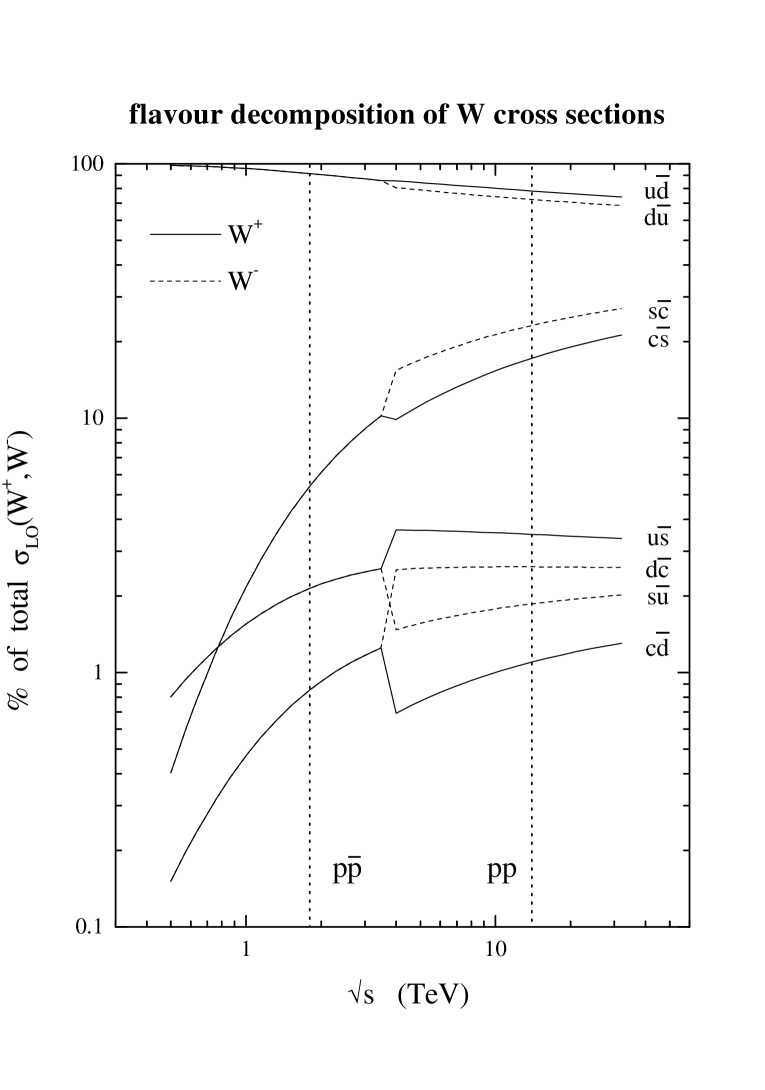
First, we consider the parton flavour decomposition of , and . Since the cross sections are dominated by the leading-order processes, it is sufficient to consider the relative contributions of these to the total. Figures 5 and 6 show how the relative contributions of the various processes change with collider energy. We split the collider energy range at , and assume proton–antiproton and proton–proton collisions below and above this value. For production (Fig. 5) we see that the and contributions dominate at all collider energies. These are dominated by valence–valence and valence–sea scattering at and colliders respectively. The next largest contributions come from and . Although these are sea–sea processes, they dominate the Cabibbo suppressed etc. valence–sea contributions. Perhaps the most significant result from Fig. 5 is that strange–charm scattering is a relatively large component of the total cross sections at LHC — approximately for and for . This contrasts with their contribution at the Tevatron. The remaining scattering processes contribute between and at LHC.
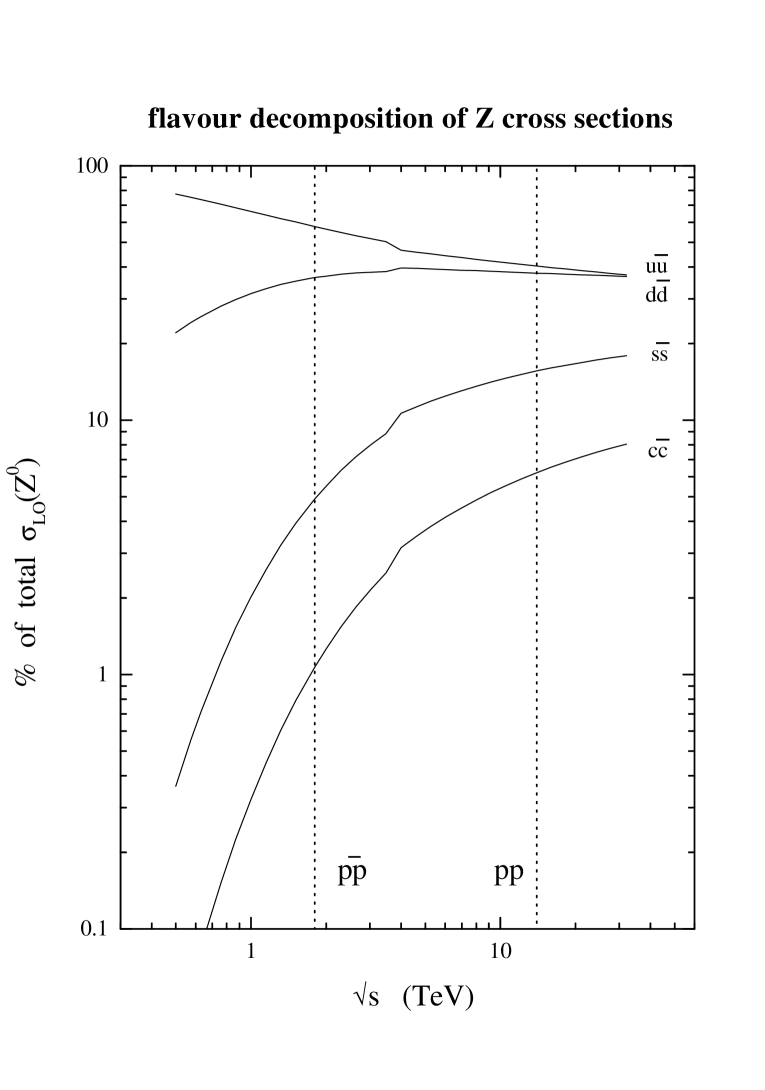
The corresponding situation for production is somewhat simpler, see Fig. 6. At LHC energies we have , in line with the ordering of the parton distributions at the relevant and values.888Note that the weak neutral couplings are slightly different for – and –type quarks, and are taken into account in the curves shown in Fig. 6. At the Tevatron, the and contributions are relatively smaller, and the contribution is correspondingly larger.
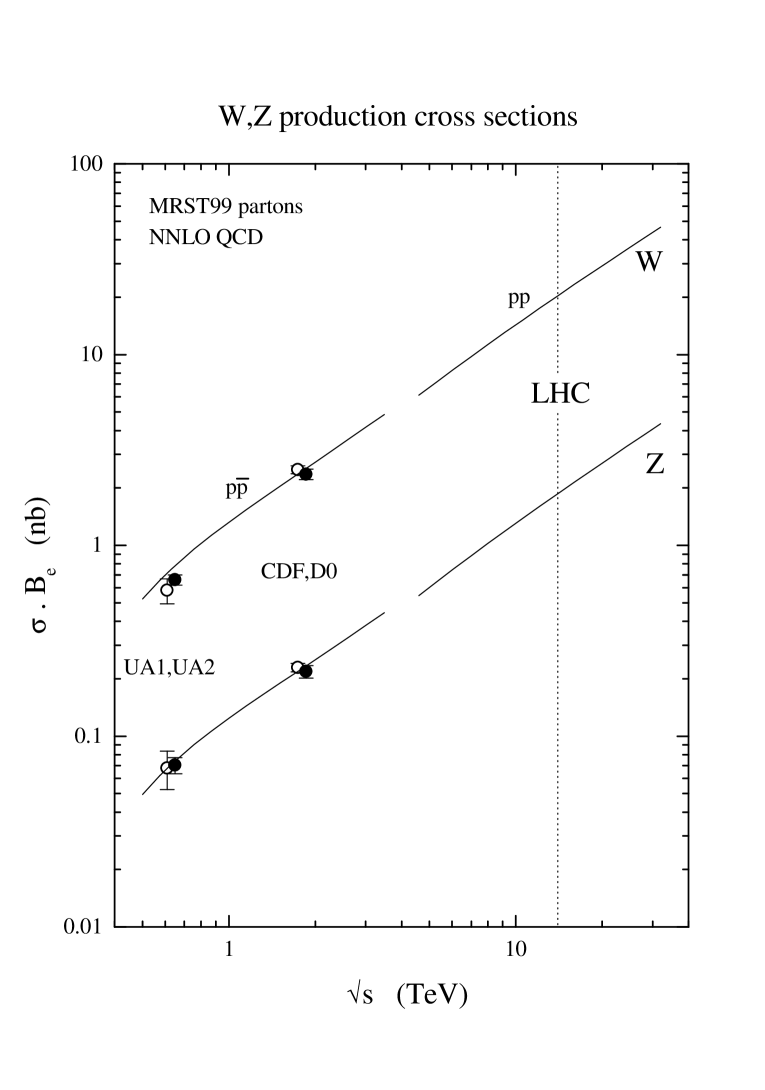
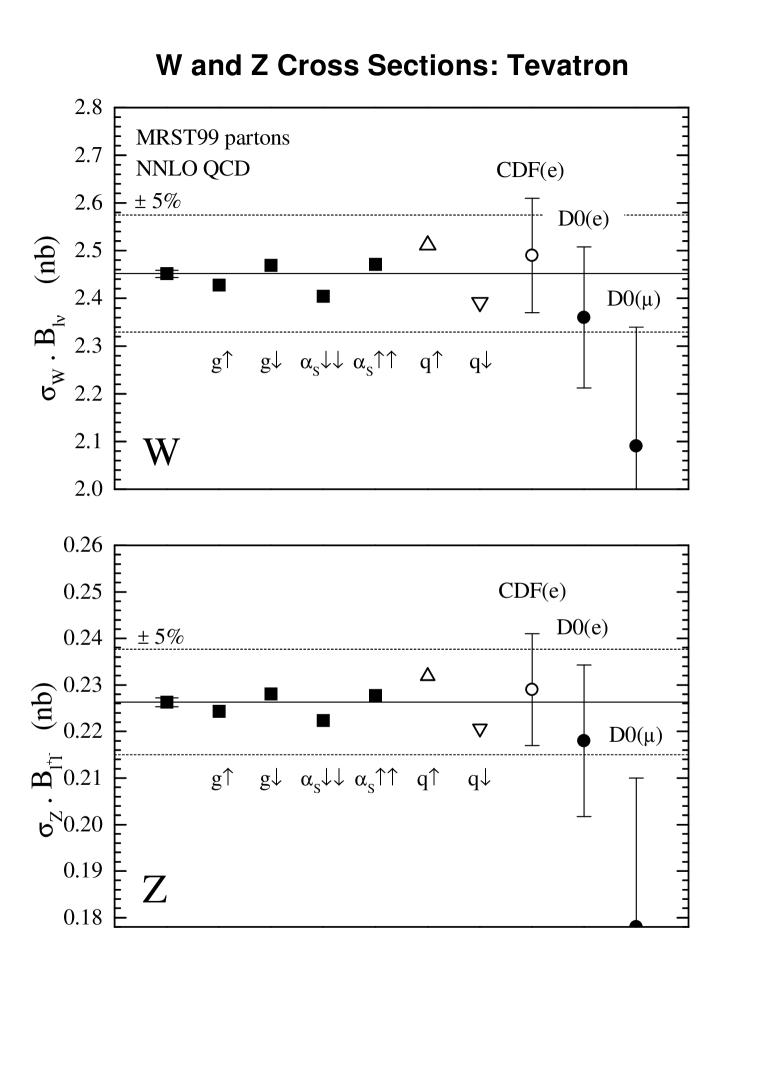
We have already shown in Ref. [1] that the Standard Model predictions for and at the Tevatron () using the default MRST98 pdf set are in excellent agreement with the CDF and D0 measurements. Here we repeat the comparison now including the extended set of MRST99 pdfs described in the previous section (and the Appendix). From Fig. 5, we would not expect any significant effect from varying the charm and strange partons, and indeed the and cross sections calculated with the sets agree with the default MRST99 cross section to within less than one percent. On the other hand, the effect of changing the overall quark normalisation should be directly reflected in the cross sections. Figs. 8 shows the predictions of the first seven MRST99 sets (the default MRST99 set, together with six other sets () listed in Table 1) for and , together with the experimental data, all normalised to .999Note that an important component of the experimental error is due to the luminosity measurement and uncertainty. The latter is quoted as for CDF and for D0 [13, 14]. In addition, the value assumed for the total cross section is slightly different for the two experiments, and this may account in part for the systematically smaller D0 cross sections displayed in Fig. 8. There is an overall spread of approximately about the default prediction,101010A measure of the scale dependence of these predictions is obtained by using instead and . The effect is shown as error bars on the default prediction and is evidently very small. significantly smaller than the current experimental errors. The variations in the predictions are easily understood. At these (small) values, the quark distributions increase with increasing . The larger the the faster the increase, and so . The different gluon distributions also give rise to differences in the predictions. In this region, the ordering of the gluon distributions is , see Fig. 2 of Ref. [1] The larger the gluon the more rapid the DGLAP evolution, and so . The gluon variation is slightly smaller than the variation. The largest variation (approximately ) comes from the overall quark normalisation. Naively, one might have expected a variation twice as large, reflecting the variation in the and partons near the starting scale, but the effect of DGLAP evolution to is to suppress the differences.
We may conclude from Fig. 8 that the net uncertainty in the predictions at the Tevatron is no more than about and is largely due to the normalisation uncertainty in the input and distributions, although DGLAP evolution dilutes this effect by about a factor of 2.
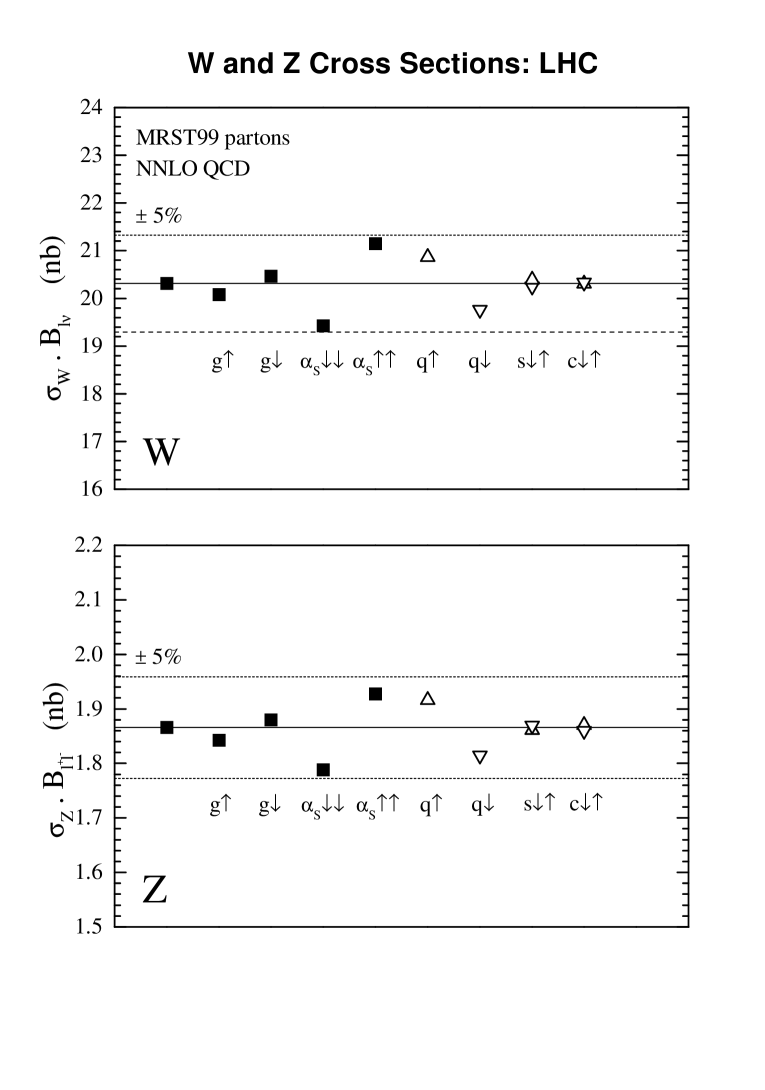
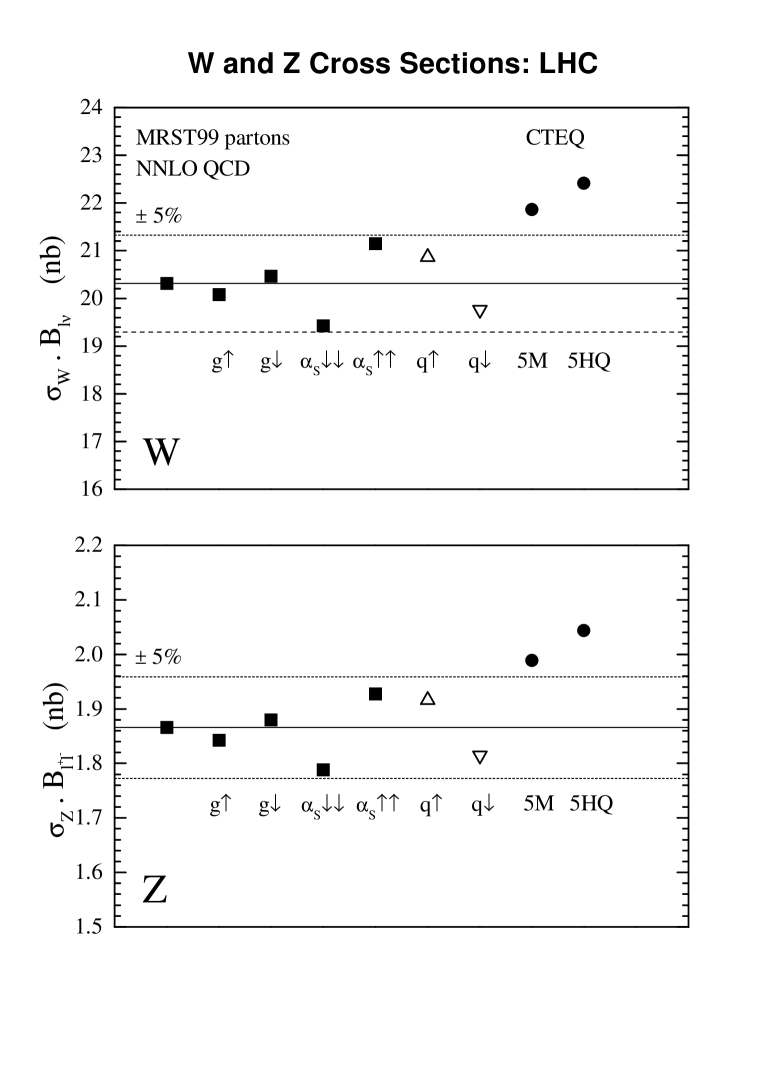
Figure 9 shows the corresponding total cross sections at the LHC collider. We have now also included the predictions from the sets, but again we see that the effect on the total cross section is minimal. Even though the strange–charm contribution is relatively more important, DGLAP evolution has reduced the variation in the partons themselves. Interestingly the variations in the cross sections due to the gluon and the quark normalisation are approximately the same as at the Tevatron, but now the largest variation comes from . the reason for this is that DGLAP evolution is more rapid at the smaller values probed at the LHC: schematically we have where the (positive at small ) coefficient increases as decreases. Therefore the effect on the evolved of varying is magnified as decreases. Bearing in mind that our variation is somewhat conservative (the ‘world average’ error is now regularly quoted as or even less), it would appear from Fig. 9 that is a reasonable upper limit on the pdf uncertainty on at LHC.
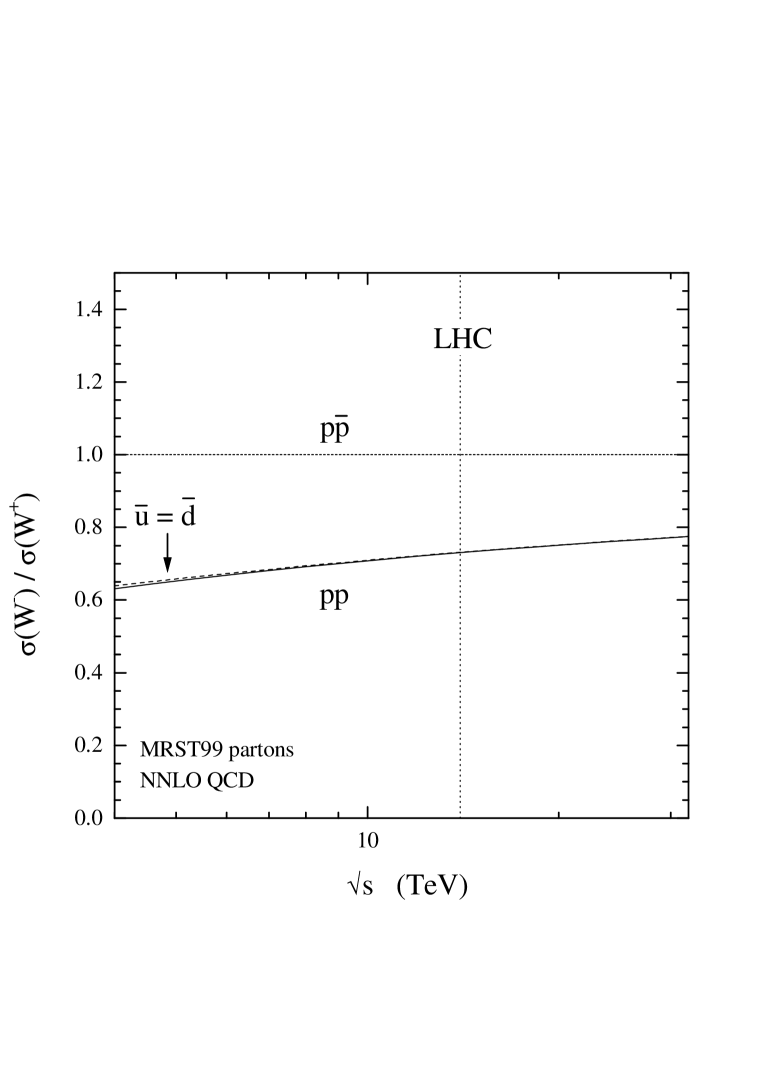
In Fig. 9 the (unequal) and cross sections have been added together. It is interesting to consider what can be learned from the difference between these, in particular from the ratio . Ignoring the contributions from strange–charm scattering (which contribute equally to and ), we have
| (1) |
Notice that in the region of we are considering, both fractions on the right-hand side are . This raises the question of whether we can obtain any information on the ratio , assuming that is already well pinned down. Figure 10 shows the (proton–proton) collider energy dependence of the cross section ratio calculated using MRST (solid curve). For comparison we also show (dashed curve) the predictions for a modified version of MRST in which is set equal to .111111Formally, we replace the and pdfs appearing in the cross section expressions by their average. Unfortunately the difference is small, and decreases with increasing . The reason for this is that in the MRST fits, it is assumed that the asymmetry goes rapidly to zero as . This trend is certainly suggested by the E866 Drell-Yan asymmetry data [15]. However these data extend down only to , well above the region probed by at LHC. In principle one could investigate the effect of ‘pathological’ behaviour of as on .
At TeV, the predictions for using all twelve MRST sets listed in Table 1 lie in the range
| (2) |
with the central value corresponding to the MRST prediction. Evolution, normalisation etc. effects all tend to cancel in the ratio, leaving this as a ‘gold-plated’ prediction of the Standard Model.
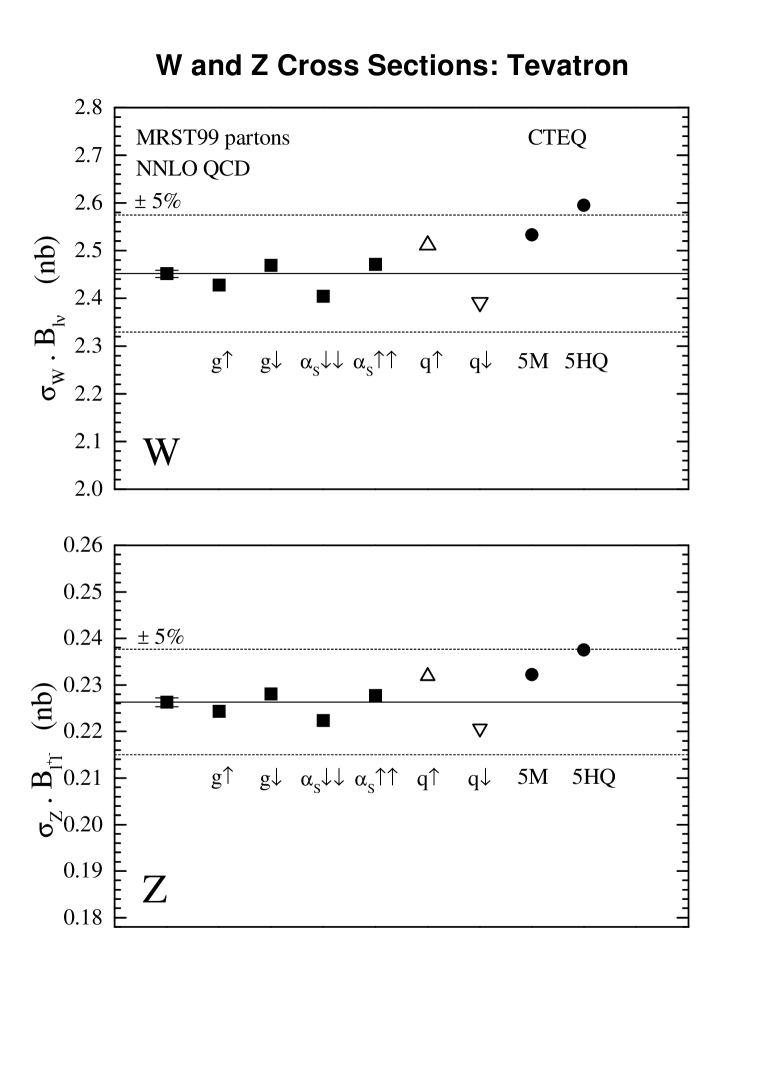
Before considering the and rapidity distributions at the LHC, we consider the total cross section predictions using the latest CTEQ5 parton distributions [6]. Since these are obtained in a similar way to the MRST partons, we would expect the (default, at least) predictions to lie well within the MRST99 band. Surprisingly, this is not the case. Figures 11 and 12 show the CTEQ5M and CTEQ5HQ121212The 5M and 5HQ sets differ in their treatment of the heavy quark distributions [6], with the 5HQ distributions more comparable to the MRST treatment [1]. In order to maintain the same charm contribution to the structure function at small , the 5M and 5HQ gluon distributions are slightly different in this region, and this leads to corresponding differences in the cross sections, cf. the MRST variation. predictions compared to those of the various MRST99 sets. The CTEQ5M predictions are about 4% (7%) larger at the Tevatron (LHC) than those of MRST99! The CTEQ5HQ predictions are even larger, lying well outside the band.
The differences between the MRST99 and CTEQ5 cross section predictions are due to corresponding differences in the underlying quark distributions. This is illustrated in Fig. 13, which shows the ratio of CTEQ5HQ and MRST99 partons at two representative values, and GeV2. The most striking difference is in the gluon at large . The MRST and CTEQ5 analyses put more emphasis in the global fit on the high (fixed target) prompt photon and (Tevatron collider) jet data respectively, and this is directly reflected in the resulting gluon pdfs. Since the sea quark pdfs are driven by in the DGLAP evolution, the same behaviour is seen in the ratio of the strange and charm distributions in Fig. 13.131313The smaller choice of GeV in the CTEQ5 analysis, compared to GeV for MRST99, also enhances the difference in the charm distributions. Of more relevance in the present context are the differences in the and quarks for at GeV2. One might expect that the long evolution length would result in essentially identical quark distributions,141414Note that at the lower value in Fig. 13 the impact of the different MRST and CTEQ5 starting parameterisations and cuts on the fitted DIS data can still be seen. At the higher value these differences have evolved away and the ratios are more uniform. but the CTEQ5HQ and quarks are between 2% (at ) and 5% (at ) larger than those of MRST99 at small . A possible reason for this discrepancy can be found in the numerical results presented in the Appendix.
4. and rapidity distributions
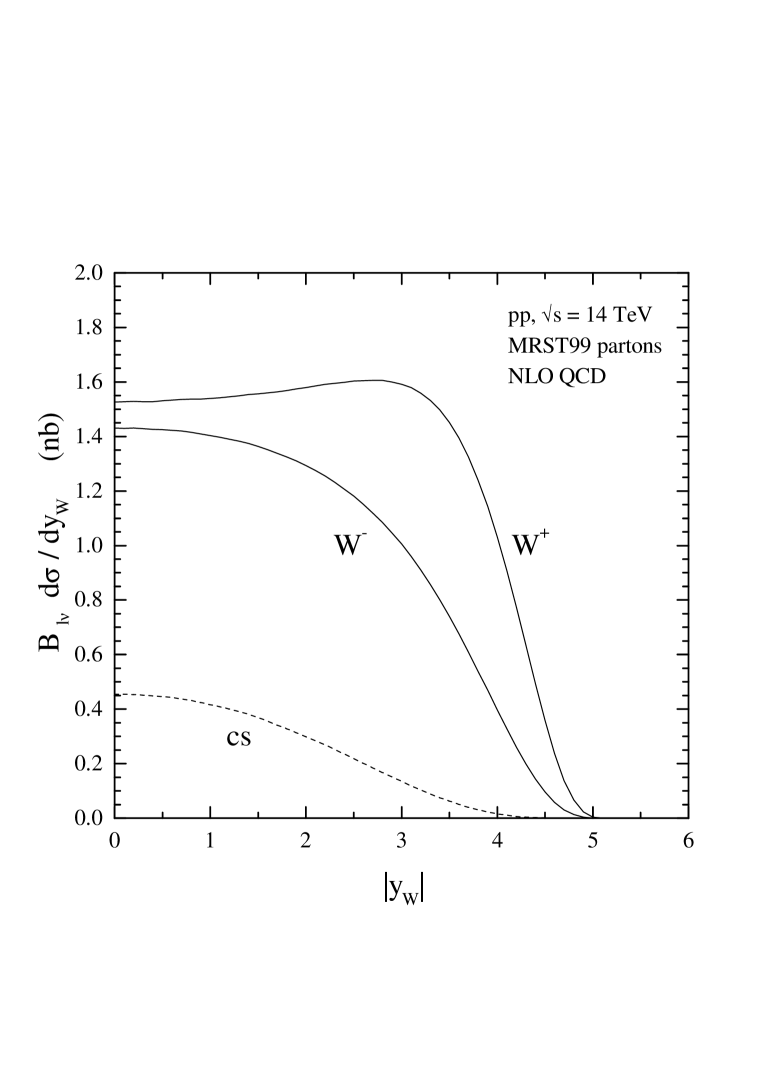
The and rapidity distributions are symmetric about and have a distinctively different shape at large , see Fig. 14.151515The curves are calculated using NLO corrections only – the NNLO corrections are not known at present. The bump in the distribution around is caused by a very small quark scattering off a large valence quark. At large , therefore, the rapidity distributions probe small (evolved) ‘HERA quarks’ scattering off large (evolved) ‘fixed target’ quarks. For and production, the latter are constrained by, for example, and structure functions respectively.
The distributions themselves are presumably difficult to measure accurately in practice — it is the lepton rapidity distribution that is measured instead. We will not discuss the experimental considerations here, see for example [4] for more discussion. However it is worth pointing out that the ratio of rapidity distributions is sensitive to the ratio of and quarks. Thus
| (3) | |||||
where for simplicity we have ignored the contributions involving strange and heavier quarks. Assuming that as , the large- rapidity distribution ratio is therefore a direct measure of the large- ratio of partons, at . Interestingly, there has been considerable recent interest in this ratio, since it is also measured by charged current scattering cross sections at HERA:
| (4) |
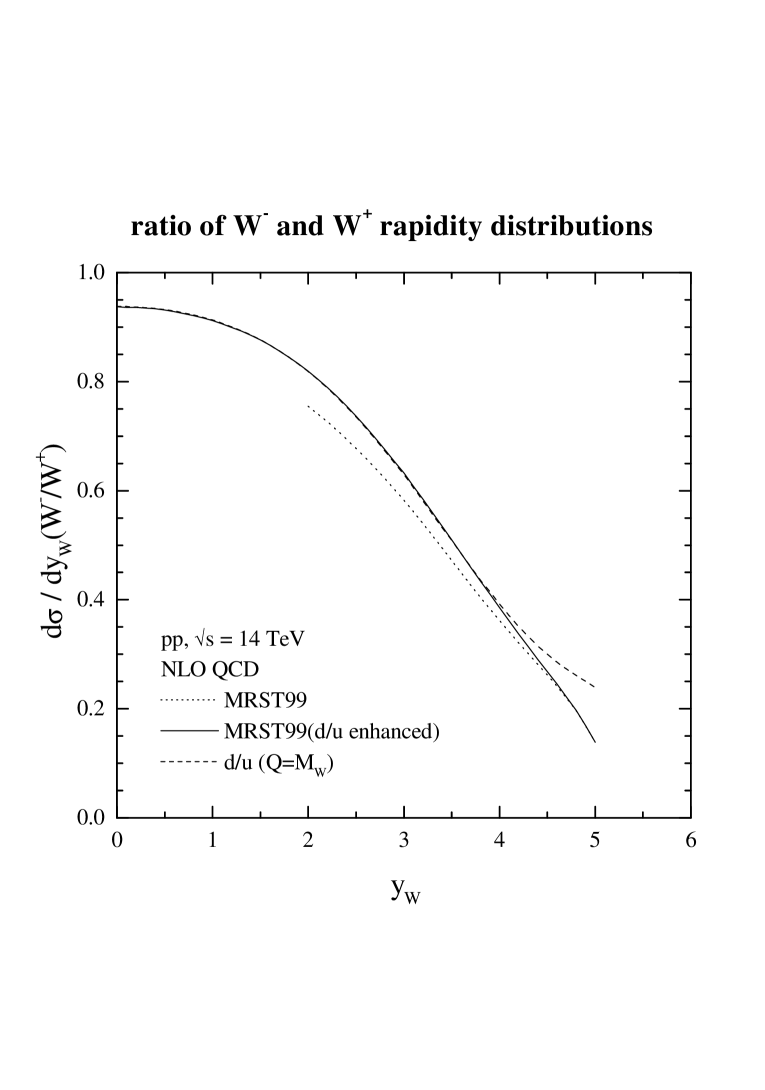
Fig. 15 shows the ratio as a function of . Note that only the predictions of the MRST set are shown – the other ten sets of Table 1 give almost identical predictions. This is because the variations quantified by these other sets largely cancel in the ratio. Also shown (dotted line) is the ratio evaluated at and . The convergence of the curves at large is confirmation of the derivation in (3). At central rapidities, the parton ratio falls below the cross section ratio. This is due to the non-() contributions and at the higher values probed. For example, Fig. 14 shows the rapidity dependence of the strange–charm scattering contribution, which contributes equally to and production. The bosons from this sea–sea scattering process are confined to the central region.
As mentioned above, current information on at large comes from fixed target measurements and the lepton asymmetry in , see for example [1]. In the MRST fit, NMC data are used to constrain the large- –quark pdf in this way. When the corresponding predictions for are compared with the ZEUS data [16], there is some evidence of a slight excess of data over theory in the largest () bin. Could this imply that the ratio is being underestimated in the standard global fits? Any attempt to increase at large in the global fit leads to a direct conflict with the data. However, Bodek and Yang [17] have recently stressed a point first made by Thomas and Melnitchouk (Ref. [18] and references therein) that the data should be corrected for nuclear binding effects which, at large , lead to a larger ratio, in ‘better’ agreement with the ZEUS data. This is an issue that has yet to be resolved, and therefore independent information from the rapidity ratio at LHC would be very valuable.
To illustrate the likely size of the effect, we show in Fig. 15 the predictions of a modified version of MRST in which the ratio is deliberately enhanced at large such as to mimic the size of effect proposed in Ref. [17]. The difference is only significant for , which suggests that discrimination will not be easy at the LHC.
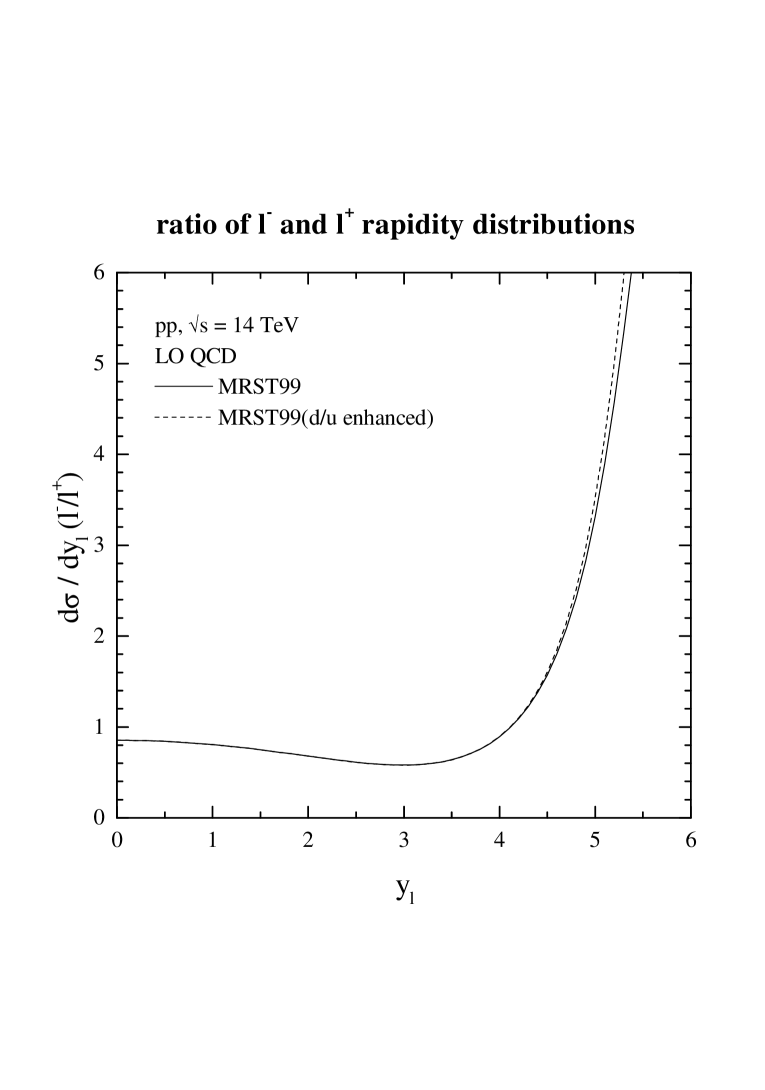
Since it is the charged lepton rapidity distribution that is measured in practice, we can see to what extent the differences between and production survive the leptonic decay process. Fig. 16 shows the ratio of the charged lepton rapidity distributions.161616The lepton distributions are computed at leading order with the full decay structure taken into account. The ratio is very insensitive to higher-order effects. A transverse momentum cut of GeV is imposed. The solid line is again the MRST prediction, and the dashed line is the prediction of the enhanced set, as in Fig. 15. Notice the qualitatively different behaviour of the ratio at large rapidity. This is due to the structure of the subprocess. Thus a produced with large positive in , decays preferentially to a with smaller rapidity , while a produced with large positive in , decays preferentially to a with larger rapidity . The ratio therefore increases as . This is in direct analogy to the lepton asymmetry in changing sign and becoming negative at large . The effect of enhancing the ratio at large is still just visible.
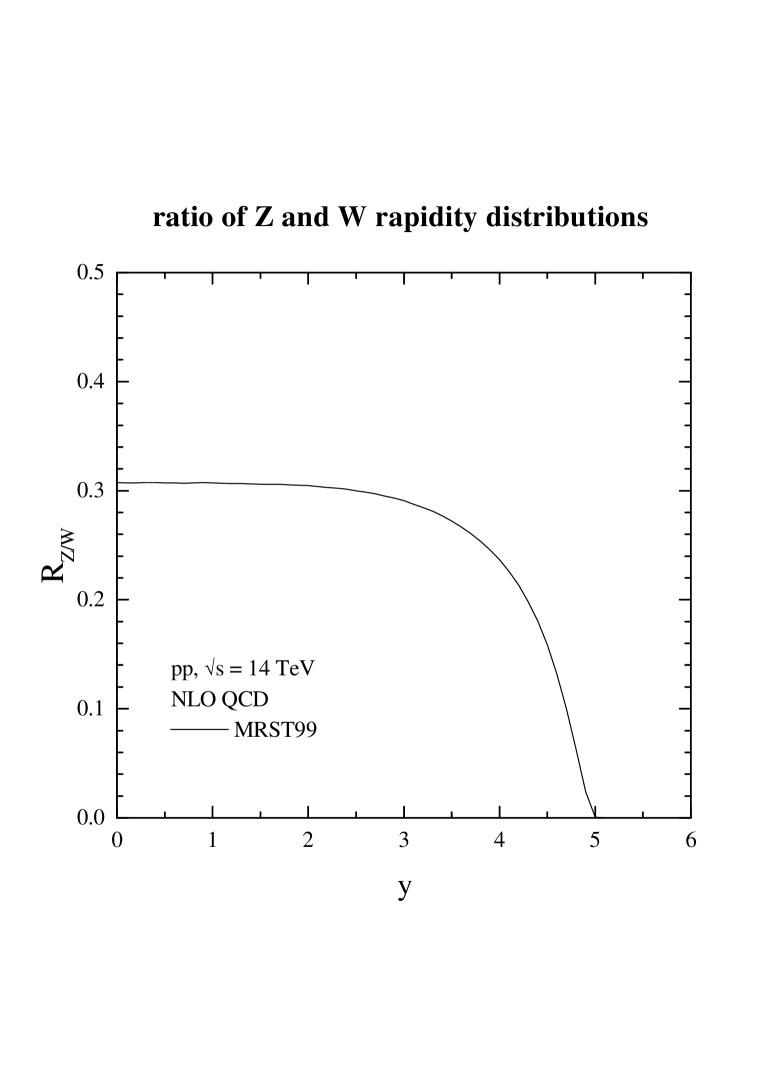
In the same spirit we can consider the ratio of and rapidity distributions. The analogue of (3) is now
| (5) |
Here the and contributions to the numerator are weighted by the appropriate neutral current coupling factors:
| (6) |
Because , the pdfs in the numerator and the denominator are no longer evaluated at exactly the same values of . This means that there is no simple analytic expression for the ratio in the limit. The prediction for calculated using the MRST partons is shown in Fig. 17. The prediction using the MRST(-enhanced) set is essentially the same — there is little sensitivity to the ratio.
5. Conclusions
We have made a detailed study of the and boson total production cross sections and rapidity distributions at the LHC proton-proton collider. We have focused on the dependence of the cross sections on the parton distributions — the largest source of theoretical uncertainty. We have shown that the two important effects are the DGLAP evolution uncertainty, due to the uncertainty in and to a lesser extent in the gluon, and the normalisation uncertainty on the DIS structure function data fitted in this analysis, which is directly reflected in a corresponding uncertainty in the parton distributions. Taking everything together, we conservatively estimate an overall pdf uncertainty of approximately on the total cross sections at the LHC, only slightly larger than the uncertainty on the corresponding Tevatron cross sections.
We have also studied the rapidity distributions. If these can be accurately measured, they allow the quark distributions to be probed over a wide range of . We showed, in particular, that the difference in the and distributions at large rapidity directly reflects the difference in the and distributions as . A measurement of the ratio in this way would be complementary to the information obtained from charged current cross sections at HERA.
Finally, while comparing our total cross section predictions with those based on the latest CTEQ5 distributions we noticed differences that we believe reflect shortcomings in the accuracy of the evolution codes. We have corrected an error (at NLO) in the standard MRS evolution code that brings it into exact agreement with the “standard evolution” benchmark program. The CTEQ5 and cross sections are still systematically larger than those using the corrected MRST partons, an effect we believe is due to a too rapid CTEQ sea quark evolution.
Acknowledgements
This work was supported in part by the EU Fourth Framework Programme ‘Training and Mobility of Researchers’, Network ‘Quantum Chromodynamics and the Deep Structure of Elementary Particles’, contract FMRX-CT98-0194 (DG 12 - MIHT).
Appendix
The parton sets used in this paper, MRST99, differ slightly from the original MRST [1] distributions. The main difference is due to the correction in the computer code of a factor in one of the terms appearing in the NLO splitting function. The effect is to make the gluon, and hence the sea, evolve a little more rapidly at small . We have also included a missing NLO contribution which affects the charm evolution only.
It is informative to explain the present situation concerning evolution codes. The long evolution length to Tevatron and LHC energies, and the expected precision of the predictions of the weak boson production cross sections, can expose small defects in evolution codes. The unexpectedly large difference that we found between the cross sections predicted using MRST98 and CTEQ5 partons means that all codes should be carefully checked. The difference appears to be due to the more rapid evolution of the sea quarks of CTEQ5. A similar effect was found in a comparison of various NLO evolution codes made during the 1996 HERA workshop [19]. Neither CTEQ, nor MRS, agreed completely with the “standard code” for a test evolution from to 100 GeV2. In the interval , the CTEQ sea was some 4% high, and the MRS sea was 1% low and the gluon about 1.5% low. After including the corrections noted above, the MRST99 code is found to agree precisely with the “standard” evolution, and consistent with exact momentum conservation as a function of , as it should be. The momentum fractions carried by the various partons as increases are shown in Table 1. Small violations of overall momentum conservation can be seen for MRST98 and the CTEQ parton sets (CTEQ4M and CTEQ4HQ are qualitatively similar).
Since the MRST99 partons come from a new global fit to the data, a comparison
with the MRST98 partons [1] does not simply reflect the small
correction to the evolution code.
In particular, ZEUS 1995 SVX data [20] is included in the MRST99
analysis.
Moreover we have increased the mass of the charm quark from 1.35 to
1.43 GeV so as to maintain the description of the (charm) data.
| CTEQ5M | total | ||||||||
|---|---|---|---|---|---|---|---|---|---|
| 5 | 0.2843 | 0.1143 | 0.0559 | 0.0730 | 0.0374 | 0.0120 | 0.0000 | 0.4293 | 1.0063 |
| 10 | 0.2667 | 0.1072 | 0.0586 | 0.0746 | 0.0412 | 0.0174 | 0.0000 | 0.4424 | 1.0081 |
| 50 | 0.2374 | 0.0955 | 0.0631 | 0.0774 | 0.0477 | 0.0265 | 0.0059 | 0.4576 | 1.0110 |
| 100 | 0.2278 | 0.0916 | 0.0646 | 0.0783 | 0.0498 | 0.0294 | 0.0097 | 0.4607 | 1.0120 |
| 500 | 0.2096 | 0.0843 | 0.0674 | 0.0800 | 0.0538 | 0.0350 | 0.0169 | 0.4667 | 1.0137 |
| 1000 | 0.2031 | 0.0817 | 0.0684 | 0.0806 | 0.0552 | 0.0370 | 0.0194 | 0.4688 | 1.0142 |
| 5000 | 0.1902 | 0.0765 | 0.0703 | 0.0818 | 0.0579 | 0.0409 | 0.0245 | 0.4727 | 1.0149 |
| 10000 | 0.1855 | 0.0746 | 0.0710 | 0.0822 | 0.0589 | 0.0424 | 0.0263 | 0.4742 | 1.0150 |
| CTEQ5HQ | total | ||||||||
| 5 | 0.2858 | 0.1160 | 0.0579 | 0.0749 | 0.0379 | 0.0118 | 0.0000 | 0.4215 | 1.0058 |
| 10 | 0.2681 | 0.1088 | 0.0604 | 0.0763 | 0.0416 | 0.0171 | 0.0000 | 0.4354 | 1.0075 |
| 50 | 0.2386 | 0.0968 | 0.0646 | 0.0787 | 0.0479 | 0.0260 | 0.0058 | 0.4519 | 1.0104 |
| 100 | 0.2290 | 0.0929 | 0.0660 | 0.0796 | 0.0499 | 0.0290 | 0.0096 | 0.4554 | 1.0114 |
| 500 | 0.2107 | 0.0855 | 0.0686 | 0.0811 | 0.0538 | 0.0345 | 0.0167 | 0.4621 | 1.0130 |
| 1000 | 0.2042 | 0.0828 | 0.0695 | 0.0816 | 0.0552 | 0.0365 | 0.0192 | 0.4645 | 1.0135 |
| 5000 | 0.1912 | 0.0776 | 0.0713 | 0.0826 | 0.0579 | 0.0404 | 0.0242 | 0.4689 | 1.0142 |
| 10000 | 0.1864 | 0.0756 | 0.0719 | 0.0830 | 0.0589 | 0.0418 | 0.0260 | 0.4705 | 1.0143 |
| MRST98 | total | ||||||||
| 5 | 0.2799 | 0.1160 | 0.0599 | 0.0759 | 0.0414 | 0.0087 | 0.0000 | 0.4108 | 0.9926 |
| 10 | 0.2627 | 0.1089 | 0.0614 | 0.0764 | 0.0441 | 0.0130 | 0.0000 | 0.4245 | 0.9910 |
| 50 | 0.2341 | 0.0970 | 0.0641 | 0.0775 | 0.0487 | 0.0205 | 0.0062 | 0.4406 | 0.9887 |
| 100 | 0.2240 | 0.0928 | 0.0652 | 0.0779 | 0.0504 | 0.0232 | 0.0096 | 0.4452 | 0.9882 |
| 500 | 0.2061 | 0.0854 | 0.0670 | 0.0787 | 0.0533 | 0.0281 | 0.0156 | 0.4524 | 0.9866 |
| 1000 | 0.1994 | 0.0826 | 0.0677 | 0.0790 | 0.0545 | 0.0300 | 0.0179 | 0.4551 | 0.9862 |
| 5000 | 0.1868 | 0.0774 | 0.0690 | 0.0796 | 0.0567 | 0.0335 | 0.0222 | 0.4594 | 0.9846 |
| 10000 | 0.1818 | 0.0753 | 0.0695 | 0.0799 | 0.0575 | 0.0349 | 0.0239 | 0.4609 | 0.9838 |
| MRST99 | total | ||||||||
| 5 | 0.2810 | 0.1136 | 0.0600 | 0.0760 | 0.0416 | 0.0073 | 0.0000 | 0.4197 | 0.9992 |
| 10 | 0.2640 | 0.1067 | 0.0616 | 0.0767 | 0.0444 | 0.0122 | 0.0000 | 0.4335 | 0.9991 |
| 50 | 0.2359 | 0.0953 | 0.0646 | 0.0780 | 0.0492 | 0.0205 | 0.0066 | 0.4482 | 0.9983 |
| 100 | 0.2259 | 0.0913 | 0.0657 | 0.0786 | 0.0509 | 0.0235 | 0.0102 | 0.4521 | 0.9982 |
| 500 | 0.2083 | 0.0842 | 0.0676 | 0.0795 | 0.0540 | 0.0287 | 0.0166 | 0.4584 | 0.9973 |
| 1000 | 0.2016 | 0.0815 | 0.0684 | 0.0799 | 0.0552 | 0.0308 | 0.0190 | 0.4608 | 0.9971 |
| 5000 | 0.1891 | 0.0764 | 0.0697 | 0.0805 | 0.0574 | 0.0345 | 0.0235 | 0.4648 | 0.9960 |
| 10000 | 0.1841 | 0.0744 | 0.0703 | 0.0808 | 0.0583 | 0.0360 | 0.0253 | 0.4662 | 0.9953 |
References
- [1] A.D. Martin, R.G. Roberts, W.J. Stirling and R.S. Thorne, Eur. Phys. J. C4 (1998) 463.
-
[2]
R. Hamberg, T. Matsuura and W.L. van Neerven, Nucl. Phys. B345 (1990) 331;
Nucl. Phys. B359 (1991) 343.
W.L. van Neerven and E.B. Zijlstra, Nucl. Phys. B382 (1992) 11. - [3] U. Baur, S. Keller and D. Wackeroth, Phys. Rev. D59 (1999) 013002.
- [4] M. Dittmar, F. Pauss and D. Zurcher, Phys. Rev. D56 (1997) 7284.
- [5] A.D. Martin, R.G. Roberts, W.J. Stirling and R.S. Thorne, Phys. Lett. B443 (1998) 301.
- [6] CTEQ collaboration: H.L. Lai et al., hep-ph/9903282.
- [7] H1 collaboration: S. Aid et al., Nucl. Phys. B470 (1996) 3; C. Adloff et al., Nucl. Phys. B497 (1997) 3.
- [8] ZEUS collaboration: M. Derrick et al., Zeit. Phys. C69 (1996) 607; M. Derrick et al., Zeit. Phys. C72 (1996) 399.
- [9] CCFR collaboration: A.O. Bazarko et al., Z. Phys. C65 (1995) 189.
- [10] R.S. Thorne and R.G. Roberts, Phys. Rev. D57 (1998) 6871.
- [11] UA1 collaboration: C. Albajar et al., Z. Phys. C44 (1989) 115.
- [12] UA2 collaboration: J. Alitti et al., Z. Phys. C47 (1990) 11.
- [13] CDF collaboration: F. Abe et al., Phys. Rev. Lett. 76 (1996) 3070.
- [14] D0 collaboration: S. Abachi et al., Phys. Rev. Lett. 75 (1995) 1456.
- [15] E866 collaboration: E.A. Hawker et al., Phys. Rev. Lett. 80 (1998) 3715.
- [16] ZEUS collaboration: Papers 751, 752 presented at ICHEP98,
- [17] A. Bodek and U.K. Yang, Phys. Rev. D82 (1999) 2467.
- [18] W. Melnitchouk and A.W. Thomas, Phys. Lett. B377 (1996) 11.
- [19] J. Blümlein et al., Proc. of 1995/6 HERA Physics Workshop, eds. G. Ingelman et al., Vol. 1, p.23 hep-ph/9609400.
- [20] ZEUS collaboration: J. Breitweg et al., Eur. Phys. J. C7 (1999) 609.