A QCD analysis of HERA and fixed target structure function data
Abstract
The parton momentum densities in the proton are determined from a NLO QCD analysis of structure functions measured by HERA and fixed target experiments. Also included are data on the difference of the up and down anti-quark densities. The uncertainties in the parton densities, structure functions and related cross sections are estimated from the experimental errors, taking into account all correlations. Standard Model predictions of the charged current Born cross sections at large and are calculated and compared with recent data from ZEUS.
1 INTRODUCTION
With the integrated luminosity of about 50 pb-1 collected at HERA during the years 1994–1997 a new kinematic domain of large and becomes accessible for the study of deep inelastic scattering in collisions. Measurements by ZEUS of the single differential neutral current (NC) and charged current (CC) Born cross sections for GeV2 have recently become available [1, 2].
Standard Model (SM) predictions calculated with, for instance, the parton distribution set CTEQ4 [3] are in good agreement with the NC cross sections but fall below the CC measurements at large and . This could be an indication of new physics beyond the SM but might also be due to an imperfect knowledge of the parton densities in this kinematic region. For instance in [4] it is shown that a modification of the CTEQ4 down quark density yields SM predictions in agreement with the CC data.
To investigate these issues we have performed a global NLO QCD analysis [5] of structure function data to obtain the parton densities in the proton. A full error analysis provides estimates of the uncertainties in these parton densities, the structure functions and the SM predictions of the NC and CC cross sections.
2 QCD ANALYSIS
The data used in the fit are from ZEUS [6] and H1 [7] together with , [8, 9, 10, 11] and [12] from fixed target experiments. Also included were neutrino data on [13] for and data on the difference [14].
After cuts the data cover a kinematic range of , GeV2 and GeV2. Both and as well as were corrected for nuclear effects using the parameterization of [15] for deuterium (with an assumed uncertainty of 100%) and that of [16] for iron (assumed uncertainty 50%).
The QCD predictions for the structure functions were obtained by solving the QCD evolution equations in NLO in the scheme [17]. At the scale GeV2 the gluon density (), the sea and valence quark densities () and the difference were parameterized in the standard way [18] (16 free parameters). The strange quark density was taken to be a fraction of the sea [19]. The normalizations of the parton densities were constrained such that the momentum sum rule and the valence quark counting rules are satisfied. The charm and bottom quarks were assumed to be massless and were generated dynamically above the thresholds and GeV2 respectively. The value of the strong coupling constant was set to .
Higher twist contributions to and were taken into account phenomenologically by describing these structure functions as
| (1) |
where obeys the NLO QCD evolution equations and where was parameterized as a fourth degree polynomial in (5 free parameters).
The normalizations of the ZEUS, H1 and NMC data were kept fixed to unity whereas those of the remaining data sets were allowed to float within the quoted normalization errors (7 parameters).
The uncertainties in the parton densities, structure functions and related cross sections were estimated taking into account all correlations. Included in the error calculation are the experimental statistical errors, 57 independent sources of systematic uncertainty (propagated using the technique described in [20]) and the errors on the input parameters of the fit.
3 RESULTS
The fit yielded a good description of the data with a of 1540 for 1578 data points and 28 free parameters. The quality of the fit is illustrated in Fig. 1 where we show the fixed target data for .

The higher twist coefficient in Eq. (1) is found to be negative for and becomes large and positive at high . Our result on the higher twist contribution is very close to that obtained by MRST [21].
Nuclear effects in neutrino scattering were investigated by calculating the ratios and of the CCFR data to the QCD predictions of scattering on a free nucleon. Both these ratios do not significantly depend on in accordance with measurements of nuclear effects in muon scattering [22]. The ratios, averaged over , are plotted in Fig. 2
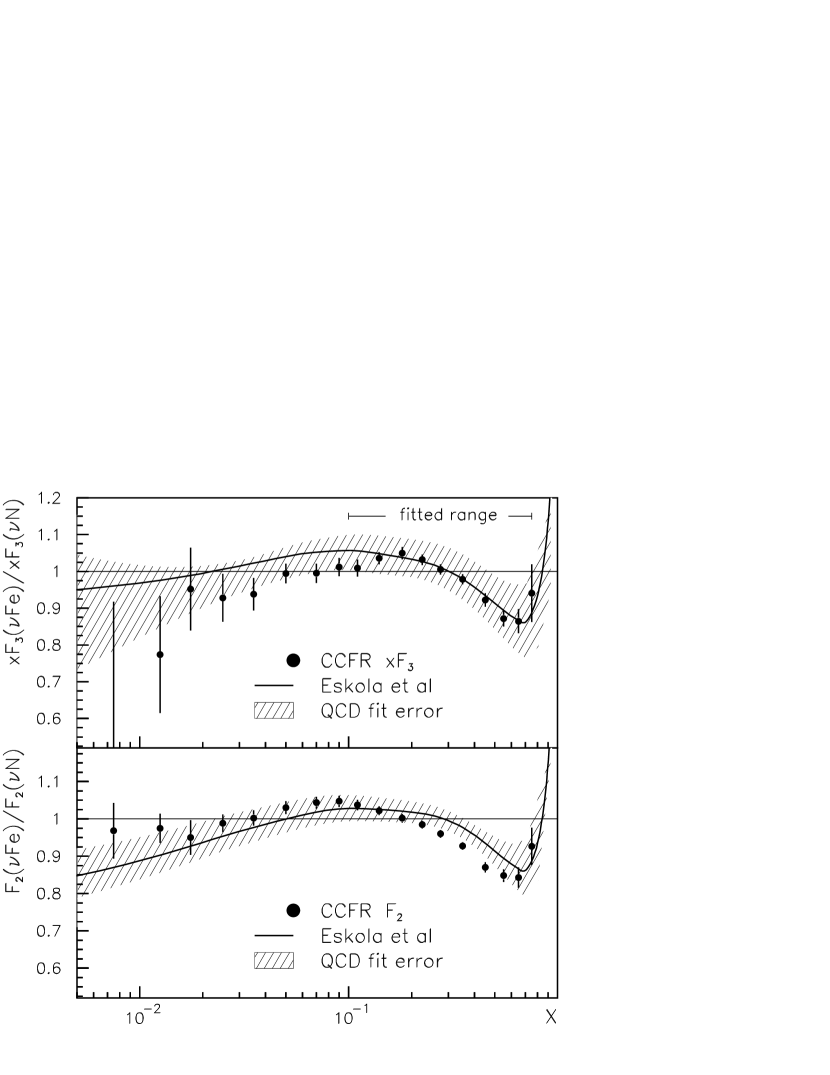
and show the typical dependence of nuclear effects, including the rise at large due to Fermi motion. However, within the present accuracy it is not possible to establish whether these nuclear effects are significantly different from those measured in charged lepton scattering (full curves in Fig. 2).
In Fig. 3
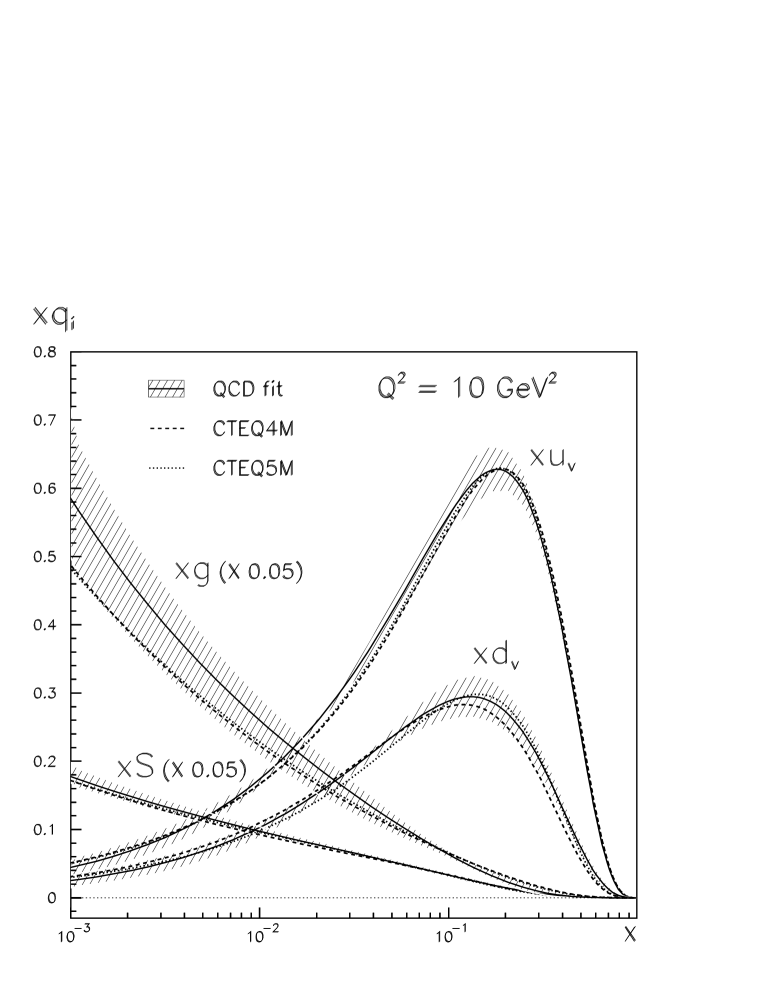
are shown the parton densities obtained from the QCD fit (full curves). We have verified that the strange quark density is compatible with the measurements from CCFR [19] and also that the QCD prediction of agrees well with the ZEUS data [23] above GeV2. This supports the assumption made in this analysis that, at least for , quark mass effects do not spoil the QCD extrapolations to large .
Also shown in Fig. 3 are the parton densities from CTEQ4 and CTEQ5 [24]. There is, within errors, good agreement between these results and the QCD fit, although both the present analysis and CTEQ5 yield a slightly harder density than CTEQ4. Bodek and Yang [4] also obtain a harder density by modifying CTEQ4 (where the ratio as ) such that
| (2) |
They find which implies that as . The ratio is shown in Fig. 4.
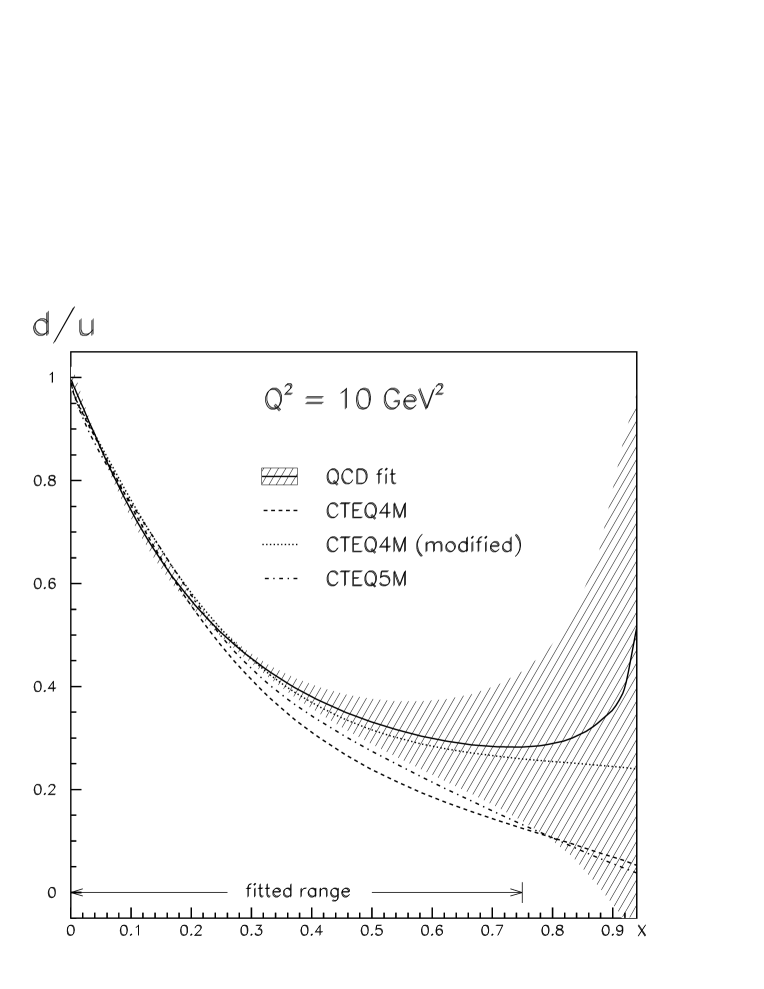
It is seen that the result from the QCD fit with (full curve) is for close to the modified CTEQ4 distribution with (dotted curve); if we leave a free parameter in the fit, we obtain (statistical error), close to zero. In any case, the large error band clearly indicates that the exact behavior of at large is not well constrained. It might go to zero (CTEQ), to a constant (Bodek and Yang) or may even diverge (this analysis) as .
The CC cross section is predominantly sensitive to the quark density
| (3) |
where with the center of mass energy (105 GeV2 at HERA). In Fig. 5
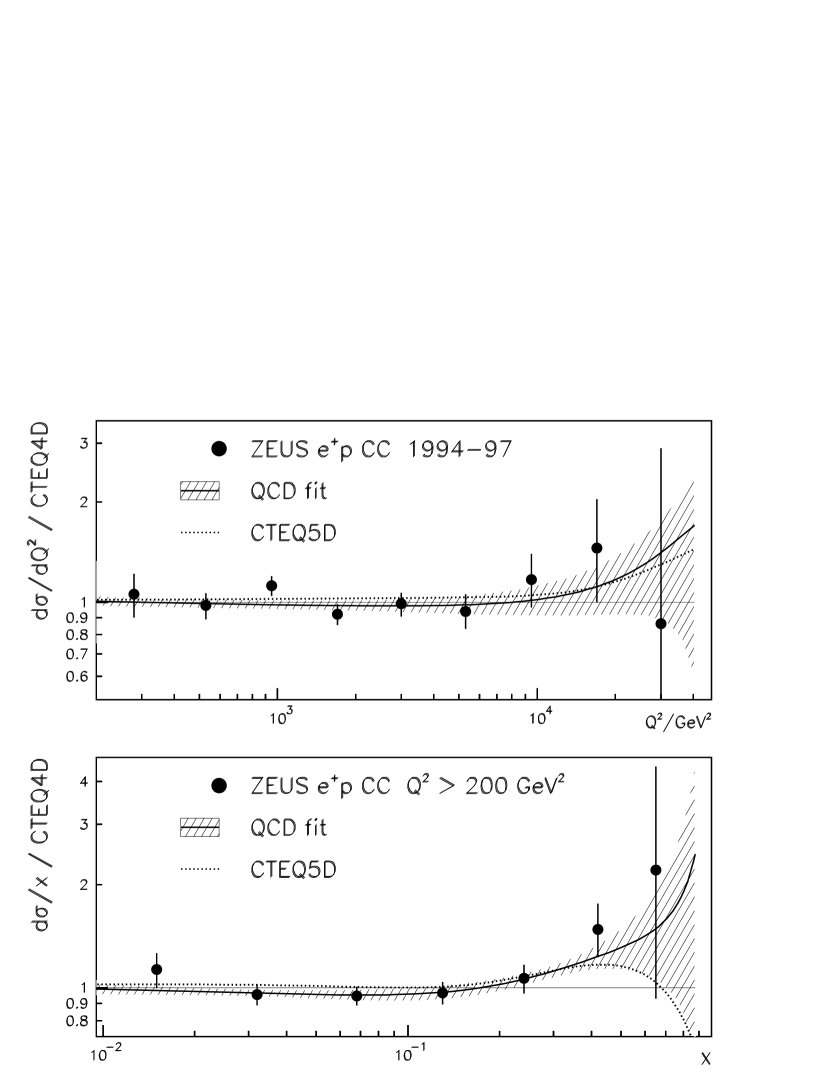
we show the ZEUS measurements [2] of the CC single differential cross sections and for GeV2, normalized to the NLO predictions calculated with the CTEQ4 parton distribution set. The full (dotted) curves correspond to the predictions from the QCD fit (CTEQ5) which both achieve a better description of the data at large and due to an improved determination of the quark density. SM predictions of the NC cross sections, calculated with the parton densities obtained in this analysis, also agree very well with the recent ZEUS data [1] (not shown).
We conclude that, within the present experimental accuracy, no significant deviations can be observed between the data and the Standard Model predictions.
References
- [1] ZEUS Collab., DESY 99-056.
- [2] ZEUS Collab., DESY 99-059.
- [3] CTEQ Collab., H.L. Lai et al., Phys. Rev. D55 (1997) 1280.
- [4] U.K. Yang and A. Bodek, Phys. Rev. Lett. 82 (1999) 2467.
- [5] M. Botje, NIKHEF 99-011, DESY 99-038 (in preparation).
- [6] ZEUS Collab., M. Derrick et al., Z. Phys. C72 (1996) 399.
- [7] H1 Collab., S. Aid et al., Nucl. Phys. B470 (1996) 3.
- [8] E665 Collab., M.R. Adams et al., Phys. Rev. D54 (1996) 3006.
- [9] NMC, M. Arneodo et al., Nucl. Phys. B483 (1997) 3.
- [10] BCDMS Collab., A.C. Benvenuti et al., Phys. Lett. B223 (1989) 485 and Phys. Lett. B237 (1990) 592.
- [11] SLAC, L.W. Whitlow et al., Phys. Lett. B282 (1992) 475.
- [12] NMC, M. Arneodo et al., Nucl. Phys. B487 (1997) 3.
- [13] CCFR Collab., W. Seligman et al., Phys. Rev. Lett. 79 (1997) 1213.
- [14] E866 Collab., E.A. Hawker et al., Phys. Rev. Lett. 80 (1998) 3715.
- [15] J. Gomez et al., Phys. Rev. D49 (1994) 4348.
- [16] K.J. Eskola, V.J. Kolhinen and C.A. Salgado, JYFL-8/98, US-FT/14-98, hep-ph/9807297; K.J. Eskola, V.J. Kolhinen and P.V. Ruuskanen, Nucl. Phys. 535 (1998) 351.
- [17] G. Gurci, W. Furmanski and R. Petronzio, Nucl. Phys. B175 (1980) 27; W. Furmanski and R. Petronzio, Phys. Lett. 97B (1980) 437 and Z. Phys. C11 (1982) 293.
- [18] A.D Martin, W.J. Stirling and R.G. Roberts, Phys. Rev. D50 (1994) 6734.
- [19] CCFR Collab., A.O. Bazarko et al., Z. Phys. C65 (1995) 189.
- [20] C. Pascaud and F. Zomer, LAL 95-05.
- [21] A.D. Martin et al., Phys. Lett. B443 (1998) 301.
- [22] NMC, A. Amaudruz et al., Nucl. Phys. B441 (1995) 3; M. Arneodo et al., Nucl. Phys. B441 (1995) 12.
- [23] I. Redondo, in these proceedings.
- [24] CTEQ Collab., H.L. Lai et al., hep-ph/9903282.