MRI-PHY/P990512
Appearance Searches using Neutrino Beams
from Muon Storage Rings
Sukanta Dutta
***E-mail address: sukanta@mri.ernet.in,
Raj Gandhi a
†††E-mail address: raj@mri.ernet.in
and
Biswarup Mukhopadhyaya a
‡‡‡E-mail address: biswarup@mri.ernet.in
aMehta Research Institute, Jhusi, Allahabad, India
bS.G.T.B. Khalsa College, Univ. of Delhi, Delhi, India
Abstract
We study the possibilities offered by muon storage rings for appearance experiments in order to determine masses and mixing angles for and oscillations. Tau event rates for such experiments are first discussed with a view to examining their variation prior to the inclusion of experimental cuts, in order to better understand how baselines, forward peaking of decay neutrinos with increasing energies, and average fluxes intercepted by detectors of various sizes can affect their optimization. Subsequently, event rates implementing cuts for hadronic and wrong sign leptonic modes are computed and used to plot CL contours for the parameter regions that can be explored in such experiments, and the expected scaling of the contours with energy and baseline is discussed. The results show that even for modest muon beam energies, convincing coverage and verification of the Super Kamiokande parameters is possible. In addition, very significant enlargement of present day bounds on the mixing parameters for neutrino oscillations of all types is guaranteed by these types of searches.
PACS number(s):
1 Introduction
The recent results of the Super Kamiokande (Super K) water Cerenkov-detector experiment [1] provide firm indications of an anomaly in the flavor ratios and zenith-angle dependence of the atmospheric neutrino flux. Although the existence of such an anomaly had already been signalled by earlier data from the Kamiokande [2] and IMB [3] experiments and supported by subsequent Soudan II results [4], the impressive statistical significance of the Super K data has appreciably buttressed its interpretation in terms neutrino mass and oscillations. This is especially true of the observed zenith angle dependence of the observations, which does not naturally seem to lend itself to any alternative explanation. When combined with results from the CHOOZ reactor experiment [5], analyses [6, 7] of the data tilt the balance towards an interpretation in terms of oscillations versus other explanations. Evidence that this channel is favoured also comes from neutral current event count ratios involving the production of neutral pions measured at Super K [8].
In addition to being the first firm signal for physics beyond the Standard Model, a determination, even if approximate, of neutrino masses and mixing angles would be a crucial pointer towards the nature of such physics, providing an unprecedented glimpse into what lies beyond present knowledge of particle interactions. Thus, the importance of independently verifying the presence of oscillations can scarcely be overestimated. The firmest confirmation of this hypothesis would be via the detection of leptons produced by charged current interactions of ’s resulting from oscillations of ’s. In this paper, we study this possibility in the context of neutrinos obtained from muon storage rings at future muon colliders.
At present, high energy ( GeV) neutrino beams for oscillation studies are obtained by allowing charged pions and kaons produced in fixed target accelerator experiments to decay in flight. Recently, however, a new type of neutrino beam, much more intense than those presently available, has been proposed and discussed for neutrino oscillation studies and other neutrino related experiments [9, 10, 11, 12, 13, 14, 15, 16, 17]. These beams originate from a high intensity muon source, currently under active design and study as part of an effort to develop a high luminosity muon collider [18]. In addition to the extremely intense and collimated primary neutrino fluxes which will be available from such a source, the beam compositions will be much more precisely known than in those available from pion and kaon decay. A muon storage ring with the straight section pointing towards a neutrino detector situated at a specific baseline length, as described in detail in [12], would lead to a neutrino beam with precisely equal numbers of and , or alternatively and , depending on the sign of parent muons. This is in contrast to the presently available high energy neutrino beams from accelerators, which contain mostly muon neutrinos, but with small contaminations of electron and tau neutrino species. For appearance searches, the vastly superior luminosities, absence of contamination and the possibility of higher energies of muon collider neutrino beams make them an attractive proposal which merits further study.
Accordingly, we focus here on the physics of tau appearance experiments using neutrinos from muon storage rings, depicting the two flavour oscillation parameter ranges ( and ) which can be consequently probed in a search for and oscillations. 111A full study would involve three flavour oscillations, but our purpose here is to explore the possibilities rather than details, given the fact that muon colliders and neutrino experiments fueled by muons from storage rings are still in the design and development stage; see for instance [18].
Adopting the sample design configuration for muon production, capture, cooling, acceleration and storage prior to decay described in [12], the number of available muons of either sign is per year. Of these, one fourth decay in a straight section directed towards the neutrino detector, yielding neutrinos and an identical number of anti-neutrinos and , if, for example, the beam is comprised of We use these numbers in all of the following calculations, and refer the reader to [12] for design details leading to the production of the neutrino beams.
In section 2 we discuss the broader physics characteristics and dependences of production rates at such oscillation experiments. In section 3 we discuss the realistic detection of events above backgrounds. The channels we study are the detection of (i) oscillations via charge current production and subsequent decay into hadrons, and (ii) oscillations via the appearance of wrong sign muons from decay to leptonic modes. The specific conventional kT type detector, discussed recently in [12] is considered, and we describe our choices for the kinematic cuts and/or overall detection efficiencies for it.
In section 4 we use the results of the consequent event rate calculations to present 90 CL contours for and for a variety of muon beam energies and baseline lengths in order to illustrate the extraordinary possibilities offered by muon colliders for studying neutrino oscillations.
2 appearance event rates using muon collider beams: general characteristics
For the general discussion that this section focuses on, we compute and use the actual charged current (CC) production rates without including experimental cuts to eliminate backgrounds. These are detailed and incorporated later, in sections 3 and 4, prior to obtaining contour plots for and .
The event rate (events/kT/year) for lepton production from ’s subsequent to oscillation is given by
| (1) |
where is the total charged current cross section obtained by integrating equation (LABEL:eq3) below. The oscillation probability between flavours is
| (2) |
with in eV2, baseline length in km, being the neutrino energy in GeV, and the mixing angle between flavours. is the number of neutrinos in the cone intercepted by the detector averaged over its area. The numerical factor is the number of scatterers ( iso -scalar nucleons) per kT of the detector material.
We first discuss the cross-section, performing our calculation within the renormalization group improved parton model, and focus on the inclusive process anything, where is an isoscalar nucleon. On retaining effects of the -mass, 222 Or -mass, in the case of , which is also calculated below. Clearly, however, the terms proportional to the square of the lepton mass in Eqs. (3) and (4) are important at the energies of interest for only the -lepton. the differential cross section can be written in terms of the Bjorken scaling variables and as
Here is the invariant momentum transfer between the incident neutrino and outgoing tau, is the energy loss in the lab (target) frame, and are the nucleon and intermediate boson masses respectively, and GeV-2 is the Fermi constant. The limits on and are
where
| (4) |
The ’s are given as
A straightforward application of the Callan-Gross equations shows that vanishes in this case. In the above, u,d,c,s and b denote the distributions for the various quark flavours in a proton. For our calculations we use CTEQ4 parton distributions [19].
Figure 1 shows the total CC cross sections for and , obtained using the above expressions. For convenience, we give analytic fits for both cross-sections in Table 1, over the entire range of energy which is of interest here.
For the calculations of event rates, we assume that area dimensions of the detector and the baseline length define a ‘detection cone’ of half angle with the direction of the muon beam, with detector radius . Thus, for long baselines the choice of would expectedly be smaller than those for shorter baselines in order to accommodate a realistic detector size. The angular distribution of within a chosen detection cone, of course, follows from the decay kinematics of muon, and is obtained by boosting the familiar distribution of a muon decaying at rest to the requisite beam energy. Figure 2 shows, for various beam energies, the angular distribution in the polar angle , where is the number of muon neutrinos ( prior to any oscillation ) contained within a cone of half-angle , demonstrating the expected forward peaking of muon neutrinos with increasing parent particle energy. This distribution peaks around radians for GeV, around radians for GeV, and even higher for 50 and 20 GeV. We remark here that for the wrong-sign muon detection mode discussed and used below, the parent angular distribution differs from the distribution shown here, as dictated by decay kinematics.
Next, we note that the oscillation probability in equation (2) reduces to
| (5) |
for , and that this condition is satisfied for a significant range of values, even for large baseline lengths, given the high energies contemplated for muon colliders. It is, for instance, valid for the favoured value of Super K results, eV2, , even for a relatively low 20 GeV muon beam and a 732 km baseline. Since the average flux intercepted by a detector for some fixed falls as , from equation (1) we see that will be independent of baseline length as long as equation (5) is satisfied. This independence is illustrated in figure 3, where the tau events /kT/yr are plotted versus baseline lengths for three different values of , for a 250 GeV muon beam energy and eV2.
Subsequent to oscillation, and when the detector area is taken into account, the enhanced collimation of the neutrinos with increasing beam energy manifests itself in an interesting manner. In general, for a significant part of the range of the energies of interest at muon colliders, rises linearly with neutrino energy. For our choice of oscillation parameters, the probability varies with energy as in equation (5) , while the forward peaking of the neutrino beam with energy enhances the flux term as , leading to an overall linear increase in the event rate with energy for a detector of fixed mass whose area matches that of the kinematic decay cone at each energy. In practice, of course, and (which fix ) and depend on and are constrained by various factors like geographical location of existing facilities, physics goals, cost and design considerations. It is thus useful to examine the behaviour of the production event rate when, for instance, and are fixed and is varied, with a view to optimization.
In figure (4) we plot the tau event-rate for radians, eV2, and baseline length L= 732 km. (The choice of baseline is appropriate to a proposed beam from either CERN to Gran Sasso [20] or from Fermilab to the Soudan laboratory [21].) After the initial rise with energy, it peaks around GeV, and then falls and flattens asymptotically with increasing energy. As the position of this peak with respect to depends on alone, it will remain invariant under changes of and , as long as Eq. (5) remains a good approximation.
Figures 5 and 6 compare the yields per kT-yr for various detection cones, respectively, as beam energy and are varied. For low beam energies where forward peaking of the decay products is not pronounced, narrower detection cones contain fewer events/kT/yr , but for higher energies the behaviour is reversed (figure 5). For instance, a detector which subtends a radians cone will see roughly 11 times more events/kT/year for GeV than one subtending radians, since it intercepts a higher average flux . The assumption of a uniform flux over the area of the detector can thus be misleading, since the event rate scales very non-linearly with the detector area. In Figure (6), the rise in the event-rate as signalled by Equations (5) and (1) in conjunction is clearly apparent upto values of eV2, after which the sinusoidal behaviour sets in.
In conclusion, as illustrated by figures 2 - 6, event rates from beams at muon colliders have several interesting characteristics which are relevant to experimental design and choice of baseline length and beam energy:
-
1.
For a substantial and physically interesting range of , the event rate (events/kT/year) for a fixed is to a very good approximation independent of baseline length for a wide range of beam energies (figure 3 ).
-
2.
For a given choice of say, baseline and detector area fixed , the event rate is maximised at a particular beam energy, independent of the particular values of and over a considerable portion of their range (figure 4).
-
3.
The intense forward peaking expectedly renders detectors with smaller area superior to those with large area at high beam energies, for a fixed available mass of the detector, and we show the extent to which this affects actual event rates in figure (5).
3 Selection of Tau and Wrong - Sign Muon events
An important component of any study for appearance due to oscillations is the event selection strategy for the ’s produced from charged current interactions of the . This has been discussed in the literature in the context of several terrestrial experiments that are already in progress [22], [23]. Strategies for -detection have also received consideration in proposals for future experiments [24], [25].
For neutrino experiments using a muon storage ring, the detailed prescription for event selection can be formulated only after the detector design is specified. There are, however, some basic issues concerning the signals and the backgrounds which all experiments are likely to be concerned with. We base our predictions here on these considerations, implemented within a parton-level Monte Carlo calculation.
The results presented by us are in connection with a detector of mass 10 kT similar to that described in [12], placed perpendicularly to the muon beam axis, with a short, medium or large baseline, incorporating detailed tracking and particle identification facilities.
We have based our first set of calculations on tau-detection through the one-prong hadronic decay channels. This essentially includes the decays , and , with small additional contributions from the and channels [26]. The subsequently decays into . For the decay of , we have confined ourselves to the mode which leads to a single charged-track. The branching ratios into these channels [27] are approximately 11, 25 and 9 respectively, giving a substantial total branching ratio of about . Thus, essentially one should look for one charged pionic track with 0, 1 or 2 neutral pions in a collinear configuration. The total energy, measured from deposits in the electro-magnetic and hadronic calorimeters gives the energy of the , or , which can be combined with the directional information to construct its three-momentum.
The backgrounds for signals of this kind (kinks in the charged tracks with missing ) can come, for example, from re-interaction of the hadronic jets coming out of the deep inelastic scattering (DIS) vertex, particularly in the case of neutral current events. Charmed particle production and decays in the DIS processes can also give rise to potential backgrounds. There is also the possibility of muons (from charged current events with no oscillation) being misidentified as pions. And finally, one can have the so-called ‘white kinks’ arising from one-prong nuclear interactions with no heavy ionising tracks. (These types of kinks usually have small , within about 500 MeV for our energy ranges.)
With the above considerations in mind, our first set of results (for a 10 kT detector) implements the following event selection criteria for a 250 GeV muon beam [28]:
-
•
A minimum of 0.5 GeV.
-
•
a minimum energy of 2 GeV for the one-prong decay products from the tau’s.
-
•
A minimum isolation of = 0.7 between the charged prong from tau-decay and the DIS products, where , and being the differences in pseudo-rapidity and azimuthal angle respectively.
The last criterion ensures that the one-prong charged tracks characteristic of -decays are at such angles with the beam axis as to set them clearly apart from misidentified muons produced from unoscillated ’s as well as from white kinks. At lower (higher) energies, the cut has to be slightly reduced (enhanced) in order to suppress backgrounds with the same effectiveness.
We find that the missing- and isolation cuts taken together can remove the entire set of backgrounds due to unoscillated charged-current events, whereas the neutral current backgrounds are adequately taken care of by the isolation cuts. Taking everything together, the approximate efficiency of tau detection in our parton-level calculation turns out to be 31 (including the branching ratio for one-prong decays). This is commensurate with the efficiencies expected in, for example, the OPERA experiment [25].
Our second set of results is based on tau appearance due to oscillating into . These will lead to wrong-sign muons via charged current interactions. Such signals are relatively background-free; the only significant backgrounds come from charm production at the DIS vertex. For this set of our results we have
-
•
A minimum of 0.2 GeV.
-
•
a minimum energy of 2 GeV for the wrong sign charged lepton decaying from tau (muon and electron).
-
•
A minimum transverse momentum of wrong sign muon/electron of 0.2 GeV
-
•
A minimum isolation of = 0.4 between the wrong sign charged lepton from tau-decay and the DIS products.
Finally, although our focus here is on appearance, we also give results in Section 4 for the detection of oscilations, detectable again by the presence of wrong sign muons, after implementing suitable cuts.
4 Contours for oscillation searches at muon storage rings
In order to demonstrate the possibilities offered by muon storage rings for oscillation studies, we give the corresponding C.L. contours for and for two-flavour mixing. As mentioned earlier, we feel this is adequate at present to obtain a firm feel for the eventual potential of these experiments to comprehensively map the parameter space of neutrino masses and mixing.
Starting with equation (1) for , the ‘bare ’events, and folding in the kinematic cuts described above for event selection and background elimination, one obtains , representing the actual candidate events. Requiring then delineates the C.L. parameter space. Thus, for each contour the average value of the probability
| (6) |
where is computed from equation ( 1) by setting , representing total conversion of ’s to ’s, but imposing the cuts as before. Also, we note that [17] for each contour, the reach in , i.e. its minimum value, occurring when is given to a good approximation by
| (7) |
Since scales as the product of the flux and the cross-section, (having the probability term set to 1), it follows that
| (8) |
Similarly, the ‘knee ’for each contour, i.e. the minimum value of probed occurs when the other oscillating term in equation (2) is approximately 1, hence
| (9) |
which implies that
| (10) |
Finally, the vertical asymptotic part of the contour, occurring when the values of are high enough such that the sine squared term containing it in equation (2) averages to has
| (11) |
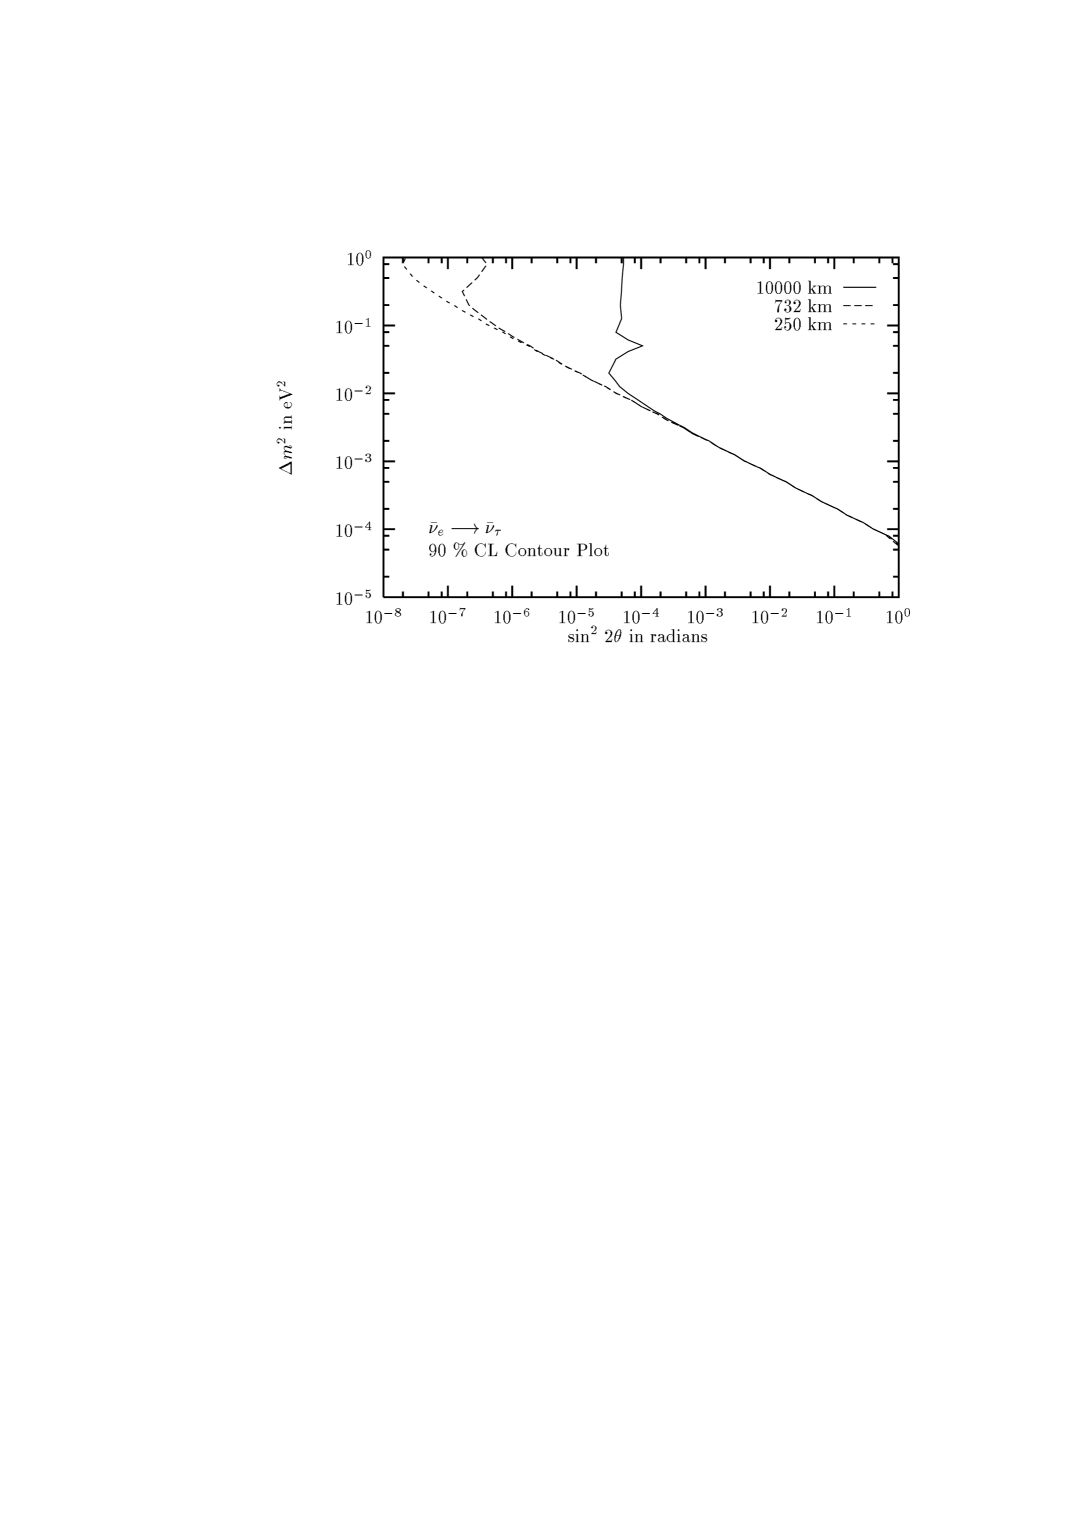
Figures 7,8,9 and 10 show contours for lepton detection via decay modes containing hadronic final states, for muon beam energies of GeV, GeV, and GeV at C.L. for a 10 kT-yr detector, assuming a detection cone of milli radians. Each figure has contours for three different baselines, km (Kamioka to KEK), km (CERN to Gran Sasso or Fermilab to Soudan) and km (Fermilab to Japan). Figures 11,12 and 13 show curves for the same choices of baselines and other parameters, but for energies of GeV, GeV and 250 GeV and for the wrong sign lepton detection for oscillation. For a muon beam energy of GeV, no wrong-sign muon events survive our (conservative) cuts.
In the regions corresponding to small mass-squared differences, all the contours for a given energy tend to merge. This again demonstrates the insensitivity to baseline in these regions. The scaling relation for with length (for a fixed beam energy) ( equation (10) ) is also reproduced well in the contours. Once one compares different energies, however, the scaling is distorted by the presence of energy-dependant cuts and also marginally by the fact that the plots here are for muon beam energies, while the scaling relations are for neutrino energies. It is apparent from Equations (8) and (10) and from the contours that very long baselines offer no advantages for oscillation studies employing neutrinos from muon storage rings, and carry the added burden of impractical detector sizes, at least if conventional detectors are employed 333Our reason for focussing on medium and long baselines is in part due to the geography of existing sites where such experiments may be possible, and in part due to the fact that short baselines may require new and different detectors, which are currently under active study, as discussed in [13, 29].
The dramatic potential for oscillation studies is apparent. Even a modest GeV beam energy is capable of effectively mapping the parameter space indicated by Super K, i.e. and , as can be seen from Fig.7. As expected from equation (10), shorter baselines provide an enhanced reach in (), for the same beam energy and reach in . For searches, muon storage rings provide the potential to greatly exceed limits set by present and past accelerator experiments (NOMAD, CHORUS, CDHS, CCFR and E531) [30]. At present, bounds on this oscillation mode cover the range and eV2. Beam energies of GeV and a baseline of 250 km would allow exploration upto and (Figure 9). Similarly, the wrong-sign muon mode contours (figures 11,12 and 13 ) demonstrate the potential for extending the limits explored for parameters. Current bounds from accelerator and reactor based experiments (NOMAD, CCFR, BUGEY and CHOOZ) [30] go down to eV2 and . A 100 GeV muon beam and a 250 km baseline would extend that to eV2 and respectively.
For convenience, in figures 14 -17, we reproduce our contours showing how different baselines (250 km and 732 km) compare for various energies for both modes of tau appearance discussed above. The distortion of the scaling relations equations (8) and (10) due to the presence of experimental cuts is apparent here, being more pronounced at low beam energies. For 20 GeV and 50 GeV, (Figure (14)) for instance, scales as rather than .
Finally, although our focus here has been the detection of appearance, the experiments discussed here are in a natural position to also study oscillations. The parameter regions which can be explored are shown in figure 18, after incorporating appropriate cuts to remove backgrounds for the wrong-sign muons. Clearly, the region identified by the LSND experiment [31] can be scrutinised with ease at muon storage rings.
5 Conclusions
We have studied the possibilities offered by muon storage rings (at various muon beam energies and baselines ) for appearance experiments in order to determine masses and mixing angles for and oscillations. Tau event rates for such experiments have first been discussed with a view to understanding their variation prior to the inclusion of experimental cuts, in order to better understand how baselines, forward peaking of decay neutrinos with increasing energies, and average fluxes intercepted by detectors of various sizes can affect their optimization. Subsequently, event rates implementing cuts for hadronic and wrong sign leptonic modes are computed and used to plot contours for the parameter regions that can be explored in such experiments, and the expected scaling of the contours with energy and baseline is discussed. The results show that even for modest muon beam energies, convincing coverage and verification of the Super K parameters is possible. In addition, very significant enlargement of present day bounds on the mixing parameters for oscillations to is guaranteed by these types of searches.
In summary, neutrinos from muon storage rings appear to be ideal sources, providing unprecedented potential for oscillation studies in the next millennium and deserve very serious consideration.
6 Acknowledgement
We acknowledge useful conversations with D.P. Roy, D. Choudhury and Probir Roy and also thank S. Geer and B. King for helpful exchanges over e-mail. RG would like to thank the CERN Theory Division for hospitality while this work was in progress.
References
- [1] Y. Fukuda et. al, Phys. Lett. B 433, 9 (1998); Phys. Rev. Lett. 81, 1562 (1998).
- [2] K.S. Hirata et. al, Phys. Lett. B 205, 416 (1998); Phys. Lett. B 280 ,146 (1992); Phys. Lett. B 335,237 (1994).
- [3] D. Casper et. al, Phys. Rev. Lett. 66, 2561 (1991); R. Becker-Sendy et. al, Phys. Rev. D 46, 3270 (1992).
- [4] W.W M. Allison et. al, Phys. Lett. B 391, 491 (1991); T. Kafka, Nucl. Phys. Proc. Supp. 70, 340 (1999).
- [5] M. Apollonio et. al, Phys. Lett. B 420, 397 (1998).
- [6] G.L. Fogli, E. Lisi, A. Marrone and G. Scioscia, Phys. Rev. D 59, 033001 (1999).
- [7] M. Narayan, G. Rajasekaran and S. Uma Sankar,Phys. Rev. D 58, 031301 (1998).
- [8] T. Kajita, hep-ex/9810001, to appear in the proceedings of XVIII Int. Conf. on Neutrino Physics and Astrophysics ( Neutrino ’98) , Takayama, Japan, 4-9 June 1998.
- [9] V. Barger, Overview of Physics at a Muon Collider, Invited talk at the Fourth International Conference on the Physics Potential and Development of a Muon Collider, San Francisco, December 1997; hep-ph 9803480.
- [10] J. Ellis, E. Keil and G. Rolandi, Options for Future Colliders at CERN, CERN-TH/98-033, 1998.
- [11] C. Quigg, Physics with a Millimole of Muons, Summary Talk at the Fermilab Workshop on Physics at the First Muon Collider and at the Front End of a Muon Collider, November 1997, Fermilab - Conf -98/073 -T, hep-ph 9803326.
- [12] S. Geer, Phys. Rev. D 57, 6989 (1998).
- [13] B. King, Neutrino Physics at Muon Colliders, Invited talk at the Fourth International Conference on the Physics Potential and Development of a Muon Collider, San Francisco, December 1997; BNL-65449.
- [14] S. Geer, C. Johnstone and D. Neuffer, Muon Storage Ring Neutrino Source: The Path to a Muon Collider?, Fermilab -TM - 2073.
- [15] A. Bueno, M. Campanelli and A. Rubbia, hep-ph 9809252
- [16] A Bueno, M. Campanelli and A. Rubbia, hep-ph 9808485.
- [17] A. De Rujula, M.B. Gavela and P. Hernandez, hep-ph 9811390.
- [18] C. M. Ankenbrandt et al, (Muon Collider Collaboration) Status Report on Muon Colliders, available at http://www.cap.bnl.gov/mumu/.
- [19] H.L. Lai et. al. (CTEQ Collaboration), Phys. Rev. D 55, 1280 (1997).
- [20] G. Acquistapace et al, CERN 98-02, INFN/AE-98/05, 1998.
- [21] E. Ables et al, MINOS Collaboration, Fermilab Proposal iP-875, 1995.
- [22] CHORUS colaboration, E. Eskut et al., Phys. Lett. B434, 205 (1998); E. Pesen, Nucl.Phys. B. Proc. Supp. 70, 219 (1999).
- [23] NOMAD collaboration, J. Altegoer et al. CERN-EP/98-57; M. Mezzetto, Nucl. Phys. B. Proc. Supp. 70, 214 (1999).
- [24] F. Arneodo et al., Nucl. Phys. B. Proc. Supp. 70, 453 (1999).
- [25] A. Eneditato et al., Nucl.Phys. B. Proc. Supp. 70, 423 (1999).
- [26] B. Bullock, K. Hagiwara and A. Martin, Nucl. Phys. B395, 499 (1993).
- [27] Review of Particle Physics, The European Phys. Jr. C 3, 21 (1998).
- [28] S. Raychaudhuri and D. P. Roy, Phys. Rev. D52, 1556 (1995); ibid, D53, 4902 (1996).
- [29] D. Harris and K. McFarland, Detectors for Neutrino Physics at the First Muon Collider, talk at the Fermilab Workshop on Physics at the First Muon Collider and at the Front End of a Muon Collider, November 1997, Fermilab CONF-98/114.
- [30] J. Conrad, Recent Results on Neutrino Oscillations, Plenary Talk at the International Conference on High Energy Physics, Vancouver, 1998, hep-ex 9811009, and references therein.
- [31] LSND Collaboration; C. Athanassopoulos et. al; Phys. Rev. Lett. 81, 1774 (1998).
| CC Interaction and | Nature of fit | Expression | |
|---|---|---|---|
| Range | |||
| 1. | cubic | ||
| 20 - 100 GeV | |||
| 2. | linear | ||
| 50 - 2000 GeV | |||
| 3. | cubic | ||
| 15 - 2000 GeV |