Exploring the Weak Phase in Decays
Abstract
Measurements of the rates for the hadronic decays along with the CP-averaged branching ratio can be used to bound and extract the weak phase . Using preliminary CLEO data, we obtain the bounds at , and at 90% CL.
1 Introduction
The main target of present and future factories is the study of CP violation. It will provide tests of the flavor sector of the Standard Model, which predicts that all CP violation results from a single complex phase in the quark mixing matrix. The determination of the sides and angles of the unitarity triangle plays a central role in this program.[1] The angle is accessible in a theoretically clean way through the observation of the CP asymmetry in the decay , and a first measurement yielding has just been reported by the CDF Collaboration.[2]
Recently, there has been significant progress in the theoretical understanding of the hadronic decays , and methods have been developed to extract information on from measurements of the rates for these processes. Here, we discuss the charged modes , which are particularly clean from a theoretical point of view.[3]-[5] For applications involving the neutral decay modes the reader is referred to the literature.[6, 7]
2 Theory of decays
The hadronic decays are mediated by a low-energy effective weak Hamiltonian, whose operators allow for three distinct classes of flavor topologies: QCD penguins, trees, and electroweak (EW) penguins. In the Standard Model, the weak couplings associated with these topologies are known. Data show that the QCD penguins dominate the decay amplitudes, whereas trees and EW penguins are subleading and of a similar strength. The theoretical description of the two charged modes and exploits the fact that the amplitudes for these processes differ in a pure isospin amplitude, , given by the matrix element of the isovector part of the effective Hamiltonian between and the isospin eigenstate with . Up to an overall strong-interaction phase , the parameters of this amplitude are determined in the limit of SU(3) flavor symmetry.[3] SU(3)-breaking corrections can be calculated in the factorization approximation,[8] so that theoretical uncertainties enter only at the level of nonfactorizable SU(3)-breaking corrections to a subleading decay amplitude.
A convenient parametrization of the decay amplitudes is
| (1) |
where is the dominant penguin amplitude defined as the sum of all terms in the amplitude not proportional to , and are strong phases, and , and are real hadronic parameters. From a naive quark-diagram analysis, one does not expect the amplitude to receive a contribution from tree topologies; however, such a contribution can be induced through final-state rescattering or annihilation contributions.[9]-[14] They are parametrized by . Model estimates indicate that could be about 5–10%. In the future, it will be possible to put upper and lower bounds on this parameter by comparing the CP-averaged branching ratios for the decays and .[13] Below, we assume ; however, our results will be almost insensitive to this assumption.
The parameter describes the ratio of EW penguin and tree contributions to the isospin amplitude . In the SU(3) limit, it is calculable in terms of Standard Model parameters.[3, 15] The main uncertainty comes from the present errors on and the mass of the top quark. SU(3)-breaking effects, which are included in the factorization approximation, reduce the value of by 6%. In the error analysis we have assigned a 100% uncertainty to this estimate. Note that, if nonfactorizable SU(3) breaking would lead to a further reduction of , this would strengthen the bound on derived below.
The parameter describes the strength of the tree amplitude relative to the leading penguin amplitude. We define a related parameter by writing , so that the two quantities agree in the limit . In the SU(3) limit, this new parameter can be determined experimentally form the relation
| (2) |
Factorizable SU(3)-breaking is accounted for by a factor . This may overestimate the effect; however, reducing the value of would again strenghten the bound on . We thus feel comfortable working with a large positive SU(3) correction and assign an error of 50% to it to account for nonfactorizable effects. Using preliminary data reported by the CLEO Collaboration [16] combined with some theoretical guidance then yields .[3] With a precise measurement of the CP-averaged branching ratios entering (2), the uncertainty in this number could be reduced significantly.
3 Lower bound on
Generalizing an idea of Fleischer and Mannel,[6] a bound on can be derived from a measurement of the ratio of the CP-averaged branching ratios for the two decay modes. The CLEO Collaboration has measured [16]
| (3) |
It is possible to derive an exact theoretical lower bound on by varying the strong phases independently between and . Knowing the other parameters ( from data and from theory), this bound implies an exclusion region for , which becomes larger the smaller the values of and are. Since the branching ratio enters these two quantities in an opposite way, it is advantageous to consider the ratio , for which the experimental error on this branching ratio tends to cancel.[17] The current value is . Theoretically, this ratio has the advantage of being independent of to leading order, and one obtains the bound [3]
| (4) |
An exact formula for the higher-order terms can be found in the literature.[5] For values the exact bound is stronger than the approximate one shown above even after the rescattering effects parametrized by are included. Varying the parameters in the intervals and , and setting , we obtain the bound shown in Figure 1. Note that the effect of the rescattering contribution is very small. The table next to the figure shows the resulting bounds on obtained at different confidence levels, which we obtained taking into account that in the Standard Model the largest allowed value of is 1.35. (This is more conservative than assuming a two-sided Gaussian distribution.)
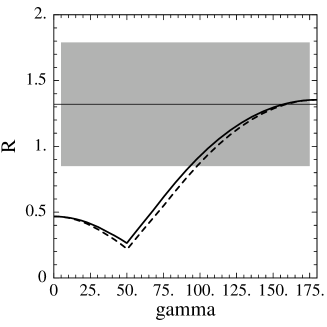
CL Bound 1.32 (mean) 5% 0.85 () 70% 0.56 () 90% 0.41 () 95%
From a global analysis of the available information on the CKM matrix elements, one can derive indirect constraints on that lead to the allowed range , where the upper limit is determined by the current experimental limit on – mixing, whereas the lower bound is deduced from the measurement of CP violation in – mixing.[1] Without this information, i.e. using data from physics alone, this lower bound would disappear, and would still be allowed. The 90% CL bound on derived here, combined with the upper bound from – mixing, implies that , which is a significant improvement over the range obtained from the global analysis. This, together with the fact that as shown by the existence of semileptonic transitions, proves that the unitarity triangle is not degenerate to a line. In the context of the CKM model, this implies direct CP violation in decays.
4 Extraction of
Ultimately, one would like not only to derive a bound on , but to measure this parameter directly from a study of CP violation. Recently, we have described a strategy for extracting from decays,[4] which generalizes a method suggested by Gronau, Rosner and London [18] to include the effects of EW penguins. This approach has later been generalized to account for rescattering contributions to the decay amplitudes.[5]
In addition to the ratio , one considers the following combination of the direct CP asymmetries in the decays :
| (5) |
With this definition, the rescattering effects parametrized by are suppressed by a factor of and thus reduced to the percent level. The same is true for the ratio . Explicitly, we have
| (6) |
For fixed values of and , these equations define contours in the plane. When the rescattering corrections from are included, these contours become narrow bands. From the intersection of the contour bands for and one obtains the values of and the strong phase up to possible discrete ambiguities. For some typical numerical examples, the theoretical uncertainties on the extracted values of resulting from the variation of the input parameters , and are found to add up to a total error of order .[4, 5] A precise determination of this error requires, however, to know the actual values of and . For instance, Gronau and Pirjol [19] find a larger error for the specific case where the product is very close to 1, which would imply a value of the CP asymmetry close to 50%.
5 Conclusions
Measurements of the exclusive hadronic decays provide interesting information on the weak phase . Using CLEO data on the CP-averaged branching ratios of the two charged decay modes, we have derived the bound at 90% CL. This bound is stronger than the lower bound derived from the global analysis of all other information on the CKM matrix. Combined with constraints from – mixing and semileptonic decays, and in the context of the CKM model, it proves the existence of direct CP violation in decays.
Acknowledgments
It is a pleasure to thank the organizers of WIN99, C.A. Dominguez, R.D. Viollier and their staff, for arranging a marvellous meeting in a fantastic setting. I am grateful to Jon Rosner for collaboration on most of the work reported here. I also wish to thank Frank Würthwein for useful comments. This work was supported by the Department of Energy under contract DE–AC03–76SF00515.
References
- [1] For a review, see: The BaBar Physics Book, P.F. Harison and H.R. Quinn eds., SLAC Report No. SLAC-R-504 (1998).
-
[2]
A documentation of this measurement can be found at http://
www-cdf.fnal.gov/physics/new/bottom/cdf4855/cdf4855.html. - [3] M. Neubert and J.R. Rosner, \Journal\PLB4414031998.
- [4] M. Neubert and J.R. Rosner, \Journal\PRL8150761998.
- [5] M. Neubert, \JournalJ. High Energy Phys.020141999 [hep-ph/9812396].
- [6] R. Fleischer and T. Mannel, \Journal\PRD5727521998.
-
[7]
R. Fleischer, \JournalEur. Phys. J. C64511999 and these Proceedings;
A.F. Buras and R. Fleischer, Preprint hep-ph/9810260. - [8] M. Neubert and B. Stech, in: Heavy Flavours (2nd Edition), A.J. Buras and M. Lindner eds. (World Scientific, Singapore, 1998) pp. 294.
-
[9]
B. Blok, M. Gronau and J.L. Rosner,
\Journal\PRL7839991997;
M. Gronau and J.L. Rosner, \Journal\PRD581130051998. - [10] A.J. Buras, R. Fleischer and T. Mannel, \Journal\NPB53331998.
-
[11]
J.M. Gérard and J. Weyers, \JournalEur. Phys. J. C711999;
D. Delepine et al., \Journal\PLB4291061998. - [12] M. Neubert, \Journal\PLB4241521998.
- [13] A.F. Falk et al., \Journal\PRD5742901998.
- [14] D. Atwood and A. Soni, \Journal\PRD580360051998.
- [15] R. Fleischer, \Journal\PLB3653991996.
- [16] J. Alexander, talk at the 29th Int. Conf. on High-Energy Phys., Vancouver, B.C., Canada, July 1998; see also: CLEO Collaboration (M. Artuso et al.), Conf. contribution CLEO CONF 98-20.
- [17] We are indebted to Frank Würthwein for pointing out the correlation of errors in the measurements of and , which was not taken into account in our original analysis.[3]
- [18] M. Gronau, J.L. Rosner and D. London, \Journal\PRL73211994.
- [19] M. Gronau and D. Pirjol, Preprint hep-ph/9902482.