Measurement of R Between 2-5 GeV
Abstract
We have obtained measurements of the total cross section for annihilation into hadronic final states for 6 energy points (2.6, 3.2, 2.4, 3.55, 4.6, and 5.0 GeV) with the upgraded Beijing Spectrometer (BESII). We report preliminary values from this data and outline future plans for a finer scan in the 2-5 GeV energy range.
I Introduction
Two topics that depend on measurements in the center of mass (CM) energy range of a few GeV are of current interest. One is the precision of the QED coupling constant evaluated at the mass of the boson, , and the other is the anomalous magnetic moment of the muon, . Both are accessible via a measurement of the lowest order cross-section for hadrons, which is usually parameterized in terms of the ratio , defined as
| (1) |
where the denominator is the lowest-order QED cross section and equals .
The ratio has been measured by many experiments over a large CM energy range from the hadron production threshold to the mass [1]. Experimentally determined values are, in general, consistent with theoretical predictions, and provide an impressive confirmation of the hypothesis of three color degrees of freedom for quarks.
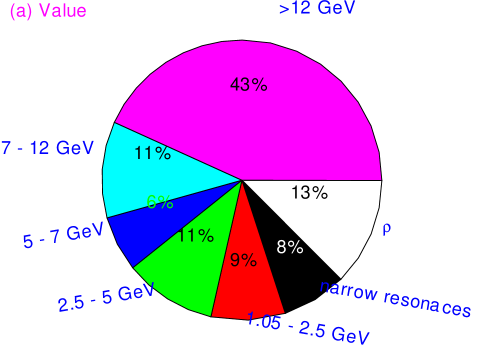
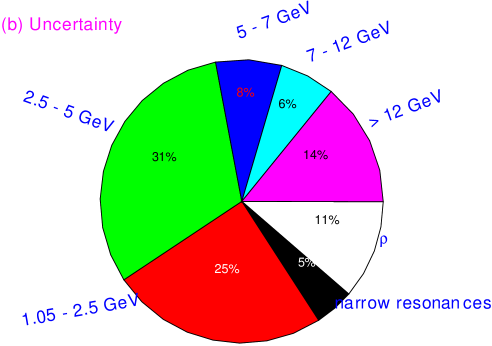
The current values for R below 5 GeV have experimental uncertainties on the order of 15%[2, 3, 4, 5]. These uncertainties limit the precision of and and in turn the determination of the Higgs mass from radiative corrections in the standard model[6, 7, 8]. For example, the contributions to the value of and the error in are shown in Figures 1 and 2.
The BES collaboration has started a program of R measurements over the 2-5 GeV energy range with the goal of reducing the present uncertainties by a factor of two or more.
II Detector
The measurements were carried out with the upgraded BES detector (BESII), which is a conventional solenoidal detector that is described in some detail in Ref. [10]. Upgrades included the replacement of the central drift chamber with a vertex chamber (VC) composed of 12 tracking layers organized around a beryllium beam pipe. This chamber provides a spatial resolution of about 90 m. The barrel time-of-flight counter (BTOF) was replaced with a new array of 48 plastic scintillators that are read out by fine mesh photomultiplier tubes situated in the 0.40 T magnetic field volume, providing 180 ps resolution. A new main drift chamber (MDC) has 10 superlayers, each with four sublayers of sense wires. It provides information for particle identification and has a momentum resolution of for the charged tracks with momentum in GeV. The sampling-type barrel electromagnetic calorimeter (BSC), which covers 80% of 4 solid angle, consists of 560 cells along the direction, with each cell containing 24 layers in the radial direction. The BSC operates in the self-quenching streamer mode with an energy resolution of (E in GeV) and a spatial resolution of 7.9 mrad in and 3.6 cm in . The outermost component of BESII is a identification system consisting of three double layers of streamer tubes interspersed in the iron flux return of the magnet. These measure coordinates along the muon trajectories with resolutions of 3 cm and 5.5 cm in and , respectively.
III Data Analysis
A first scan of measurements was performed this spring with data samples of about 1000-2000 hadronic events collected each at 2.6, 3.2, 3.4, 3.55, 4.6 and 5.0 GeV. To understand beam-associated backgrounds, separated beam data were taken at each energy point, and single beam data were accumulated at 3.55 GeV. Additionally, data were taken at the and resonances to provide a precise energy calibration as well as a cross check of the trigger efficiencies for the Bhabha, dimuon and hadronic events measured in the R scan. The 3.4 GeV point was remeasured after a time interval of about two weeks to test the stability of the detector.
The value of is determined from the number of observed hadronic events () by the relation
| (2) |
where is the tree-level cross-section of the particular process, is the number of beam associated background events; and are the numbers of misidentified lepton-pair and two-photon processes events; is the integrated luminosity; is the correction for initial state radiation; and and represents the detection and trigger efficiency for the hadronic events. In the following sections, we examine each of these factors in detail.
A Run Stability and Performance
A 1.5M event sample was used for detector calibration and for monitoring the data quality and the stability of the detector performance. These data indicated that the BESII detector performance was stable and the data quality was good. Figure 3 shows the time dependence of MDC momentum resolution, BSC energy resolution, BTOF time resolution and pulse heights for Bhabha events.

B Hadronic Event Selection
The goal of hadronic event selection was to distinguish single-photon hadron production from other processes. The following track-level selection criteria were used to define good charged tracks:
-
, where is the track polar angle;
-
The track must have a reasonable three-dimensional helix fit;
-
Distance of closest approach to the beam in the transverse plane and along the beam axis are less than 2.0 and 15 cm, respectively;
-
, where and are the momenta of the track and the beam, respectively, and is the momentum resolution of the beam;
-
, where and are the energy of the track (as measured in the BSC) and beam, respectively, and is again the momentum of the track;
-
A track must not be definitely identified as an electron via dE/dx information;
-
A track must not be definitely identified as a muon;
-
(in ns), where and are the time-of-flight for the track and a nominal time-of-flight calculated for the track assuming a proton hypothesis, respectively, and is the BTOF time resolution.
After the track-level selection, a further event level selection was applied via the following:
-
At least 2 good charged tracks, with at least one track having a good helix fit;
-
A total deposited energy in the BSC .
A further selection scheme was required based on the number of good tracks in the event. For three or more prong events, the only additional requirement was that all the charged tracks not be positive (to remove beam-gas events). However, two-prong events needed to be distinguished from cosmic ray and lepton pair events, requiring a further selection scheme:
-
The two tracks must not have been back-to-back:
(3) -
At least two isolated neutral tracks fulfilled the following:
(4) where and are the and angle of either of the two charged tracks.
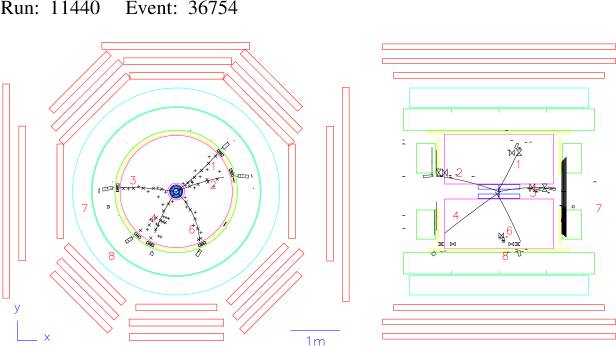
The performance of the event selection routines were checked by hand scans, which were carried out for both the selected and rejected hadronic events, the separated-beam data, and the Monte Carlo events. A typical hadronic event that passed the selection cuts is shown in figure 4. We determined the error associated with the hadronic selection criteria from changes in the event yield caused by varying the selection requirements and from the results of the hand scan.
C Background Subtraction
There were three major types of background to be considered. One type, consisting of cosmic rays, Bhabha, dimuon events and some two-photon process events, was directly selected out during the event selection routine. The second, consisting of tau-pair production and residual two-photon processes, was subtracted out statistically via a Monte Carlo simulation.
Finally, the most serious sources of background in the hadronic event sample were beam-gas and beam-wall interactions. Most of the beam-gas and beam-wall background events were rejected by a vertex cut. The salient features of the beam associated background were that their tracks were very much along the beam pipe direction, the energy deposited in BSC was small, and most of the tracks were protons. The same hadronic event selection criteria were applied to the separated-beam data, and the number of separated-beam events surviving these criteria were obtained. The number of the beam associated background events in the corresponding hadronic event sample was given by , where was determined by the ratio of the products of the pressure P at the collision region times the integrated beam currents I, i.e. .
D Luminosity
The integrated luminosity was determined using large-angle Bhabha events with the following selection criteria, using only BSC information:
-
Two clusters in the BSC with largest deposited energy in the polar angle ;
-
Each cluster with energy GeV (for 3.55 GeV data, scaled for other energy points);
-
, where and are the azimuthal angles of the clusters to account for radiative events.
A cross check using only MDC information (dE/dx) was generally consistent with the BSC measurement; the difference was taken into account in the systematic error.
E Hadronic Detection Efficiency
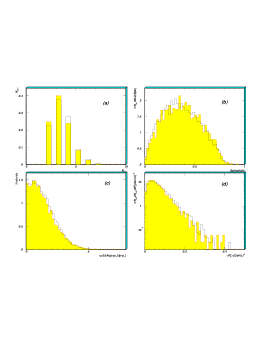
The detection efficiency for hadronic events was determined via a Monte Carlo simulation using the JETSET7.4 event generator[11]. Parameters in the JETSET7.4 generator were tuned using more than 40,000 hadronic events selected from the tau mass measurement data sample[12]. The parameters of the generator were adjusted to reproduce distributions of kinematic variables such as multiplicity, sphericity, transverse momentum, etc. Figure 5 shows the charge multiplicity, the sphericity, the aplanarity and the transverse momentum distributions for the real and simulated event samples.
F Trigger
A two-level trigger system retained good events while rejecting background [10]. The trigger was derived from signals from a beam pickup electrode located upstream of the detector and from each sub-detector. Event categories were classified according to numbers of charged and neutral tracks seen at the trigger level. For beam crossings with charged tracks, two trigger channels were utilized: in the first, we required at least one hit in the 48 BTOF counter array, one track in the VC and MDC, and at least 150 MeV of energy deposited in the BSC; in the second, we required back-to-back hits in the BTOF counter with one track in the VC and two tracks in the MDC. For the neutral track trigger, we required that the sum of the deposited energy of the tracks in two cells of the BSC was greater than 80 MeV and the total energy deposited in BSC from all sources was greater than 800 MeV.
All coincidences were formed using 40, 120, 630, 640 ns wide gates derived from the beam pickup signal for the TOF, VC, MDC and BSC, respectively. Event candidates fulfilling the two-level criteria were accepted.
The trigger efficiencies were measured run by run by comparing the responses to different trigger requirements. As a cross check, data taken in special runs made at the resonance was used to provide independent measurements of the trigger efficiencies. Table I lists the measured efficiencies for different event types in the R scan data, as well as the cross-check performed using data. The errors in the trigger efficiencies for Bhabha and hadronic events were less than 0.5%.
| Event type | |||
|---|---|---|---|
| Data set | Bhabha | dimuon | hadronic |
| R data | 99.5% | 98.2% | 99.2% |
| data | 99.6% | 98.2% | 99.9% |
G Initial State Radiation
The effect of radiative corrections on the measured cross-section was examined in detail. Four different schemes were examined: Berends and Kleiss[13], Kuraev and Fadin[14], Bonneau and Martin[15], and a method used by the Crystal Ball[16]. Radiative corrections calculated by all these methods were consistent to within 1% for off-resonance points, but could differ by 1-3% in resonance regions.
We used the approach of Bonneau and Martin, with the differences from the other schemes included in the systematic error.
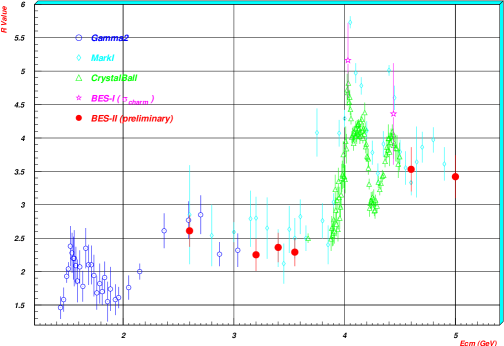
H Preliminary Results
The preliminary R values obtained at the six energy points are shown in Table II and graphically displayed in Figure 6. A further breakdown of contributions to the systematic errors is given in Table III.
| (nb-1) | R value | Systematic error | Statistical error | ||||||
|---|---|---|---|---|---|---|---|---|---|
| 2.60 | 5617 | 8 | 292.9 | 0.5482 | 1.009 | 12.840 | 2.61 | 6.59% | 1.36% |
| 3.20 | 2051 | 10 | 109.3 | 0.6430 | 1.447 | 8.477 | 2.25 | 5.65% | 2.27% |
| 3.40 | 2149 | 46 | 135.3 | 0.6961 | 1.173 | 7.509 | 2.36 | 6.80% | 2.26% |
| 3.55 | 2672 | 50 | 200.2 | 0.6840 | 1.125 | 6.888 | 2.29 | 7.17% | 2.03% |
| 4.60 | 1497 | 48 | 87.7 | 0.8227 | 1.079 | 4.102 | 3.53 | 8.93% | 2.98% |
| 5.00 | 1648 | 26 | 102.3 | 0.8453 | 1.068 | 3.472 | 3.42 | 10.27% | 3.02% |
| Had. select | Background | -pair | Bhabhas | Had. efficiency | Trigger | Rad. corr | ||
|---|---|---|---|---|---|---|---|---|
| 2.60 | 5.25 | 0.06 | 2.12 | 0.00 | 0.04 | 2.60 | 0.50 | 2.00 |
| 3.20 | 4.03 | 0.15 | 2.83 | 0.00 | 0.04 | 1.90 | 0.50 | 2.00 |
| 3.40 | 5.06 | 0.27 | 2.83 | 0.00 | 0.04 | 2.90 | 0.50 | 2.00 |
| 3.55 | 6.05 | 0.27 | 2.32 | 0.00 | 0.04 | 2.30 | 0.50 | 2.00 |
| 4.60 | 7.58 | 0.75 | 2.16 | 0.32 | 0.00 | 3.60 | 0.50 | 2.00 |
| 5.00 | 9.00 | 1.26 | 2.81 | 0.32 | 0.00 | 3.20 | 0.50 | 2.00 |
IV Future Plans
The main goal of the first scan was a careful understanding of the trigger and hadronic event acceptances, as well as the hadronic event selection and the background subtraction, which are central to a total cross section measurement. In 1999, BES-II will carry out a finer scan from 2 to 5 GeV as indicated by Figure 7. Our goal is to reduce the present uncertainties of by at least a factor of two over this entire energy region.

V References
REFERENCES
- [1] Particle Data Group, Eur. Phys. J. C3 204 (1998).
-
[2]
F. Ceradini et al., Phys. Lett. B47 (1973) 80;
B. Batoli et al., Phys. Rev. D6 (1972) 2374;
M. Bernardini et al., Phys. Lett. B51 (1974) 200. - [3] G. Cosme et al., Phys. Lett. B40 (1972) 685.
- [4] M. Kurdadze et al., Phys. Lett. B42 (1972) 515.
- [5] A. Litke et al., Phys. Rev. Lett. 30 (1973) 1189.
- [6] A. Blondel, plenary talk at ICHEP’96, Warsaw.
- [7] B. Pietrzyk, Rad. Corr. Conf., Cracow 1996.
- [8] M. Davier and A. Hoeker, LAL 97-85.
- [9] H. Burkhardt and B. Pietrzyk, Phys. Lett. B356 (1995) 398.
- [10] J.Z. Bai et al., Nucl. Instr. and Methods in Phys. Research A344 (1994) 319.
- [11] Torbjoen Sjoestrand, LU TP 95-20.
- [12] X.R. Qi et al., to be published on High Energy Physics and Nuclear Physics (in Chinese).
- [13] F.A. Berends and R. Kleiss, Nucl. Phys. B178 (1981) 141.
- [14] E. A. Kuraev and V. S. Fadin, Sov. J. Nucl. Phys. 41 (3) (1985) 3.
- [15] G. Bonneau and F. Martin, Nucl. Phys. B27 (1971) 387.
- [16] C. Edwards et al., SLAC-PUB 5160 (1990)