QCD at High Energy (hadron-hadron, lepton-hadron, gamma-hadron)
This talk summarizes recent QCD results from HERA, the Tevatron Collider and Tevatron fixed target experiments.
1 Introduction
As implied by the title of this talk, the topics to be discussed cover a very wide range, encompassing QCD results from the Tevatron collider, the HERA collider and the Tevatron fixed target experiments. In my talk, I will not try for a totally comprehensive review, but instead will discuss some of the important experimental and phenomenological developments in perturbative QCD since the last Rochester conference. I will not be covering deep inelastic scattering results per se, which will be discussed in the summary talk of Tony Doyle; instead I will present results which emphasize the details of the hadronic final state in DIS and photoproduction events. Similarly, I will not discuss diffraction which will be the subject of the review talk by Martin Erdmann. Many of the recent developments in the theory/phenomenology world, along with a discusion of our current understanding of , will be contained in the talk of Yuri Dokshitzer.
The main theme of my talk will be the success with which perturbative QCD has been applied to the data from Fermilab and from HERA. There are enough mysteries left, however, to make life interesting (and to provoke the need for larger data samples), with several of the mysteries involving the remaining uncertainties in the gluon distribution. DGLAP-based perturbative QCD predictions remain very successful and the search for convincing evidence for BFKL effects continues.
2 Tevatron Collider
In the Tevatron collider, 900 GeV protons collide with 900 GeV antiprotons leading to a center-of-mass energy of 1.8 TeV, the highest energy currently accessible. The Tevatron collider completed a very successful Run 1 in 1996 with each experiment (CDF and D0) accumulating on the order of 100 of data. Most analyses have been published or are nearing publication.
2.1 Inclusive Jet Production at the Tevatron
The inclusive jet cross section in the central rapidity region has been measured by both the CDF and D0 experiments at a center of mass energy of 1.8 TeV. Jets are defined using an iterative fixed cone algorithm with a radius R () of 0.7. The measurement spans the transverse energy range from 15 GeV/c to the order of 500 GeV/c; in this range the jet cross section drops by over 9 orders of magnitude. The highest jet events probe the smallest distance scales ( cm) currently accessible. Any new physics that might exist at these distance scales, such as compositeness, might manifest itself in the jet cross section measurement.
The jet cross sections from both experiments are corrected for detector measurement and resolution effects and are compared to next-to-leading order (NLO) QCD calculations. The theoretical uncertainties in inclusive jet production are greatly reduced at NLO as compared to leading order. The two programs that are currently in use are JETRAD and EKS. JETRAD generates the NLO inclusive jet cross section by a Monte Carlo phase space slicing technique while EKS is an analytical calculation. Both programs are implementations of the same matrix elements and give essentially equivalent results when the same cuts/conditions are applied. At NLO, the sensitivity of the jet cross section to the renormalization/factorization scale is reduced, but still present. The value of this scale should be proportional to the hardness of the scatter. It is convenient to set the renormalization and factorization scale equal to a multiple of the of the measured jet. One can also set these scales to a multiple of the maximum of all jets in the event (), at the cost of introducing another variable into the prescription. Typically, is used in the EKS program while is used in JETRAD. aaaIn the JETRAD program, each Monte Carlo event has 2 or 3 partons in the final state, leading to a possibility of either 2 or 3 jets. The of each individual jet is not known until a jet clustering algorithm has been applied (the two lower partons may be clustered if they are close together). The only scale known unambiguously at the time of the event generation is the of the most energetic parton (). A version of JETRAD also exists in which a second pass is made through the generated events, allowing the use of the scale . may be a more “natural” choice for an inclusive jet cross section, but /2 is also acceptable. The use of rather than leads to a reduction in the jet cross section of 7% at = 50 GeV/c decreasing to % at = 100 GeV/c. The effect on the NLO inclusive jet cross section of variations in the renormalization/factorization scale, the value of (the minimum separation of the two partons for them to be considered as two separate jets), and the choice of parton distribution functions (pdf’s) is investigated in more detail in Ref. 6.
The picture that has been adopted for jet production is that the final state consists of 2 or 3 partons from the hard scatter accompanied by an underlying event due to the collision of the proton and antiproton remnants. The underlying event is taken to be identical to that observed in minimum bias events and its contribution to the jet cone energy is subtracted before any comparisons to theory. This picture has been successful but may be incomplete; there may be additional contributions to the underlying event from double parton scattering and higher order radiation effects that may not be included in the subtracted minimum bias level and may not be correctly described by the NLO QCD calculations. A uniform extra contribution to the jet energy might manifest itself as a jet profile broader in experiment than in theory. Such an effect has already been observed by both CDF and D0. The main impact of any underestimate of the underlying energy level in jet events would be on lower energy jets.
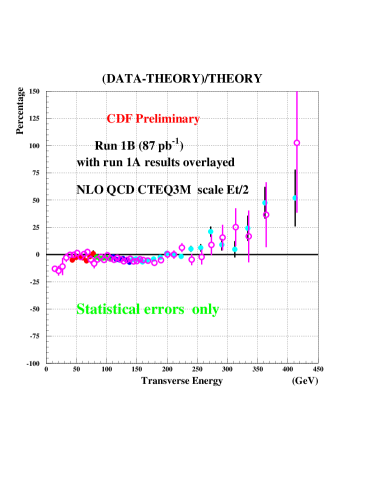
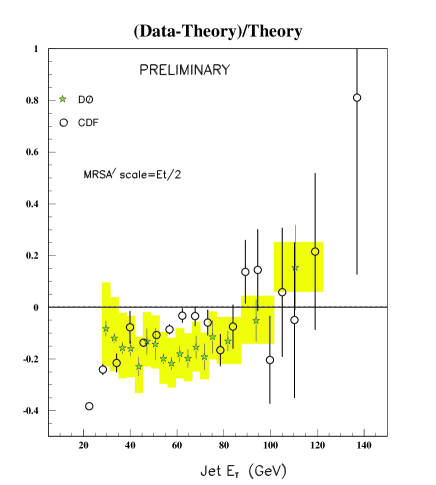
The CDF collaboration has previously published the inclusive jet cross section from Run 1A (19.1 ) for . A linear comparison of (Data-Theory)/Theory is shown in Figure 1 along with the preliminary results from Run 1B(87 ). Good agreement with the NLO prediction is observed except at the highest values of transverse energy. The excess is inconsistent with the (highly correlated) systematic error of the measurement and cannot be explained by a different choice of renormalization and/or factorization scale, or by a different choice of conventional parton distribution function.
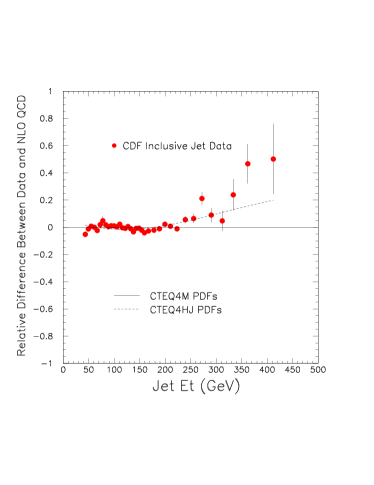
The CTEQ collaboration has performed a global pdf fit using the Run 1A jet data from CDF, giving a large emphasis in the fit to the high data. The resulting fit (CTEQ4HJ) contains a gluon distribution substantially greater (by a factor of 2 at x=0.5) than that in conventional pdf’s. The larger gluon distribution at high x leads to a greater cross section at high (20% at 450 GeV/c). The increased jet cross section prediction does not pass directly through the center of the high data points, but does pass through the bottom of the error bars. The CDF jet cross section from Run 1B is shown in Figure 2 compared to the NLO QCD predictions using the CTEQ4M and CTEQ4HJ pdf’s.
For high jet production, the dominant subprocess is scattering. The gq subprocess comprises only 20% of the cross section and the gg subprocess contribution is minimal. For this reason, an increase in the gluon distribution of a factor of 2 leads to only a 20% increase in the jet cross section. The quark distributions are also free to change in this fit, but are tightly constrained by the highly precise deep inelastic scattering (DIS) and Drell-Yan (DY) data at these x values.
It may seem suprising that the gluon distribution has this degree of flexibility. A recent CTEQ paper explored the uncertainty in the gluon distribution by performing a gluon parameter scan, utilizing the DIS and DY data used in the CTEQ4 fit. The resulting pdf’s were excluded if there were any clear conflicts with any of the data sets. The pdf’s that remain are shown in Figure 3 and indicate that the gluon is tightly constained at lower x. DIS and DY data provide little constraint, however, on the high x gluon distribution and this is demonstrated in the much wider variation observed in the large x region. (The CTEQ4HJ gluon distribution is also indicated for comparison purposes.) In previous pdf’s this constraint has been provided either by fixed target direct photon data and/or jet data from the Tevatron collider. Due to evolution effects, the gluon distribution is more tightly constrained (for ) at high than at low .

D0 has presented at this conference a measurement of the inclusive jet cross section for (and for direct comparison to CDF) with a substantially reduced systematic error. The cross section for is compared to NLO QCD predictions with several pdf’s in Figure 4. Good agreement is observed with perhaps some sign of an excess at moderate to high when the CTEQ3M and CTEQ4M pdf’s are used. The data is uniformly larger than the prediction using the MRST pdf. This latter deviation is due to the substantially weaker MRST gluon distribution at high x (see Section 3.1).

Taking into account the correlations in the systematic errors, reasonable values are obtained for all 3 pdf’s. The MRST prediction agrees in shape with the D0 data, although not in normalization. The best agreement (nominally better than MRST) is obtained with the CTEQ4HJ pdf (shown in Figure 5 for ).
A reanalysis of data from SLAC and NMC, taking into account nuclear binding effects in the deuteron, predicts a larger d quark distribution at high x than found in modern pdf’s. One of the consequences of this larger high x d quark distribution would be an enhanced high jet cross section (by about 10% at the highest values).

A direct comparison of the CDF Run 1A and D0 jet cross sections is shown in Figure 6. Aside from a normalization shift of 5%, the two experiments obtain very similar jet cross sections, with the most noticeable difference being in the last two data points. A normalization shift of this magnitude is to be expected since CDF and D0 use different values for the total inelastic cross section. D0 has calculated a low probability for their jet data to agree with the physics curve drawn through the CDF Run IA data, but if the correlated errors for both experiments are taken into account, there is agreement between the two at the 46% level of probability.

2.2 Dijet Cross Sections at the Tevatron
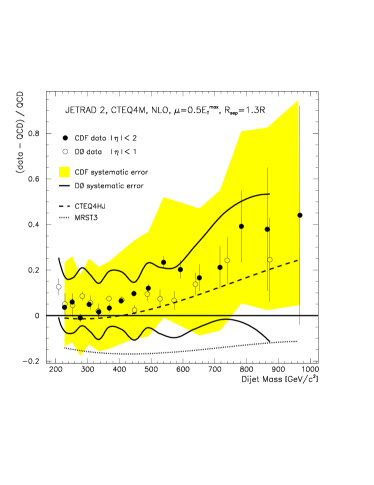
Both experiments have reported results for the dijet mass cross section and observe agreement with each other and with NLO predictions, albeit with an excess at high dijet mass consistent with that predicted by the CTEQ4HJ pdf, as shown in Figure 7.
D0 has used the dijet mass cross section ratio of over to test for compositeness. At the 95% CL limit, a compositeness scale of 2.4 TeV can be excluded. Previous measurements of the dijet angular distribution provided an exclusion of 2.0 TeV.
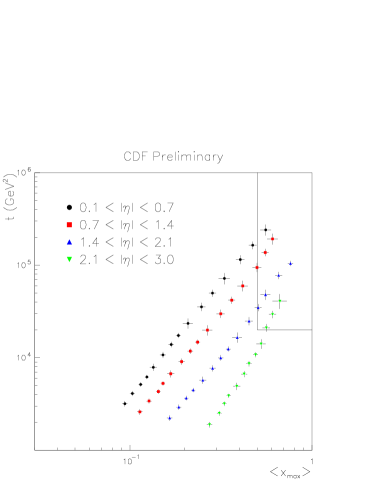
CDF has presented a measurement of the differential dijet cross section in which one jet (the trigger jet) is required to be central (), while the other jet (the probe jet) can have any rapidity value up to 3.0. The differential dijet cross section is then plotted versus the transverse energy of the trigger jet, for the 4 different probe jet rapidity intervals. The measurement presented in this way takes best advantage of the better jet resolution CDF has in the central rapidity region. This measurement also directly probes higher x values than the inclusive jet cross section. The dijet cross section is sensitive to the high x gluon distribution and anything unusual that may occur at high x and . This can be seen from Figure 8 where is plotted versus for the dijet cross section bins. The box in the upper right-hand corner indicates the region of phase space where a possible excess at HERA has been probed. bbbFor those of you who still do not get the Prince joke, please send email to me at the address given.
A comparison of the measured dijet cross sections to predictions using the CTEQ4M, CTEQ4HJ and MRST pdf’s is shown in Figure 9. An excess is observed at high (corresponding to high x) for each of the probe jet rapidity bins. The size of the excess is decreased when the CTEQ4HJ pdf is used. A detailed conclusion may wait, though, until a more detailed study of the adequacy of the NLO predictions is carried out for the high , high region. (At very high x, multijet final states are common and NLO phase space may not be adequate.) The MRST predictions are uniformly below the data at all values due to the weaker gluon distribution discussed previously.

Whenever two jets of roughly equal values are separated by a large rapidity interval, the emission of gluons in the rapidity region between the two jets generates logarithmic contributions [] to the dijet cross section which need to be resummed using the BFKL equation. Naive BFKL predictions lead to behavior that differs dramatically from that obtained from fixed-order perturbative predictions. The imposition of kinematic constraints on the calculations, however, supresses the BFKL-like behavior at the Tevatron and reduces the chances of unambiguous observation of BFKL signatures. The kinematic environment at the LHC will be more favorable for observation of BFKL-like behavior.
2.3 Jet Production at 630 GeV and the Scaling Ratio
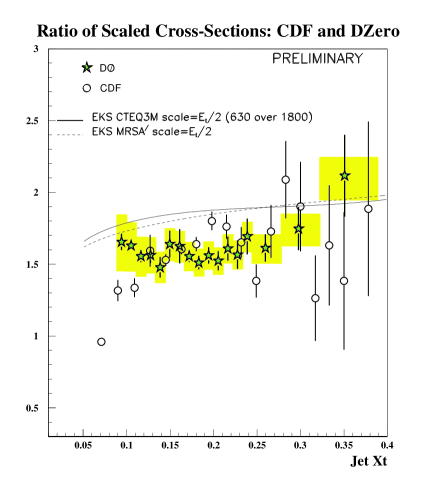
CDF and D0 have both presented measurements of the inclusive jet cross section at 630 GeV, and of the scaling ratio. A comparison of the cross sections of the two experiments to NLO predictions is shown in Figure 10. For both experiments, deviations from the NLO predictions are observed for jet values below 90-100 GeV/c. When the scaled cross section ratio ( for 630/1800) is plotted versus (=), many of the systematic uncertainties cancel for both experiment and theory. A naive parton model prediction would give a value for the ratio of 1.0; QCD effects change the prediction to closer to 2 (with some dependence on as observed). Both experiments have measured an scaling ratio lower than the theoretical prediction for . (See Figure 11.) A similar discrepancy was observed for an earlier comparison of 546 GeV jet data to 1800 GeV jet data. The reason for the discrepancy is still under theoretical investigation and may be due to a combination of effects (underlying event subtraction, initial state and additional non-perturbative jet fragmentation effects (“splashout”)).
2.4 W + Jet(s) Production at the Tevatron
Another ratio of observables with reduced systematic errors is the ratio of W + jet(s) production to W production. This measurement is naively sensitive to the value of and, in fact, was originally proposed as a means of measuring . D0 has reported an exclusive measurement of W+1 jet production to W + 0 jet production at several recent conferences. The jets were measured with the standard D0 jet algorithm using a cone radius of 0.7. The result was in serious disagreement with the NLO QCD predictions and no choice of scale or pdf provided any significant improvement.

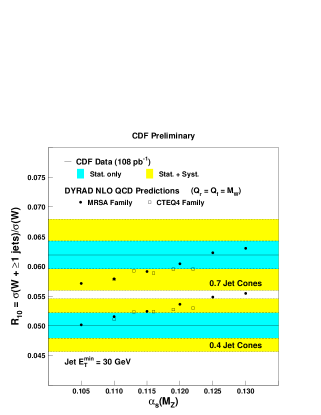
CDF has measured the ratio of W+1 jet to inclusive W production () using a jet cone radius of 0.4 and (new for this conference) 0.7. A comparison of both cone size results to NLO QCD predictions in Figure 12 indicates good agreement. In Figure 13, the CDF data is compared to NLO predictions using a variety of pdf’s corresponding to different values. The theoretical predictions have a surprisingly small dependence on the value of . The experimental ratio of with 0.7 cones to with 0.4 cones is shown in Figure 14 along with the theoretical predictions. The experimental ratio is larger than the theoretical one, which is another indication that jets at the Tevatron are broader than the theoretical predictions. A subtraction of an extra underlying event energy contribution would improve the agreement of the experimental jet shape with theory, and thus improve the agreement of the experimental (0.7/0.4) ratio with the theoretical one.

3 Tevatron Fixed Target
3.1 Direct Photon Production
Direct photon production has long been viewed as an ideal vehicle for measuring the gluon distribution in the proton. The quark-gluon Compton scattering subprocess () dominates production in all kinematic regions of pp scattering, as well as for low to moderate values of parton momentum fraction in scattering. As mentioned previously, the gluon distribution is relatively well constrained at low () by DIS and DY data, but less so at larger . Consequently, direct photon data have been incorporated in several modern global parton distribution function analyses and can, in principle, provide a major constraint on the gluon distribution at moderate to high x.
A pattern of deviations of direct photon data from NLO predictions has been observed, however, with the deviations being particularly striking for the E706 experiment. The origin of the deviations lies in the effects of initial state soft gluon radiation, or . Direct evidence of this has long been evident from Drell-Yan, diphoton and heavy quark measurements. The values of per parton vary from 1 GeV/c at fixed target energies to 3-4 GeV/c at the Tevatron collider. The growth is approximately logarithmic with center of mass energy.

Perturbative QCD corrections at the NLO level are insufficient to explain the size of the observed and full resummation calculations are required to explain Drell-Yan, W/Z and diphoton distributions. These resummation calculations correctly describe the growth of the with center-of-mass energy. In a type of resummation calculation, there are typically two scales involved, which are important to the problem, and which differ greatly in magnitude from each other. In the case of direct photon production, the two scales are the mass and (or ) of the photon-jet system. Instead of examining the effects of the soft gluon resummation on the photon-jet mass cross section per se, one can instead look at the effects on the distribution of the photon alone.
Currently, there is no rigorous resummation calculation available for single photon production. The calculation is quite challenging in that the final state parton takes part in soft gluon emission and in color exchange with the initial state partons, in contrast with the Drell-Yan and diphoton cases. Also, the calculation is complicated by the fact that several overlapping power-suppressed contributions can contribute. In lieu of a rigorous calculation of the resummed direct photon distribution, the effects of soft gluon radiation can be approximated by a convolution of the NLO cross section with a Gaussian smearing function. The value of to be used for each kinematic regime is taken directly from relevant experimental observables, rather than from a theoretical prediction.
The behavior of the smearing correction is quite different for the Tevatron collider and for fixed target energies. In Figure 15 is shown the comparison of NLO theory calculations (with and without the corrections) to the direct photon data from CDF and D0. The value of used (3.5 GeV/c) was taken directly from diphoton measurements at the Tevatron.
There are two points to note: (1) the agreement with the data is improved if the correction is taken into account and (2) the smearing effects fall off roughly as . The latter behavior is the expectation for such a power-suppressed type of effect.

The correction obtained for E706 at a center of mass energy of 31.6 GeV is shown in Figure 16. The value of of 1.2 GeV was obtained from measurements of several kinematic variables in the experiment. The smearing effect is much larger here than observed at the collider and does not have the falloff. This can be understood from the following argument. At low an value of 1.2 GeV/c is non-neglible compared to the in the hard scattering, and the addition of the smearing both increases the size of the cross section and steepens the slope. At high (corresponding to large ), the unmodified NLO cross section becomes increasingly steep (due to the rapid falloff of the parton densities) and hence the effect of the smearing again becomes larger.

For both the fixed target and collider cases, the smearing increases the size of the observed cross section. The direct photons are only measured above a given threshold. The direct photon distribution is steep and the net effect of the smearing (or a more complete resummation treatment) is to transport events from below the threshold to above the threshold, thus increasing the observed cross section.
The uncertainty in the value of is estimated by the E706 authors to be GeV. The effect of this variation on the correction is shown in Figure 16 and can be observed to be quite sizeable. Also shown is the correction used in the recent MRST paper. The MRST paper uses an analytic smearing correction technique with an per parton value of 1.3 GeV/c. cccThe MRST paper quotes a smaller value for the used for E706. This smaller value is equivalent to 1.3 GeV/c in the convention used in this talk and in Reference 29.
The E706 direct photon cross sections for pBe collisions at = 31.6 GeV is shown in Figure 17 along with the NLO theoretical predictions for the range of corrections. Very good agreement is obtained with the use of the nominal value of ; the experimental cross section differs both in magnitude and shape from the NLO prediction with no correction. Also shown in the figure are the data and theoretical predictions for production. NLO calculations for production have a greater uncertainty than those for direct photon production since they involve parton fragmentation. However, the effects are expected to be generally similar to those observed in direct photon production, and the data can be used to extend tests of the consequences of smearing. The presence of an additional value of a magnitude similar to that needed for single photon production leads to a substantially improved agreement between the data and theory.
The same comparison is made in Figure 18 using the CTEQ4HJ pdf’s. Good agreement is observed at low but the theoretical prediction is larger than the data at high . As mentioned previously, the dominant mechanism for direct photon production is gluon-quark scattering, so an increase in the gluon distribution in this range by a factor of 2 leads to an increase in the direct photon cross section by the same factor. Similar conclusions are obtained with the E706 data at = 38.8 GeV.

A decrease in the per parton at high would lead to a better agreement of the E706 data with the CTEQ4HJ pdf predictions. There are several possible suppression mechanisms for soft gluon emission in this kinematic region that are not taken into account in the simple model discussed above. (An experimental determination of the dependence of the as a function of is difficult due to the diminishing statistics at higher .) This possibility is currently under investigation.
A comparison of the CTEQ4M and CTEQ4HJ gluon distributions and the gluon obtained by fitting the corrected E706 data (along with the CTEQ4 DIS and DY data sets) is shown in Figure 19. As might have been expected from Figure 17, the gluon distribution obtained from this fit agrees well with the CTEQ4M gluon distribution and lies below the CTEQ4HJ gluon distribution at high x. Also shown in the figure is the gluon distribution from the MRST pdf, which incorporates the -corrected data from WA70 in the fit. dddIn the MRST paper, the E706 data are not used directly in the fits, but the fit results are compared to the data from E706 after applying an appropriate correction. Good agreement is obtained. The larger correction for E706 observed in Figure 16 implies a smaller gluon distribution as is observed in Figure 19.

As has been discussed, there is a great deal of theoretical uncertainty in the calculation of the fixed target direct photon cross sections. Even if the Gaussian smearing ansatz given above were formally correct, the uncertainty in the value of to be used leads to a large variation in the predicted cross section. This variation makes the use of fixed target direct photon data in pdf fits somewhat problematic. A more complete resummation calculation should, with the appropriate experimental input, be able to predict the per parton for each kinematic condition and thus may be able to rescue the situation.
There has also been much recent interest in studying the effects of resumming large logarithms of the form . As approaches 1, for any hard scattering process, the perturbative cross section is enhanced by powers of that have to be resummed at all orders. These types of effects should currently be negligible for direct photon production at the Tevatron collider (because data are only available for relatively small values of ), but may be important at fixed target energies. The net effect for E706 is a significant increase in the cross section at high . A treatment that includes both and threshold resummation effects may be necessary for a more satisfactory description of the fixed target data. Recent theoretical progress has been made in this direction.
In the CTEQ4 pdf fits (and the upcoming CTEQ5 fits as well), the inclusive jet cross sections from CDF and D0 provide an additional constraint on the gluon distribution at moderate to large x values. Because of the theoretical uncertainties mentioned above, the CTEQ5 fits will not use fixed target direct photon data.
4 HERA
HERA is a positron-proton collider (27.5 GeV on 820 GeV protons) with a total center of mass energy of about 300 GeV. The large center-of-mass energy available at HERA offers a large phase space for the hadronic final state in DIS events, thus allowing clean jet structures to be observed. As HERA has continued its successful operation, the data available for analysis by both of its experiments, H1 and ZEUS, has increased steadily. Along with the increase in statistics has come an increase in the level of understanding of the detector systematics, allowing for more precise comparisons of data to perturbative QCD.

4.1 Parton Evolution Dynamics
Of particular interest at HERA are measurements which discriminate among parton evolution schemes. DGLAP and BFKL describe the evolution towards large values of and , respectively. DGLAP evolution resums terms of the form and involves a strong ordering in of the gluon emissions with the hardest emissions occurring near the top of the gluon ladder. (See Figure 20a.) In the BFKL model, terms of the form are resummed and gluon emissions are not ordered in transverse momentum . A solution of the parton evolution equation by CCFM approximates the BFKL equation in the low limit and the DGLAP equation in the high limit. A lack of ordering similar to that found in BFKL evolution has been incorporated in the color dipole model. In the color dipole model, gluon emission originates from a color dipole that is stretched between the scattered quark and proton remnant. The result is a cascade of independently radiating dipoles with the gluons not ordered in . (See Figure 20c.) In addition, for processes where the photon structure is resolved, the hardest emissions given in the QCD matrix element may occur anywhere in the ladder, with increasingly soft emissions along the ladder towards both the proton and the photon. (See Figure 20b.) The results presented previously for the Tevatron collider and fixed target measurements are all governed by DGLAP kinematics. At HERA, results have been obtained in all of the kinematic regimes discussed above.
A wide variety of leading order (in ) theoretical programs are available for comparison to the HERA data incorporating the above evolution schemes:
-
•
BFKL calculations at the parton level and with fragmentation functions
-
•
the DGLAP-based parton shower Monte Carlo model LEPTO
-
•
the CCFM-based Linked Dipole Chain model LDC
-
•
the color dipole Monte Carlo model ARIADNE (which assumes a chain of independently radiating dipoles spanned by color-connected partons
-
•
the resolved photon model RAPGAP
In addition, there are a number of DGLAP-based calculations in next-to-leading order of , including DISENT , MEPJET , DISASTER++ and JETVIP , that are available in the form of flexible Monte Carlo generators.
Comparisons between the data and the theory can be made either at the detector level (with an appropriate Monte Carlo simulation of the detector response), the hadron level (with corrections for acceptance and migration) or at the parton level (correcting for hadronization effects).
4.2 Dijet Cross Sections in DIS
In DIS (in the naive quark-parton model), the virtual photon is absorbed by a single quark or antiquark in the proton. This results in one jet from the struck quark(antiquark) and one jet from the proton remnant (1+1 configuration). To first order in (lowest order for dijet production), two jets (in addition to the proton remnant jet) with balanced transverse momentum are produced in the photon-proton center-of-mass(2+1 configuration). There are two subprocesses responsible for dijet production in DIS: boson-gluon fusion () and QCD Compton scattering (). At low and , the large gluon density leads to the dominance of the boson-gluon fusion subprocess and allows for a direct sensitivity for the gluon distribution in an region below the fixed target direct photon experiments. The presence of the strong interaction vertex may allow a measurement of . Jet measurements have been conducted with variations of both the iterative cone and algorithms, and in the lab, Breit and hadron center-of-mass reference frames.

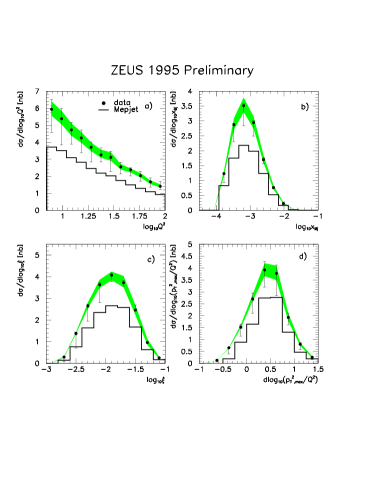
ZEUS has submitted to this conference a measurement of dijet production in DIS events from a data sample corresponding to an integrated luminosity of 6.4 . Cuts were placed on (7-100 ), y() and the scattered positron energy ( GeV). The jets were reconstructed with a cone algorithm (R=1) and were required to have a transverse energy greater than 4 GeV/c in both the laboratory and center-of-mass frames, and to have a pseudorapidity in the laboratory frame in the range from -2 to +2. The differential cross sections, corrected to the parton level, are shown in Figure 21. The corrections applied are typically 20-40%. The variable is of particular interest since it is related to the momentum fraction of the quark or gluon emitted from the proton in the leading order QCD picture.
As can be observed in Figure 21, the data span the range from , so the events are characterized by two scales, (square of jet transverse momentum) and . A comparison of an exact NLO QCD calculation (MEPJET) to the data demonstrates that the theory adequately describes the shape of all of the distributions but has a normalization off by approximately 34%. The difference is comparable in size and of the same sign as the hadronization correction applied to convert the data to the parton level.

The difference between theory and experiment observed by ZEUS might originate in the effects of soft gluon radiation in the regime (same minimum transverse momentum cut on both of the jets) where such effects may be important. It has been proposed to measure the dijet rate using asymmetric cuts on the transverse momenta of the two jets in order to minimize this type of correction to the NLO calculation. Placing an additional cut on the larger of the transverse momenta of the two jets decreases the magnitude of both the predicted and measured dijet cross sections, but the relative difference between the two still remains substantial. Similarly, increasing the cuts on the transverse momenta of the two jets results in both the measured and calculated cross sections decreasing, with the ratio of the two remaining approximately constant.
H1 has measured the dijet cross section in DIS events at HERA and from this measurement has extracted a determination of the gluon distribution in the range from .01 to 0.1. The analysis involves a large data sample (36 ) and utilizes jet algorithms for jet determination in the Breit frame. The Breit frame, where the virtual photon collides head-on with the scattered quark, is well-suited for studies of dijet production. In this frame, the jet transverse energy directly reflects the hardness of the underlying QCD process. Three different variations of the algorithm were utilized with the smallest hadronization corrections being present in the longitudinally invariant algorithm. The double-differential dijet cross sections (corrected to the hadron level) are shown in Figure 22 as a function of and and in Figure 23 as a function of and , compared to the NLO program DISENT. Good agreement is observed but the data have not been corrected for hadronization effects (which, however, are expected to be small).
Most of the data presented above by H1 are at higher than the previously discussed ZEUS measurement. There is some overlap, though, and the reason for the agreement by H1 with NLO theory and the disagreement by ZEUS is still under study. It may be related to the two studies being carried out in different frames of reference, with different jet algorithms and the jet corrections being to the hadron level for H1 compared to the parton level for ZEUS.
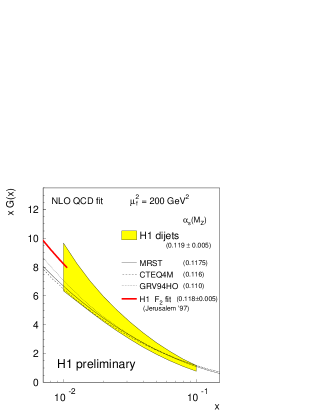
To determine the gluon distribution, the dijet cross section distributions and were utilized (in the range , where the NLO theory describes the data well) along with the H1 neutral current DIS data (to determine the quark densities in this x range). In the fit, the data are compared to the product of the NLO QCD prediction and the hadronization correction. The results of the gluon fit are shown in Figure 24 for the range 0.01 to 0.1 with a factorization scale () of 200 . The result is slightly higher than the gluon distributions obtained from several global analyses (although compatible within the error) and is in good agreement at = 0.01 with the gluon obtained from the QCD analysis of the H1 data.
H1 has also reported a determination of the strong coupling constant from the dijet sample. A modified JADE jet algorithm was applied to a sample of NC DIS events in the range from . The restriction of provides better acceptance for the final state jets and restricts the range of initial parton x to large values where the parton densities are better known.

The jet algorithm calculates the scaled quantities of pairs of calorimeter clusters (i,j), where is the total invariant mass of all clusters and is the mass of clusters i and j. The clusters with minimum are added together; this procedure is repeated until exactly (2+1) jets remain. The smallest scaled jet mass given by any combination of the (2+1) jets is defined to be the observable . A cut on () is imposed to increase the fraction of events with a clear (2+1) jet structure, thus enhancing the sensitivity to . The H1 distribution, normalized to the number of DIS events in the kinematic sample and corrected for detector and hadronization effects, is shown in Figure 25, along with the predictions of the NLO program MEPJET. Predictions are shown for = 100 MeV and 600 MeV, along with the best fit value of 320 MeV. This value of corresponds to a value of of . There is an additional theory systematic error of . This result is in agreement with the world average, albeit with a large error. The largest experimental systematic error is due to the model dependence of the detector and hadronization corrections; one of the largest sources of theory uncertainty is due to the imperfect knowledge of the pdf’s (and in particular the gluon distribution) in this kinematic range. (Gluon-initiated processes account for about 50% of the (2+1) jet events used in the analysis.) There is a strong correlation between the fit value of and the size of the gluon distribution as was observed in determinations of in jet production at the Tevatron.
4.3 Forward Jet Production at HERA
One of the significant discoveries made at HERA was the steep rise of the proton structure function in the region of small ( ). In the BFKL approach, the leading terms in which appear together with the terms in the evolution equation are resummed. The BFKL terms may lead to a steeper behavior, but from the existing data, it is not possible to unambiguously determine whether the BFKL mechanism plays a role in the HERA range. The BKFL mechanism predicts additional contributions to the hadronic final state from high transverse momentum partons travelling forward in the HERA frame. These forward-going partons may be detected experimentally as jets and may result in an enhancement of the forward jet cross section when compared to either exact NLO QCD calculations or parton shower model calculations based on DGLAP evolution. This is the same type of BFKL physics that was discussed earlier for large dijet rapidity separation at the Tevatron. In this case, the large rapidity separation is between the current and forward jets.
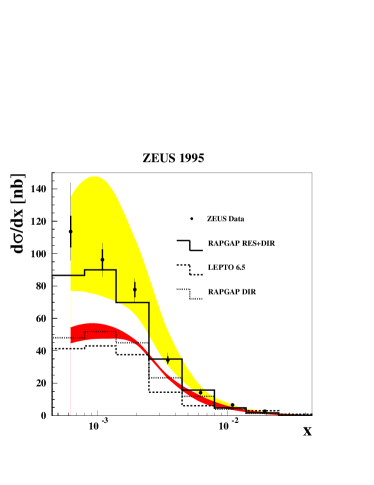
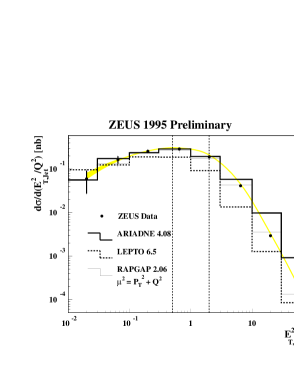
As previously, there are two hard scales relevant for low forward jet production: the squared momentum transfer of the photon, , and the squared transverse energy of the jet . The variable can be varied from very small values to very large values. A low value of corresponds to the standard DIS regime where DGLAP dynamics is dominant. In the range where is approximately 1, BFKL dynamics becomes important (and DGLAP parton evolution is suppressed) eeeSpecifically, BFKL dynamics is important in the forward jet region when is near one and . while in the regime where , the jet begins to probe the structure of the photon. The forward jet cross section from ZEUS (corrected to the hadron level) is shown in Figure 26. All three Monte Carlo programs shown describe the data well for . ARIADNE and RAPGAP work in the BFKL region () while only RAPGAP is successful in the regime where . The RAPGAP Monte Carlo model contains resolved as well as direct photon contributions. A resolved virtual photon contribution could account for the excess of forward jets with respect to the standard DGLAP models. In Figure 27, the hadron level forward cross section is plotted as a function of Bjorken . The agreement with RAPGAP (with both resolved and direct components) is excellent. However, the amount of resolved contribution to the forward jet cross section has a wide range of uncertainty that makes definitive conclusions difficult. The shaded band in Figure 27 indicates the variation in the RAPGAP prediction when the factorizaton scale is varied from to . Due to the large scale dependence, a comparison to exact NLO calculations is needed but the appropriate hadronization corrections are large.
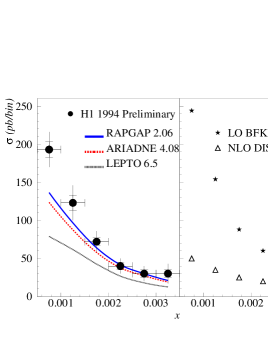
H1 has measured forward jet and dijet production requiring a transverse energy larger than 3.5 GeV/c in a cone of radius 1.0. A cut of is applied to enhance BFKL effects. The forward jet cross section is shown in Figure 28, as a function of compared to several models. ARIADNE and RAPGAP (with a resolved photon contribution) lie closer to the data than does the DGLAP-based program LEPTO. NLO parton calculations using DGLAP parton densities, as for example DISENT, disagree with the data both in shape and normalization. The numerical BFKL calculations at the parton level lie above the data but describe the shape fairly well.

The forward dijet cross section is measured by H1 to be , in agreement with the predictions from ARIADNE and RAPGAP. The dijet cross section is roughly 1% of the forward jet cross section. Recent BFKL predictions predict on the other hand that 3-6% of the forward jet data should contain 2 or more forward jets.
Single high particle production can also be used as a probe of QCD dynamics in the forward region. The ambiguity of jet definition implicit in the forward jet search is missing, and the smaller spatial extent allows the measurement to smaller angles. In Figure 29, the forward data from H1 is shown plotted vs for several values of (=). The observed rise with decreasing again provides evidence of more hard partonic radiation than predicted by DGLAP type Monte Carlo models (such as LEPTO), and is more reasonably represented by RAPGAP, where the photon acts as a resolved object.
4.4 Multijet Photoproduction at HERA
The study of multijet photoproduction provides a direct test of perturbative QCD predictions beyond leading order. Multijet kinematic observables have been previously studied for 3-6 jet production at Fermilab and for 2 jet production at HERA. ZEUS has now measured 3 jet final states in photoproduction events at HERA.
Photoproduction events were selected by restricting the transverse momentum to the positron to be less than 1 GeV and the photon-proton center-of-mass energy to be in the range from 134 to 269 GeV. Jets were defined using a cluster jet algorithm with the first two jets having a transverse energy greater than 6 GeV/c and the third a transverse energy greater than 5 GeV/c. The requirement of relatively high transverse energy for the jets ensures that the process can be calculated by perturbative QCD.

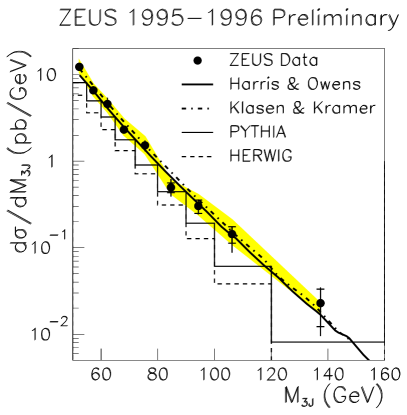
The three-jet invariant mass distribution is shown in Figure 30 and compared to the order calculations. The two calculations are leading order for the variable under study (since there are three jets in the final state) but still provide good agreement with the data. The Monte Carlo programs PYTHIA and HERWIG contain only 2 2 matrix elements but a third jet can be provided by gluon radiation. The Monte Carlo programs predict the correct shape for the cross section but have a normalization too low by 20-40%.
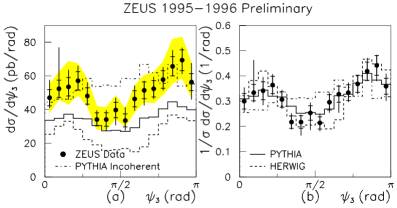
The distributions for (the angle between the highest energy jet and the beam direction) and (the angle between the plane containing the three jets and the plane containing the highest energy jet and the beam direction) are shown in Figure 31.
The distribution shows the expected Rutherford scattering form (). Both the and distributions differ dramatically from phase space and agree well with both the fixed order calculations and the Monte Carlo models.
The QCD phenomena of color coherence can be tested using the distribution. In Figure 32 is shown the data again, along with predictions of PYTHIA and HERWIG (both with color coherence implemented) and PYTHIA (with color coherence turned off). Color coherence disfavors gluon radiation into certain angular regions which are determined by the color flow of the primary scatter. PYTHIA with no color coherence predicts a much flatter distribution than observed in either the data or in HERWIG and (the color coherence version of) PYTHIA.

4.5 Jet Fragmentation at HERA
Fragmentation functions characterize the process of hadron formation in jet production and decay. A natural frame to examine the details of jet fragmentation in DIS events is the Breit frame, defined previously. The current region in the Breit frame is analagous to a single hemisphere in collisions and the fragmentation properties of these quarks can be directly compared to the fragmentation of the struck quark in the proton. The ep Breit frame equivalent of the scaled hadron momentum, , is , where only hadrons in the current hemisphere are considered. The fragmentation function from the ZEUS experiment, plotted as a function of Q for different intervals of , is shown in Figure 33. Approximate scaling is observed at moderate values of with clear scaling violations being apparent at both large (decrease with ) and small (increase with ). The HERA data overlap the kinematic range of the data and good agreement between both types of experiments is observed.

The small region is better investigated using the variable . The Modified Leading Logarithm Approximation (MLLA) together with Local Parton-Hadron Duality (LPHD) predict both the shape of the distribution () and the evolution of the peak and the width of the distribution with energy. The charged particle distributions are plotted as a function of in Figure 34 for various Q values, and the values of and are shown as a function of Q( for H1 ( experiments) in Figure 35. The observed peak and width of the distributions at HERA agree well with the data and with the MLLA predictions.

4.6 Jet Shapes
For cone jet algorithms, a useful representation of the internal structure of a jet is given by the jet shape. At sufficiently high energies, the jet shape should be calculable in perturbative QCD, with gluon jets broader than quark jets. At HERA, jet production has been observed in both neutral current (NC) and charged current (CC) DIS at high . As mentioned previously, in DIS, jet studies can be carried out in different frames. The appropriate frame for jet shape studies is still under discussion and the effects of boosting to different frames have not been fully investigated yet.
ZEUS has carried out a comparison of jet shapes in NC and CC interactions at , along with jets from and and collisions. Jets are measured with an iterative cone algorithm, in the laboratory frame of reference, with a radius R of 1 and an value of greater than 14 GeV. The jet shape was measured with the ZEUS calorimeter and corrected to the hadron level.
The integrated jet shape (the fraction of jet energy inside a cone of radius r compared to the total inside radius R) is shown in Figure 36 for NC events, resolved photoproduction events () and direct photoproduction events (). In direct photoproduction events, the photon acts as a point-like object while in resolved events the parton structure of the photon is probed. measures the fraction of the photon’s energy that goes into the two highest jets. The jets produced in NC DIS are narrower than those in dijet photoproduction, but closer to those dominated by direct processes. In NC DIS events, most of the final-state jets are quark jets (); direct photoproduction is dominated by the subprocess but has contributions from the subprocess . The resolved photoproduction events have a larger fraction still of final-state gluon jets as evidenced by the larger jet width.

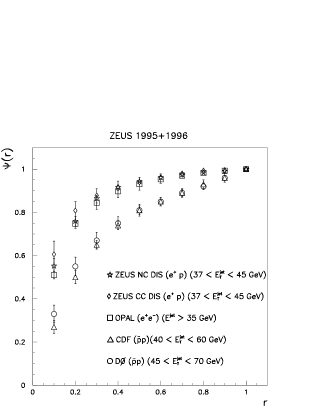
Jets from NC and CC DIS with and jet values in the range from 37-45 GeV are compared to jets of similar values from CDF , D0 and (from collisions) OPAL in Figure 37. For all three experiments, an iterative cone algorithm with a radius R of 1 is used. For the two collider experiments, an underlying event level corresponding to minimum bias events is subtracted. No such correction is needed for the events, or for the HERA DIS events (in the kinematic region being considered). The jets from the Tevatron Collider are significantly broader than the DIS jets from HERA and the jets from OPAL. This difference is primarily due to the larger fraction of gluon jets expected at the Tevatron with perhaps some small part of the difference being due to the extra contributions to the underlying event that may be present at the Tevatron.
H1 has carried out a measurement of the internal jet structure in an inclusive DIS dijet sample in the kinematic domain and . Jets were reconstructed in the Breit frame using both the iterative cone and jet algorithms, with the requirement that and . Jets become more collimated as increases, with the dependence becoming more pronounced for the cone algorithm. For constant , jets are narrower (broader) towards the photon (proton) hemisphere. These dependences become smaller as increases. A possible explanation for this behavior is that the internal jet structure is influenced by particles close to or produced by QCD radiation near the proton remnant.
Jets defined by the algorithm tend to be more collimated than those defined by the cone algorithm. The dependence on and is also stronger for the cone algorithm. Generally, the jet shapes are well described by QCD Monte Carlo predictions with LEPTO having a tendency to produce broader jets towards the proton remnant direction, HERWIG producing jets which are too narrow (especially at large and ), and ARIADNE lying between the two and giving a good overall description of the data.
5 Conclusions
DGLAP-based perturbative QCD calculations have been very successful in describing data involving jets and photons at both the Tevatron and at HERA. Most of the areas in which the remaining disagreements/controversies exist involve either an uncertainty in the gluon distribution (the high jet cross section at the Tevatron) or the influence of two scales in the measurement (fixed target direct photon production and forward jet production at HERA). For the case of forward jet production, BFKL effects may or may not be important; a proper treatment of photon structure seems to describe the data both the BFKL region and beyond. Recent calculations of the forward jet production cross sections based on the BFKL approach showed unusually large next-to-leading order corrections, raising the question on their predictive power. A deeper understanding of the origin of these large corrections is needed before a comparison to the data may be meaningful.
For fixed target direct photon production (particularly in the case of E706), soft gluon effects are extremely important, changing both the shape and normalization of the cross section with both the and Sudakov resummation formalisms being required. There has been a great deal of theoretical effort on this problem; a successful resolution will allow the quantitative treatment of direct photon data in pdf fits again, provide a window on an area of very interesting physics, and finally, settle the question of the large x gluon distribution.
Both CDF and D0 are undergoing major upgrades for Run 2, which is scheduled to begin in the spring of 2000. Each experiment will put in place a greatly improved detector and will accumulate (from 2000 to 2003) a data sample on the order of 2 , a factor of 20 increase over Run 1. A data sample this size will enable the high jet cross section to be probed in much more detail as well as allowing a variety of Tevatron QCD measurements to be performed with greater precision.
H1 and ZEUS will continue the analysis of the data taken with positrons in 1994-1997. HERA switched to electron running this year and plans to deliver approximately over the next two years. In 2000, the HERA machine will be upgraded for high luminosity running, with yearly rates of expected.
Acknowledgements
I would like to thank the organizers for a wonderful conference and a great excuse to vacation in the Pacific Northwest. I would also like to thank the National Science Foundation for funding and the following people for help in preparing this talk: L. Apanasevich, M. Begel, J. Blazey, C. Bromberg, T. Carli, S. Ellis, B. Flaugher, B. Hirosky, D. Krakauer, S. Kuhlmann, S. Linn, D. Lueke, A. Maul, S. McGill, D. Milstead, P. Nason, J. Repond, H. Schellman, D. Soper, G. Snow, G. Sterman, J. Terron, W.K. Tung, H. Weerts, M. Zielinski plus all of the participants in Parallel Session 3.
References
References
- [1] F. Abe et al. (CDF Collaboration), Phys. Rev. D 45, 1448 (1992); B. Abbott et al. (D0 Collaboration), Fermilab-Pub-97-242-E (1997).
- [2] F. Aversa, M. Greco, P. Chiappetta and J.P. Guillet, Z. Phys. C 46, 253 (1990).
- [3] W.T. Giele, E.W. Glover, D.A. Kosower, Nucl. Phys. B 403, 633 (1993).
- [4] S. Ellis, Z. Kunzst, D. Soper, Phys. Rev. Lett. 64, 2121 (1998); Z. Kunzst, D. Soper, Phys. Rev. D 46, 192 (1992).
- [5] R.K. Ellis, J.C. Sexton, Nucl. Phys. B 269, 445 (1996).
- [6] B. Abbott et al., Eur. Phys. J. C 5, 687 (1998).
- [7] J. Pumplin, Phys. Rev. D 57, 5787 (1998).
- [8] G. Marchesini and B.R. Webber, Phys. Rev. D 38, 3418 (1988).
- [9] S. Ellis, J. Huston and D. Soper, paper in preparation.
- [10] F. Abe et al., (CDF Collaboration), Phys. Rev. Lett. 77, 438 (1996).
- [11] J. Huston et al., Phys. Rev. Lett. 77, 444 (1996).
- [12] J. Huston et al., hep-ph/9801444, submitted to Phys. Rev. D.
- [13] P. Aurenche et al., Phys. Rev. D 39, 3275 (1989); A. Martin, W.J. Stirling, R. Roberts, Phys. Lett. B 304, 155 (1995).
- [14] H.L. Lai et al., Phys. Rev. D 55, 1280 (1997).
- [15] G. Blazey, in these proceedings.
- [16] D0, contributed paper 470, hep-ex/9807018, submitted to Phys. Rev. Lett.
- [17] U.K Yang, in these proceedings.
- [18] J. Lamoureux, in these proceedings.
- [19] D0, contributed paper 468, hep-ex/9807014, submitted to Phys. Rev. Lett.
- [20] L. Orr, in these proceedings.
- [21] L. Orr and W.J. Stirling, hep-ph/9806371.
- [22] F. Abe et al., (CDF Collaboration), Phys. Rev. Lett. 70, 1376 (1993).
- [23] F. Abe et al., (CDF Collaboration), Phys. Rev. Lett. 81, 1367 (1998).
- [24] B. Flaugher, in these proceedings.
- [25] W.T. Giele, E.W. Glover, D.A. Kosower, Nucl. Phys. B 403, 633 (1993).
- [26] F. Halzen and D. Scott, Phys. Rev. D 21, 1320 (1980).
- [27] J. Huston et al., Phys. Rev. D 51, 6139 (1995).
- [28] L. Apanasevich et al., (E706 Collaboration), Phys. Rev. Lett. 81, 2642 (1998).
- [29] The effect of on direct photon cross sections and the impact on the determination of the gluon distribution is discussed in more detail in L. Apanasevich et al., hep-ph/9808467, submitted to Phys. Rev. D.
- [30] S. Frixione et al., NPB 431, 453 (1994).
- [31] C. Balazs, C.-P. Yuan, Phys. Rev. D 56, 5558 (1997) and references therein.
- [32] J. Owens, Rev. Mod. Phys. 59, 465 (1987).
- [33] S. Linn, in these proceedings.
- [34] A. Martin, R. Roberts, W.J. Stirling, Eur. Phys. J. C, 4 (463)1998.
- [35] C. Bromberg, in these proceedings.
- [36] I would like to thank James Stirling and Dick Roberts for supplying the numbers for the MRST correction.
- [37] E. Laenen, G. Oderda, G. Sterman, hep-ph/9806467; S. Catani, M. Mangano, P. Nason, hep-ph/9806484.
- [38] M. Mangano, private communication.
- [39] H-n. Li, hep-ph/9811340
- [40] V.N. Gribov, L.N. Lipatov, Sov. J. Nucl. Phys. 15, 438 (1972); Y. Dokshitzer, Sov Phys. JETP 46, 641 (1977); G. Altarelli, G. Parisi, Nucl. Phys. B 126, 298 (1977).
- [41] E.A. Kuraev, L.N. Lipatov, V.S. Fadin, Sov. Phys. JETP 45, 1977 (199); Y.Y. Balitzki, L.N. Lipatov, Sov. J. Nucl. Phys. 28, 822 (1978).
- [42] M. Ciafaloni, Nucl. Phys. B 296, 49 (1988); S. Catani, F. Fiorani, G. Marchesini, Phys. Lett. B 234, 339 (1990); G. Marchesini, Nucl. Phys. B 445, 49 (1995).
- [43] J. Bartels et al., Phys. Lett. B 384, 300 (1996).
- [44] G. Ingelman, A. Edin and J. Rathsman, Comp. Phys. Comm. 101, 108 (1997).
- [45] W.J. Stirling, hep-ph/9804431; G. Salam, hep-ph/9805322, L. Lonnblad, hep-ph/9709424.
- [46] L. Lonnblad, Z. Phys. C 65, 285 (1995).
- [47] H.Jung,http://www-h1.desy.de/jung/rapgap/rapgap.html.
- [48] S. Catani and M.H. Seymour, Nucl. Phys. B 485, 291 (1997).
- [49] E. Mirkes and D. Zeppenfeld, Phys. Lett. B 380, 205 (1996).
- [50] D. Graudenz, hep-ph/9710244.
- [51] B. Potter, hep-ph/9806437.
- [52] M. Wobisch, in these proceedings.
- [53] J. Repond, in these proceedings.
- [54] ZEUS, contributed paper 806.
- [55] G. Kramer and B. Potter, hep-ph/9804352.
- [56] H1, contributed paper 520.
- [57] H1, contributed paper 528.
- [58] D. Milstead, in these proceedings.
- [59] ZEUS, contributed papers 804,804b.
- [60] H1, contributed paper 529.
- [61] J. Kwiecinski, C.A.M. Lewis, A.D. Martin,Phys. Rev. D 57, 496 (1998).
- [62] L. Sinclair, in these proceedings.
- [63] ZEUS, contributed paper 800.
- [64] B. W. Harris and J. F. Owens, Phys. Rev. D 56, 4007 (1997).
- [65] M. Klasen, T. Kleinwort and G. Kramer ZPC 1, 1 (1998).
- [66] F. Abe et al., (CDF Collaboration), Phys. Rev. D 56, 2532 (1997) and references therein.
- [67] M. Derrick et al., (ZEUS Collaboration),Phys. Lett. B 384, 401 (1996).
- [68] D. Luke, in these proceedings.
- [69] ZEUS, contributed paper 809.
- [70] Y.L. Dokshitzer, V.A. Khoze, A.H. Mueller, S.I Troyan, “Basics of Perturbative QCD”, Editions Frontieres (1991).
- [71] H1, contributed paper 531.
- [72] H1, contributed paper 532.
- [73] ZEUS collaboration, hep-ex/9804101.
- [74] F. Abe et al., (CDF Collaboration), Phys. Rev. Lett. 70, 713 (1993).
- [75] S. Abachi et al., (D0 Collaboration), Phys. Lett. B 357, 500 (1995).
- [76] G. Alexander et al., (OPAL Collaboration), Phys. Lett. B 384, 353 (1996).
- [77] V.S. Fadin, L.N. Lipatov, Phys. Lett. B 429, 127 (1998).