R. Delbourgo, Dongsheng Liu and
M.D. Scadron
School of Physics and Mathematics, University of Tasmania
GPO Box 252-21, Hobart, Tasmania, Australia 7001
Permanent address:
Physics Department, University of Arizona, Tucson, Az. 85721 USA.
Abstract
We prove that recent data demonstrates unequivocally that the scalar meson
is mostly composed of quarks and that the coupling
of to photons and mesons is in agreement with expectations from the
linear sigma model.
PACS: 13.20.Gd, 13.25.+m, 14.40.Cs
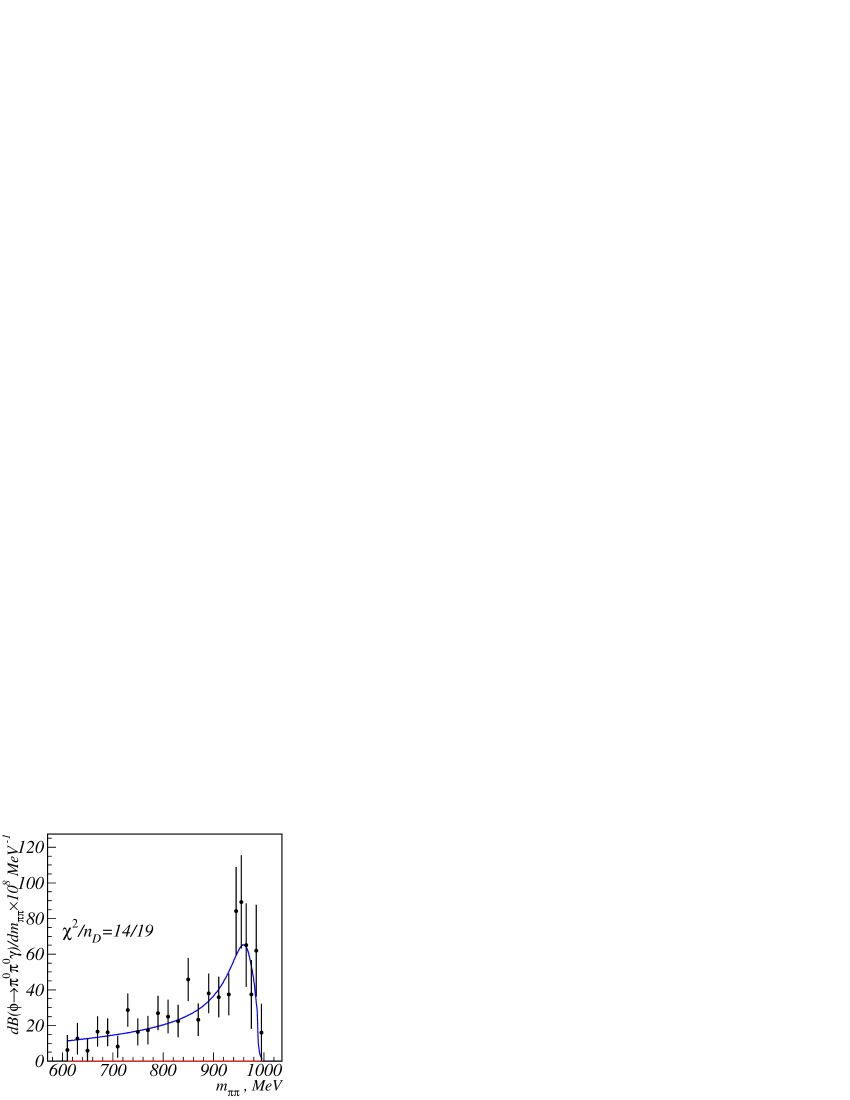
The observation[1] of the decay mode was reported very recently for the first time. The
experiment clearly shows that the process is dominated by the
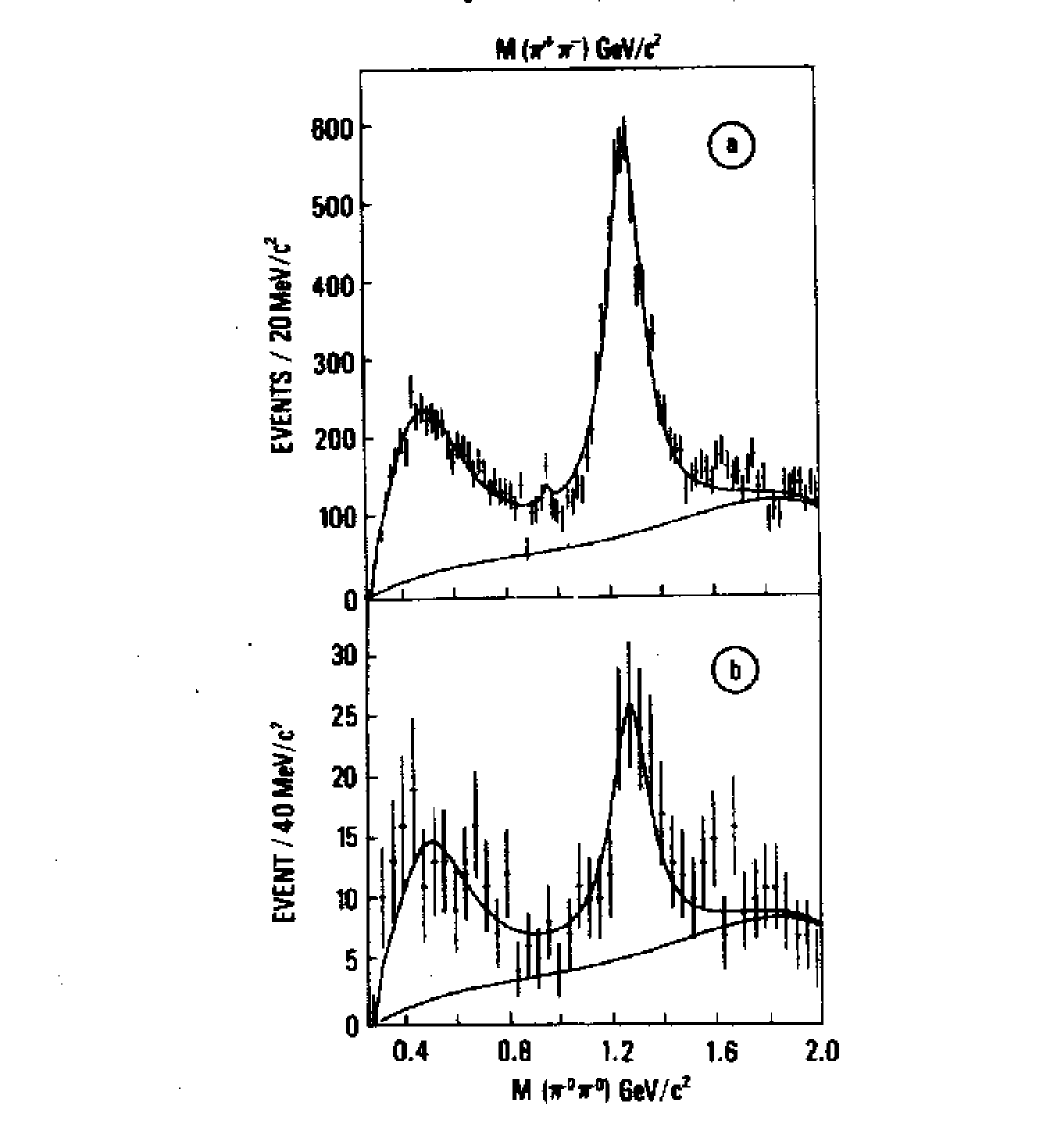
channel. This may be contrasted with the decay process , which was measured a decade ago[2] and where it was
found that the channel was highly suppressed but that the
and channels predominated.
In this letter we wish to give an interpretation of these results and show
that the scalar meson is mostly composed of strange quarks.
First we recall that, according to quark models, the vector meson
is 97% nonstrange (viz. NS=)
and 3% strange (S=). Conversely, the other vector meson
has the opposite composition: 3% NS and 97% S.
We will show that the above two experiments[1, 2]
strongly suggest that the is largely S.
Independently and for different reasons the phenomenological study of
low-energy scattering[3] and the phase shift analysis[4]
of scattering have led to the same conclusion about the
composition of .
The effective coupling constants, extracted from ref. [1], are based upon
an inferred total decay width of 188+48-33 MeV:
(1)
(2)
These values roughly follow from a dynamically generated theory of the
SU(3) linear sigma model (LM) Lagrangian[5] where a scalar
meson nonet pattern is demanded: . A related description[6] is that the scalar mesons are
composed of 4 quarks (), which is the description adopted
by ref. [1].
In order to bring the observed[7] isoscalar mesons and
into the LM picture, we must first consider the NS-S
mixing basis,
(3)
in a manner similar to mixing[8]. For the orthogonal
mixed states , we find[5] from (3),
(4)
Inserting the dynamically generated NJL-type masses[5],
(5)
along with MeV, one gets
(6)
Such a value for the scalar mixing angle was proposed several years
ago[8] and it is worth noting that the proximity in mass between
and has its counterpart in the vector mesons
with and . Thus one should not be surprised
that the meson (with ) is principally an
state.
In order to link up to the recently extracted interactions (1) and (2), we
first state the predicted LM Lagrangian couplings[5] (for
brevity we refer to either the or final states
as or ),
(7)
where we have substituted the experimental values MeV,
. From these and the mixing angle
we may compute the effective[9] LM couplings,
(8)
(9)
Although these predictions (8) and (9) seem shy of (1) and (2) by
64% and 84% respectively, we have not yet considered other data.
Specifically, the detailed Particle Data Group (PDG) Tables[7]
quote the average decay rate to be 0.560.11
keV. In combination with the branching
ratio[7] of , one may derive a
total width of MeV. Given the
branching ratio, one may deduce the PDG effective coupling[9],
(10)
( is unknown, because of the negligible phase space.)
This said, we note that our theoretical values (8) and (9) lie between
the Novosibirsk and PDG values. See Table 1. Regardless
of the final phenomenological resolution of the discrepancy, we must
emphasize that the important result is the contrast between the
measured invariant mass spectra of refs. [1] and [2].
New Data
LM Theory
Particle Data Group
1.6
4.3
-
Table 1: Comparison of effective couplings (in GeV) of to the
pseudoscalar mesons.
For the reader’s convenience, we display the observed invariant
mass spectrum in in Figure 1; our quark model
interpretation is given alongside, in Figure 2. The observed mass
spectra for are displayed in Figure 3 to
show the stark difference from Figure 1; again we provide the quark model
interpretation alongside, in Figure 4. The resonance bumps in
and in along with the near absence of an bump in
and of in is telling us that is mostly NS while
is mainly S. This is in consonance with the linear sigma model and a
scalar mixing angle of .
However, to stress that this small mixing angle of is not the central
issue, we close this letter by considering decays which proceed via a quark loop. We may compare this radiative
channel with , which is accurately estimated by
a nonstrange quark triangle; the latter provides the effective amplitude
GeV-1 and agrees with the data
to within 2% for MeV.
If were purely nonstrange too, the (isoscalar)
effective amplitude would be given by
(11)
predicting a decay rate
(12)
On the other hand, if were a pure scalar, its effective
amplitude would be
(13)
for a constituent mass MeV and a strange
coupling[5] of . The
decay rate would then be
(14)
From (12) we see that the pure decay
rate is about 15 times larger than the PDG[7] average
rate of 0.56 keV, while the pure rate (14)
is within striking range of the experimental value. The comparison can be
improved by including the small mixing angle . But in any case the
quark triangle description of radiative meson decays reinforces the fact
that is mostly rather than a ()
scalar meson.
Acknowledgements.
This research was partially supported by the Australian Research Council.
M.D.S. appreciates the hospitality of the University of Tasmania where
this work was carried out.
References
[1] V.M. Aulchenko et al, Budker Institute, Novosibirsk,
hep-ex/9807016, 17/07/1998.
[2] J. Augustin et al, DM2 Collaboration, Nucl. Phys.
B320 (1989) 1.
[3] N.A. Tornqvist and M. Roos, Phys. Rev. Lett. 76 (1996)
1575.
[4] S. Ishida, M. Ishida, T. Ishida, K. Takamatsu and T. Tsuru,
Prog. Theor. Phys. 98 (1997) 621; M. Ishida and S. Ishida,
hep-ph/9712231.
[5] R. Delbourgo and M.D. Scadron, Int. J. Mod. Phys.
A13 (1998) 657. Also see M. Levy, Nuovo Cim. A52 (1967) 23;
S. Gasiorowicz and D. Geffen, Rev. Mod. Phys. 41 (1969) 531.
[7] Particle Data Group, C. Caso et al, Eur. Phys. J.
C3 (1998) 1.
[8] H.F. Jones and M.D. Scadron, Nucl. Phys. B155 (1979)
409; M.D. Scadron, Phys. Rev. D29 (1984) 2079; A. Bramon and
M.D. Scadron, Phys. Lett. B234 (1990) 346; see also N. Isgur,
Phys. Rev. D12 (1975) 3770.
[9] Effective couplings are defined via and
they yield GeV for
MeV. We need to double the
Lagrangian couplings by a factor of two to compare them with .
Figure Captions
Fig. 1. The measured invariant spectrum in
. Reprinted from hep-ex/9807016
by kind persmission from Budker Institute.
Fig. 2. Theoretical interpretation of , as due to three gluon exchange.
Fig. 3. Fit of the distribution in , as obtained by the DM2 group, by
kind permission from Dr A Calcaterra.
Reprinted from Nucl. Phys. B320, 1, Copyright (1989),
with permission from Elsevier Science.