IMSc/98/11/53
13th Nov 1998
Hints of higher twist effects in the slope of the proton structure function
Rahul Basu111E-mail: rahul@imsc.ernet.in and D. Indumathi222E-mail: indu@imsc.ernet.in; On leave from Mehta Research Institute, Allahabad 211 019,
The Institute of Mathematical Sciences, CIT Campus, Madras 600 113.
Abstract: We critically analyse the data available on the reduced cross-section in deeply inelastic scattering from the H1 collaboration at HERA. We use available data on the longitudinal structure function to deduce the nature of at different for fixed values of near . We present the results in a manner which effectively isolates possible higher twist effects in the structure function .
PACS Nos: 12.38.-t, 13.60.Hb
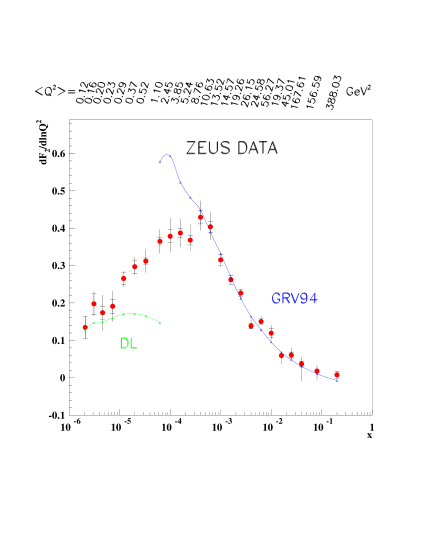
Deeply inelastic scattering (DIS) at the collider at HERA has provided precision data on the proton structure functions over the last few years. Data on the slope of the structure function, , was presented for the first time last year [1, 2]. This showed a surprising dip in the slope, , below (see Fig. 1), although itself continued to show a rise towards smaller down to the kinematical limit. Such a dip was not anticipated or predicted by available parametrisations at that time [3]. There have since been intensive discussions on this effect using leading twist as well as higher twist contributions within a perturbative framework. In fact, there now exist new parametrisations [4, 5], which attempt to incorporate this effect, albeit in a leading twist analysis. The case for higher twist effects is not yet overwhelming [6] although they occur naturally in an operator product approach to DIS [7]. In this context, it is relevant to ask whether there exist other data or methods which, when combined with existing data on , can clearly indicate the presence of higher twist terms, which have long been poorly understood in DIS. This letter addresses this issue. In particular, we show that the slope of the reduced DIS cross-section, , defined in eq. (1) below, is very sensitive to the slope of . Along with available data on the longitudinal structure function, , we show that the slope of yields information on the nature of the higher twist content of and hence that of .
Recently, the H1 collaboration [8] at HERA has measured the reduced cross-section, ,
which is a clear indicator of the size of the longitudinal structure function, , compared to that of , in the measured deep inelastic cross-section. Here is determined by with , where is the square of the total cm energy (which is constant at HERA) and the two kinematical variables, and , are as usual the momentum transfer and Bjorken scaling variable respectively.
The quantity has been independently measured as a function of both and . Hence, the slope of with respect to either or , with the other variable kept fixed, can be determined. Furthermore, since lies between 0 and 1, it is clear that contributes significantly to only at fairly large values of . For example, even when , the quantity multiplying in is only . Finally, exactly, at leading order, due to the Callan-Gross relation and is non-zero only at next-to-leading order. Hence, is suppressed (by at least one power of ) compared to . As a consequence, at low , is essentially determined by ; conversely, any study of must therefore be made in the large region for maximum sensitivity.
The data on is averaged over , with the average increasing with increasing in such a way that all the data corresponds essentially to low 0.3; hence, it is relevant to ask whether the behaviour shown in Fig. 1 persists at all . In short, what is the dependence of at fixed values ?
We analyse the H1 [8] data with a view to extracting such a dependence. In order to do this, we shall separately analyse the small and large data. To begin with, we recognise that the dependences of and are related. This is because, from eq. (1), we have
Here the factors and are significant only for large . In particular, when ; furthermore, over the entire range. It is observed that is a fairly linear function of at all as can be seen from Fig. 2, where has been plotted as a function of for some selected values ranging from to . Hence the slope can be obtained (at these different values) from straight line fits to the data.
The small data
: The –derivative of (whether at constant or at constant ) is insensitive to or its slope when is small. In other words, the behaviour of at low values (and hence low for a given value) directly constrains the slope of . The resulting slopes, , are shown in comparison with those extracted differently by ZEUS [1] in Fig. 3. Note that in our calculation we have obtained the slope at fixed , equal to the average of the corresponding ZEUS data for different values of . All the points have 0.3; in fact the large () data have 0.15. The error bars in our extraction of the slope are due only to the errors arising from the straight–line fit to the data while the ZEUS data include both statistical and systematic errors. We see that there is good agreement between the two data sets, leading us to conclude that , so that in eq. (2) in indeed saturated by at small . The specific values of the slope, for certain and values have been shown in Table 1 labelled as “small ” data; we shall need this later on in our analysis.
| Small data | |||
| () | |||
| 1.4 | 3.85 | 0.305 | |
| 2.4 | 5.24 | 0.242 | |
| 4.0 | 8.76 | 0.243 | |
| 6.2 | 10.63 | 0.190 | |
| Large data | |||
| () | |||
| 1.4 | 8.84 | ||
| 2.4 | 15.2 | ||
| 4.0 | 25.3 | ||
| 6.2 | 34.7 | ||
The large data
: In the large region, the contribution can no longer be neglected. We therefore use the value of determined by the H1 collaboration [9] at various values, for fixed (corresponding to large ) to analyse the large data. Hence the large analysis will be restricted to . Since has contributions only at NLO, its slope () is rather small; this term is further suppressed by ( at ). Hence, we neglect the contribution of the slope of in what follows. We shall comment on the validity of this approximation later on. Then in eq. (2), along with the data on , yields a value for at large within this approximation. Sparse data is available for in the region ; hence we can extract only at these values. These values (which we refer to as “large ” data) at different , but at the same values as the “small ” data, are shown in Table 1. The “large ” sample obviously corresponds to a larger than the “small ” data at a given ; however, note that the average in the sample we have analysed increases with . The large error bars (much larger than that of the small data) are essentially due to large errors in the data.
We have therefore extracted as a function333The number of values is restricted by data. There exists more data on from H1 [10] that has been extracted using data on . This data is consistent with the existing ones in the region of overlap, but we shall not use them here since the data are at slightly different values. of in the range – . These values are listed in Table 1. At each value, we have obtained at two different values corresponding to small and large data as discussed above. Note that in all cases GeV2, which corresponds to a fairly stable perturbative regime.
We use the NLO GRV (1994) [11], GRV (1998) [4] and MRS (1998) [5] parametrisations as typical indicators of the theoretical expectation based on purely twist–two perturbative DGLAP [12] evolution equations. These predict a primarily logarithmic dependence of on (along with a small piece from the heavy quark contributions). This implies that the slope, , at fixed is essentially flat, with a small (positive) slope due to the charm quark contribution.
In Fig. 4 we show the extracted large and small data samples as a function of along with the NLO fits from the different parametrisation sets at the same values as the data. Since increases with , the upper points correspond to the large (and hence larger ) sample (See Table 1). The bigger error bars on these points are due to the larger uncertainties in . The errors on the small sample arise from the errors on our fits to the slope of and are much smaller. (The error bars on the data are very small except at the edges of the kinematically accessible regions; we have included them in the fits to the slopes but not in the error estimates of the slope). We have also plotted the values for (averaged over ) obtained by ZEUS [1] at the same values, at the same average as the small data, for comparison.
We see that all parametrisations are consistent (to within 1) with the large data. In the case of the small data, which also corresponds to the smaller sample, the requirements are more stringent due to the smaller error bars. The 1998 fits are in general a better fit than the 1994 one. However, it is clear that if the error bars decrease due to more and better data being made available, while the values remain near the current central ones, a pure change in normalisation will not suffice to fit both the data sets. This is because the central values of the two data sets differ by more than 100%, while the parametrisations differ by less than 50%. It therefore appears that the small (or equivalently, small ) data are suppressed relatively more than the large data. In particular, the separation between the data at the smallest value () clearly indicates a substantial evolution of from to GeV2 (See Table 1). Such a behaviour can be attributed to higher twist effects. To elaborate further, can be expressed in terms of a leading twist and higher twist part, as
where the coefficients are in general functions of and we have included only an additional twist–4 piece. This results in a dependence of of the form
That evaluated from the parametrisations at a given decreases with is due to threshold effects from terms like occurring in the charm contribution. Any further suppression of with decreasing then arises due to higher twist effects coming from the light quark sector and can explain the trend of the data shown in Fig. 4. Such an effect will be particularly visible for smaller data, such as that corresponding to the smallest value in Fig. 4: this results in the small data being suppressed more than the large data. This explains the observed agreement of the large data with existing twist–2 parametrisations while the small data at the same value disagree by as much as . This disagreement disappears with increasing for both large and small data since also increases with . It is rather surprising that higher twist effects are visible at such seemingly large . However, it must be remembered that this is the first time that the slope of has been so precisely measured. It thus appears that the dependence of the slope, , can provide a more sensitive test of the dependence of and hence of the elusive higher twist effects in deep inelastic scattering.
Finally, we address the issue of the slope of the longitudinal structure function, , in eq. (2), which has been neglected in this analysis. We estimate the size of this contribution using the GRV (1994) parametrisation. We find that this quantity does not exceed 0.1 for any of the values of interest here. Furthermore, its contribution at small is suppressed because of ; for the small sample, so that this contribution never exceeds a percent. For the large sample, is larger, ; however, the slope of at these values is small enough so that the term contributes less than about 5%, which is small compared to the size of the error bars of this data set. Hence it is reasonable and consistent to ignore the contribution from this term.
In conclusion, we have analysed a limited sample of the HERA H1 data [8] on the reduced cross-section, , along with available data on the longitudinal structure function, , [9], in order to study the dependence of in a perturbative regime. A comparison with available twist–2 NLO parametrisations shows indications of large dependences in the data for —larger than that indicated by purely twist–2 behaviour. This is especially true for small values (), which also correspond to a smaller GeV2), indicating that substantial higher twist effects may be operative here. While the effect is clearly marked only in the first data point, and the data analysed is obviously limited, the trend of the data is tantalisingly similar to that expected from higher twist effects. We therefore urge a detailed analysis of the data at various values in order to shed more light on the role of higher twists in . More data (and improved errors on ) will be needed to refine this observation.
References
- [1] ZEUS Collab., ZEUS 1995 preliminary data, Abstract 770, Proceedings of the XXIX ICHEP ’98 Conference, Vancouver, Canada, 1998; A.T. Doyle, preprint hep-ex/9808022; J. Breitweg et al., preprint hep-ex/9809005, to appear in the European J. Phys. C.
- [2] H1 Collab., H1 1995 preliminary data; see A. Caldwell, invited talk at the DESY theory workshop, October 1997 and DIS98, Brussels, April 1998; A.D. Martin, R.G. Roberts, W.J. Stirling, R.S. Thorne, talk presented at DIS98, Brussels, April 1998, hep-ph/9805205.
- [3] See, for example, A.D. Martin, R.G. Roberts, W.J. Stirling, Phys. Lett. B387 (1996) 419; and [11] below.
- [4] GRV (1998), M. Glück, E. Reya and A. Vogt, Eur. Phys. J. C5 (1998) 461.
- [5] MRS (1998), A.D.. Martin, R.G. Roberts and W.J. Stirling, Eur. Phys. J. C4 (1998) 463.
- [6] E. Gotsman, E. Levin, U. Maor, and E. Naftali, preprint hep-ph/9808257; A.D. Martin, M.G. Roberts, A.M. Stasto, preprint hep-ph/9806212.
- [7] See, for example, T. Muta, Foundations in Quantum Chromodynamics, World Scientific Lecture Notes in Physics, 5, 1987.
- [8] H1 Collab., H1 1997 preliminary data, Abstract 534, to appear in the Proceedings of the XXIX ICHEP ’98 Conference, Vancouver, Canada, 1998.
- [9] H1 Collab., H1 1994 data, Phys. Lett. B393 (1994) 452.
- [10] H1 Collab., H1 1997 preliminary data on ; see reference [8] above.
- [11] GRV (1994), M. Glück, E. Reya and A. Vogt, Z. Phys C67 (1994) 433.
- [12] V.N. Gribov and L.N. Lipatov, Sov. J. Nucl. Phys. 15, 438 (1972); Yu.L. Dokshitzer, Sov. Phys. JETP 46, 641 (1977); G. Altarelli and G. Parisi, Nucl. Phys. B126, 298 (1977).