Search for Exotic Muon Decays***supported by the
BMBF (06 TU 886), DFG (Mu 705/3, Graduiertenkolleg) and the UK
Engineering and Physical Sciences Research Council.
R. Bilger1, K. Föhl2, H. Clement1, M. Cröni1, A. Erhardt1, R. Meier1, J. Pätzold1, and G.J. Wagner1
1Physikalisches Institut der Universität Tübingen, Auf der
Morgenstelle 14, D-72076 Tübingen, Germany
2Department of Physics and Astronomy, University of Edinburgh,
James Clerk Maxwell Building, The King’s Buildings, Mayfield Road,
Edinburgh, EH9 3JZ, United Kingdom
Abstract: Recently, it has been proposed that the observed anomaly in the time distribution of neutrino induced reactions, reported by the KARMEN collaboration, can be interpreted as a signal from an exotic muon decay branch . It has been shown that this hypothesis gives an acceptable fit to the KARMEN data if the boson has a mass of , close to the kinematical limit. We have performed a search for the particle by studying for the first time the very low energy part of the Michel spectrum in decays. Using a HPGe detector setup at the beamline at PSI we find branching ratios (90% C.L.) for most of the region .
PACS: 13.35.Bv
Keywords: rare decay of muon, non-standard-model boson
Corresponding author:
Ralph Bilger
Tel: +49 7071 2976304, Fax:+49 7071 295373
e-mail: ralph.bilger@uni-tuebingen.de
1 Introduction
At the Rutherford Appleton Laboratory (RAL) the KARMEN collaboration is studying neutrino-nuclear reactions, induced from the decay products of positive pions, which are produced and stopped in the proton beam dump. In 1995 KARMEN for the first time reported [1] an anomaly in the time distribution of single prong events concerning the time interval corresponding to muon decay. Even with a much improved active detector shielding the anomaly has persisted in new KARMEN data [2].
This anomaly has been suggested to originate from the observation of a hitherto unknown weakly interacting neutral and massive fermion, called , from a rare pion decay process . After a mean flight path of is registered in the KARMEN calorimeter after beam on target by its decay resulting in visible energies of typically . The observed velocity and the two-body kinematics of the assumed pion decay branch lead to a mass , extremely close to the kinematical limit.
The hypothetical decay has been searched for at PSI in a series of experiments using magnetic spectrometers by studying muons from pion decay in flight [3, 4, 5], the latest measurement resulting in an upper limit for the branching ratio of (95% C.L.) [5]. Combined with theoretical constraints which assume no new weak interaction [6] this result rules out the existence of this rare pion decay branch if is an isodoublet neutrino. However, if is mainly isosinglet (sterile), the branching ratio can be considerably lower [7]. From the number of observed events in comparison with the total number of decays the KARMEN collaboration gives a lower limit for the branching ratio of .
Very recently Gninenko and Krasnikov have proposed [8] that the observed time anomaly can also be explained by an exotic decay branch resulting in the production of a new, weakly interacting neutral boson with mass . They show that a second exponential in the KARMEN time distribution with time constant equal to the muon lifetime and shifted by the flight time of the -particle gives an acceptable fit to the KARMEN data. Considering three possible -boson phenomenologies, they predict branching ratios for in the order of , if is a scalar particle; , if decays via a hypothetical virtual charged lepton; and , if decays via two additional hypothetical neutral scalar bosons.
In this paper we present a direct experimental search for the particle by studying the low energy part of the Michel spectrum looking for a peak from mono-energetic positrons with energy resulting from the two-body decay .
In the past, searches for exotic two-body decay modes have already been performed [9] motivated by predictions about the existence of light, weakly interacting bosons like axions, majorons, Higgs particles, familons and Goldstone bosons resulting in upper limits for the branching ratio of approximatley (90% C.L.). However, these searches are not sensitive to the suggested boson with since the lowest positron energy region studied was between 1.6 and 6.8 MeV, corresponding to the mass region 103.5 to .
2 The Experiment
The basic idea is to stop a beam inside a germanium detector. The low energy decay positrons of interest also deposit their entire kinetic energy in the detector volume. For a sizeable fraction of events the subsequent annihilation radiation does not interact with the detector thus preserving the positron energy information.
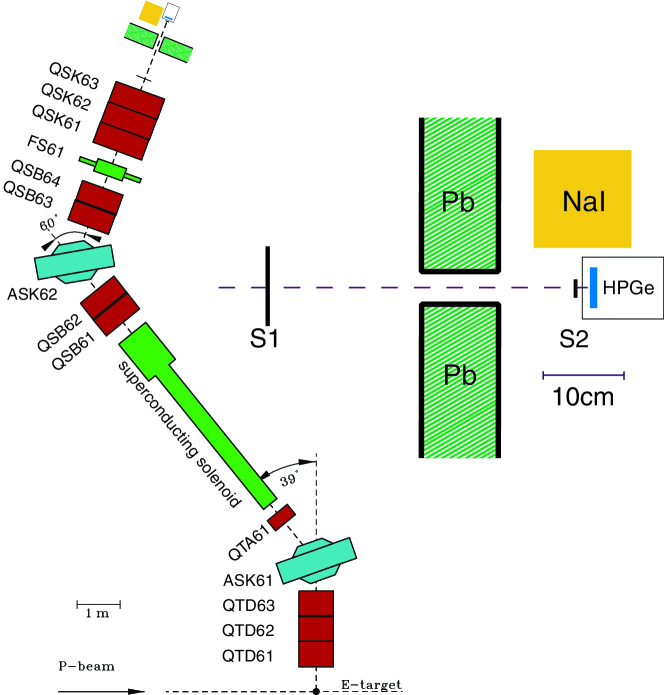
This experiment has been performed at the channel at PSI (see Fig. 1). The beam line is optimized for intense polarized muon beams in the momentum range between 30 and 100 MeV/c with very low pion and positron contamination. Pions from the production target are collected at an angle of relative to the primary proton beam and are injected into a long 5 T superconducting solenoid in which they can decay. The last part of the beam line is the muon extraction section which allows the selection of a central muon momentum different from that of the injected pions.
The detector setup consists of a large () 2 mm thick plastic scintillator counter S1 followed by a 35 mm diameter hole in a 10 cm thick lead shielding wall and a small () 1 mm thick plastic scintillator counter S2 directly in front of a 9 mm thick planar high purity germanium (HPGe) detector with an area of . In addition, we have placed a 127 mm (5 inch) diameter, 127 mm thick NaI detector shielded against the -flux adjacent to the HPGe for detecting 511 keV rays from positron annihilation.
The coincidence was used as a trigger which generated — in addition to a prompt gate — a delayed gate after the prompt muon signal for the expected decay events. During the time period for the delayed gate, S1 was used as a veto detector to discriminate against further beam particles. Timing and energy information from the dectetors utilizing several different methods for signal discrimination, amplification, shaping and digitization were recorded for both prompt and delayed signals using the MIDAS data acquisition system [10].
For the energy calibration of signals occuring during the prompt gate, rays from and sources were used. In order to derive the energy information from the HPGe detector signal, both spectroscopy amplifiers and peak-sensitive ADCs as well as a timing filter amplifier (TFA) connected to a charge sensitive QDC were employed. In addition, sample signals from the HPGe detector, both before and after amplification, were recorded and stored with a digital oscilloscope. It turned out that every spectroscopy amplifier available during the course of the experiment showed a significantly varying baseline shift for a few microseconds following a prompt signal. The variations of the baseline level just after the prompt signal were due to fluctuations in time for the onset of the baseline restoration circuitry. Thus, for spectroscopy amplifiers, a sufficiently accurate energy calibration for the delayed signal was not possible.
The TFA branch did not have such baseline problems, however the energy resolution for the delayed signal in this branch is 100 keV FWHM only. A short shaping time of s and low amplification to avoid saturation from the high-amplitude prompt signal had to be used to be ready in time for the delayed pulse.
During 12 hours of data taking events were recorded on tape. Saturation of the HPGe pre-amplifier at a singles rate of was limiting the event rate.
3 Results
The energy deposition of the stopped muons in the HPGe detector is (see Fig. 2). The cut on the energy of the prompt signal is MeV. The delayed signal has to occur within the time interval of after the prompt signal. The time distribution (see Fig. 2) nicely shows the expected exponential shape with . For shorter times the tail of the prompt signal still causes a varying effective discriminator threshold thus the TDC spectrum deviates from an exponential shape. The information from the NaI detector is used to check the consistency of the analysis, but is not used for the determination of the branching ratio.


After energy and time cuts events remain. Accounting for high energy positrons from muon decay causing a signal in the veto counter S1, a 3% correction results in good muon decays for normalization.
GEANT [11] based Monte Carlo studies have provided an understanding of the shape of the delayed signal energy spectrum (see inset in Fig. 3). The two peaks are due to an asymmetric stop distribution with respect to the symmetry plane perpendicular to the beam axis of the cylindrical HPGe detector resulting in different energy distributions for Michel positrons emitted in the backward and forward hemispheres of the detector, respectively.
The interaction of the annihilation rays with the detector has also been studied. For positrons in the considered energy range the double escape probability is 40-44% (no 511 keV rays interacting in the HPGe), the single escape probability being a factor 4 lower. The search for events as described below concentrates on double escape events.
Assuming a smooth and gently varying background as confirmed by the Monte Carlo studies, the search for a peak structure in the delayed signal energy spectrum (see Fig. 3) has been done for energies from to MeV. The lower energy limit is given by the effective discriminator threshold, the upper energy limit from the positron zero transmission range in germanium. Since the beam muons are stopped after (2) in the HPGe detector, and since the 2.2 MeV electrons have a zero transmission range of 2 mm, this is the highest energy for which all positrons remain within the detector volume thus completely depositing their kinetic energy.

For all positron energies between 0.3 and 2.2 MeV a typically 1.2 MeV wide energy interval is chosen and a polynomial fitted to this part of the spectrum. For a polynomial of low order the fit has an unrealistically high . Increasing the order of the polynomial the resulting first decreases and then remains roughly constant with values around one.
A polynomial of order seven was chosen as the lowest order to have a suitable reduced (second graph in Fig. 3). Then a simultaneous fit of a Gaussian (position and width fixed) and a polynomial provides the area and error for a possible peak. In the third graph of Fig. 3 these results have already been converted in branching ratio (BR) units. With a Bayesian approach [12] one can derive from these results an upper limit with a given confidence level. Shown on the bottom of Fig. 3 is the 90% C.L. upper limit.
For the positron energy corresponding to an particle with mass as suggested by Gninenko and Krasnikov [8] the 90% C.L. upper limit for the branching ratio in the decay is .
4 Summary and Outlook
Following the proposition that a new, weakly interacting boson with mass produced in might be the reason for the observed anomaly in the KARMEN data, we have searched for this two-body decay branch by inspection of the low energy end of the Michel spectrum. Utilizing a clean beam from the channel at PSI and stopping the muons in a planar HPGe detector this work is the first direct search for such an exotic decay process for boson masses corresponding to positron energies . Our first results give branching ratios (90% C.L.) over most of the accessible region, such excluding the simplest scenario for the boson phenomenology suggested in Ref. [8]. By refining the experimental method used in this experiment it will be feasible to improve on this result.
We gratefully acknowledge valuable support from and discussions with D. Branford, M. Daum, T. Davinson, F. Foroughi, C. Petitjean, D. Renker, U. Rohrer, and A.C. Shotter. We also would like to thank the Paul Scherrer Institut for assistance in setting up this experiment in a very short time.
References
- [1] B. Armbruster et al., Phys. Lett. B 348, 19 (1995).
- [2] B. Zeitnitz, Talk given at NEUTRINO’98, available via WWW from http://www-sk.icrru-tokyo.ac.jp/nu98/scan (1998).
- [3] R. Bilger et al., Phys. Lett. B 363, 41 (1995).
- [4] M. Daum et al., Phys. Lett. B 361, 179 (1995).
- [5] M. Daum et al., PSI Nuclear and Particle Physics Newsletter 1997, 15 (1998)
- [6] V. Barger, R. Phillips, and S. Sarkar, Phys. Lett. B 352, 365 (1995).
- [7] V. Barger, R. Phillips, and S. Sarkar, Phys. Lett. B 356, 617 (1995).
- [8] S. N. Gninenko and N. V. Krasnikov, Phys. Lett. B 434, 163 (1998).
- [9] D. A. Bryman and E. T. H. Clifford, Phys. Rev. Lett. 57, 2787 (1986).
- [10] S. Ritt and P. Amaudruz, MIDAS User’s and Programmer’s Manual, available via WWW from http://pibeta.psi.ch/midas (1998)
- [11] GEANT, CERN Program Library, (1998).
- [12] R. M. Barnett et al., Phys. Rev. D 54, 165 (1996).