17 March, 1998
Evidence for – and -dependent damping
of the omeron flux in the proton
Samim Erhan and Peter E. Schlein
University of California∗, Los Angeles, California 90095, USA.
We show that a triple-Regge parametrization of inclusive single diffraction agrees with the data in the following two domains: (a) at all , (b) GeV2 at all . Since the triple-Regge parametrization fails when applied to the full – range of the total single-diffractive cross section, we conclude that damping occurs only at low– and low–. We give a (“toy”) parametrization of the damping factor, D(), valid at low-, which describes the data at the ISR and roughly accounts for the observed –dependence of up to Tevatron energies. However, an effective damping factor calculated for the CDF fitted function for at GeV and GeV2, suggests that, at fixed-, damping increases as increases.
We conjecture that, in the regions where the triple-Regge formalism describes the data and there is no evidence of damping, factorization is valid and the omeron-flux-factor may be universal. With the assumption that the observed damping is due to multi-omeron exchange, our results imply that the recent UA8 demonstration that the effective omeron trajectory flattens for GeV2 is evidence for the onset of the perturbative 2-gluon pomeron. Our damping results may also shed some light on the self-consistency of recent measurements of hard-diffractive jet production cross sections in the UA8, CDF and ZEUS experiments.
submitted to Physics Letters B
∗ Supported by U.S. National Science Foundation Grant PHY94–23142
1 Introduction
The inclusive (inelastic) production of beam–like particles, known as single diffraction, as in:
| (1) |
and its analogous and ep interactions, presents one of the most interesting phenomena in strong interaction physics. An observed “rapidity gap” (absence of particles in a range of rapidity) between and in the final state signifies that the entire (color singlet) residual momentum of the proton, with beam momentum fraction, , participates in the interaction between it and the second beam particle. This effect is described in terms of the exchange of the omeron Regge trajectory[1], which embodies the idea of “factorization”. The momentum transfer, , and the beam momentum fraction, , of the final state proton, , “tag” the corresponding parameters of the exchanged omeron.
Since is observed to be the most likely beam momentum fraction of the final–state , correspondingly the most likely value of the omeron’s momentum fraction in the proton, , is near zero. Nonetheless, at current collider energies the squared–invariant–mass of the system in Eq. 1, to good approximation, can be quite large. This fact led to a proposal[2] to study hard scattering in such interactions, as a means of determining if the omeron possesses an observable partonic structure. The observation of the predicted hard scattering[3, 4, 5] supported the notion that the omeron behaves like a quasi–real object inside the proton with an effective omeron flux factor. An open question is to what extent such a flux factor is universal; for example, is it independent of beam particle or center-of-mass energy, or are there regions of phase space where factorization breaks down, due to interference with other more complex phenomena (e.g. multiple-omeron-exchange) ?
One of the long–standing theoretical problems in high energy hadronic interactions has been the understanding of –channel unitarization in omeron–exchange (diffractive) interactions. Empirically, one finds that the total diffractive cross section, , in Reaction 1 and in the corresponding interaction, initially rises from threshold and tends to level off or “flatten” at high energy[6], whereas the dominant triple–omeron[7] description of these processes (see below) continues to rise and soon exceeds the total cross section. There is no built–in mechanism in the pure triple–omeron process to account for the observed flattening of , and hence avoid the violation of unitarity.
Figure 1 displays the problem [8–17]. The -dependence of the total cross section for React. 1, is shown111It is conventional to quote for , because the experimental acceptance usually depends weakly on in this region and because the integrated background from non-omeron exchange and other sources in this region is small enough to be neglected. for Feynman– (or ) of the final state proton or antiproton (the domain where omeron–exchange is dominant). rises sharply from its threshold at 11.3 GeV beam momentum and gently levels off to 9 mb at the highest Fermilab energy. The solid curve in Fig. 1 is the triple-Regge prediction discussed below. At high energies, it is in complete disagreement with the measured cross section.
In the continuing theoretical efforts to satisfy –channel unitarity [18–22], the words, screening, shadowing, absorption and damping are all used[23] to describe effects due to multiple omeron exchange (two-omeron-exchange is also an important component in understanding elastic scattering[24] at low-). These calculations have had varying degrees of success. Goulianos has taken a more pragmatic approach[6] to satisfying unitarity and suggested that the integral of the omeron flux factor in a proton should saturate at unity above GeV.
In the present Letter, we find that damping is confined to the low–, low– region. We continue the analysis of the UA8 Collaboration[25] and demonstrate that there are regions either at larger or at larger , where the available data are well described by the triple-Regge formula and therefore require no damping.
It is thus clear that the damping function depends on both and . We attempt to determine the –dependence at low– of an “effective” multiplicative damping factor which could account for the discrepancies between data and solid curve in Fig. 1. However, we call it a “toy damping factor” for several reasons. First, there are large gaps in the available data in Fig. 1 and some inconsistencies, therefore making it impossible to find a unique function. Secondly, the processes which give rise to the observed damping may imply a breakdown of factorization, in which case a simple universal damping factor may not exist at low– and low–. Finally, there is some evidence that the nature of the –dependence may itself depend on at our highest energies.
2 Triple–Regge phenomenology
We briefly summarize the relevant formula. The Mueller–Regge expansion[7] for the differential cross section of React. 1 is:
| (2) |
where is the Regge trajectory for Reggeon . The sum is taken over all possible exchanged Reggeons. The are products of the various Reggeon–proton and triple–Reggeon couplings and the signature factors.
There are two dominant terms in Eq. 2 at small , namely and , where the first term corresponds to the triple–omeron process, and the second corresponds to other non–leading, C=+ trajectories (e.g., ) in the omeron–proton interaction, The term increases with increasing , whereas the term decreases with increasing .
Because the omeron is the highest–lying trajectory, when , is negative and the differential cross section increases sharply as . This corresponds to the empirical observation that the most likely momentum fraction of the omeron in the proton, , is near zero. Thus, the sharp rise in the triple–Regge prediction of in Fig. 1 is due to the kinematic fact that the minimum value of decreases with increasing as
For fitting to data, Eq. 2 has been rewritten[25] as:
| (3) |
where,
-
•
the left–hand bracket is taken as the omeron flux factor, , and the right–hand bracket (together with the constant, ) is the omeron–proton total cross section, .
- •
-
•
The products and are, respectively, the values of and at = 0.
-
•
The omeron trajectory, , has been shown[25] to become relatively flat for GeV2 (see next section); therefore a quadratic term is added to the standard linear trajectory[24], = 1.10 + 0.25 t + . The non–zero value of in compensates for the presence of the quadratic component in the omeron trajectory333If, as Donnachie and Landshoff[27] have suggested, depends on momentum transfer, that dependence would also be absorbed into the factor..
-
•
is the standard Donnachie–Landshoff[24] form–factor.444 Since it has never been shown to describe React. 1 at large , the factor also serves as a possible correction. Thus, the product, , carries the –dependence of the in Eq. 2 and is assumed to be the same for both and . Physically, this means that the omeron has the same flux factor in the proton, independent of whether the omeron–proton interaction proceeds via omeron–exchange or Reggeon–exchange.
3 Where is triple–Regge applicable ?
We already know from the information in Fig. 1 that the dominant contribution to the total cross section, namely the data with small– and small–, are not described by the triple–Regge formalism; a damping of the omeron flux with increasing is certainly required in this region. However, we see no reason to suppose that the same damping must apply to the entire – domain555omeron–exchange dominates out to and contributes significantly to , as proposed by Goulianos[6]. However, this issue can be resolved by using available data to determine if there are regions in the – plane where the formalism does apply; that is, where damping is not required.
The UA8 collaboration has recently reported[25] a (successful) simultaneous fit of Eq. 3 to their data on React. 1 at GeV and the extensive data sample of the CHLM collaboration at the CERN–ISR with = 23.5 and 30.5 GeV. They use the values, = 0.10 and -0.32, obtained for the omeron and trajectories, respectively, in fits to real–particle total cross sections[26, 28, 29].
The four free parameters, , , are determined by fitting Eq. 3, plus an empirical background function of the form, , to the combined ISR–UA8 data set in the range666For , there are no concerns about experimental resolution causing “spill–over” from the large peak at ., –0.10. The fitted parameters are:
| = | mb GeV-2 | ||
| = | GeV-4 | ||
| = | GeV-2 | ||
| = |
This value of was independently confirmed[25] in fits to the –dependence in the peak region with .
These triple–Regge results can be used to predict the total cross section of React. 1, , be integrating Eq. 3 over the entire –range, as well as for . This yields the solid curve in Fig. 1 and illustrates the discrepancy[6] with the experimental .
Fig. 2 from Ref. [25] shows the ISR[30] and UA8 data[25] data in the restricted region, , where the small (15%) non–omeron–exchange background can be ignored (the background is smaller than the size of the dots in the figure and about the same magnitude as the systematic uncertainty in absolute cross sections). The similarity of at at both ISR and SS energies reflects the fact that has nearly the same value at both = 5 and 118 GeV.777This arises because, at fixed and in Eq. 3, is proportional to . The term, , in Eq. 3 makes this possible. The solid curves in Fig. 2 are fits to these data without a background term and yield values of the 4 parameters which are in excellent agreement888The same four parameters from this fit are , , and , respectively. with those given above from the fit, thus lending credence to the relibility and stability of the fits.
We have found a second region in the – plane, at small– but large–, where the triple–Regge formalism also describes the ISR and UA8 data — with no additional free parameters. Fig. 3 shows the high momentum–transfer part of for and the limited –range, 1.0–2.0 GeV2, plotted vs. for the ISR and UA8 data. The solid curve is the prediction of Eq. 3 using the above parameters. The dashed curve is obtained by decreasing the –parameter by 1 from its central value. We see that, in contrast with the situation for , the triple–Regge formula, Eq. 3, accounts for the observed –dependence of the total single diffractive cross section in the high– range, 1.0–2.0 GeV2. The different shapes of the curves in Figs. 1 and the solid curve in Fig. 3 are due to the –dependence of the omeron trajectory.
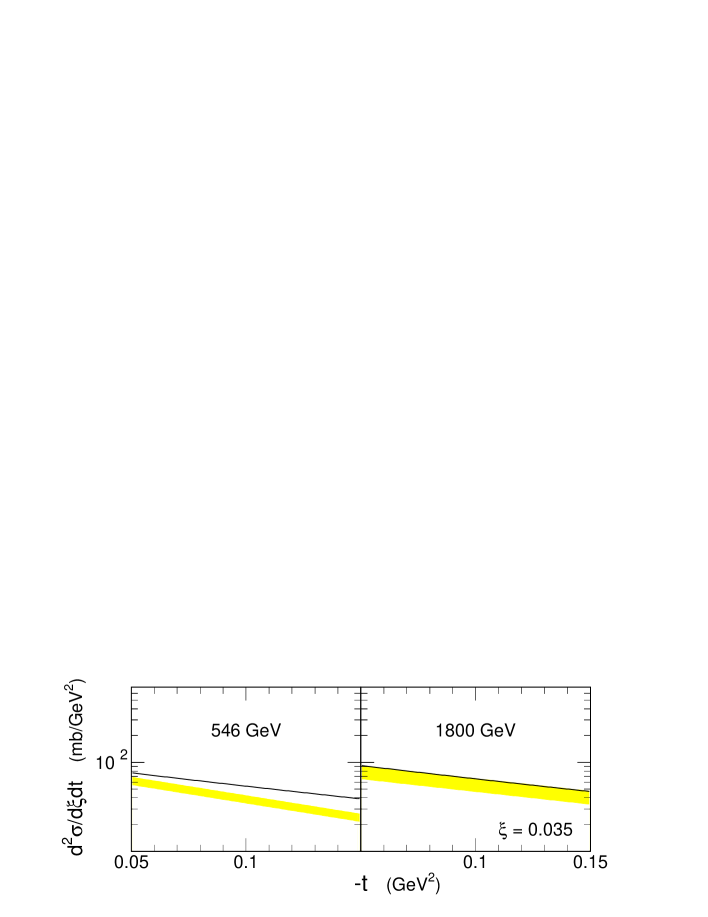
We have thus demonstrated that damping depends on both and ; it only exists in the small–, small– region, and is not required by data away from that region — either at larger or at larger . This could explain why CDF[17] reports abnormally large backgrounds in triple–omeron fits to their (low–, low–) data at = 1800 GeV. For example, at (and = 0.05 GeV2) where normally 15–20% background is found, their fitted formula corresponds to non–omeron–exchange backgrounds of 51%. Such a result can be expected if a –dependent Damping factor is required, but is left out of the fit; the fitted (large) background term compensates for the wrong –dependence in the triple-Regge equation without damping. Since CDF only reports the fitted functions, we compare our prediction of with the sum of their “signal” and “background” terms. This sum corresponds to the solid bands in Fig. 4; the curves are the vs. predictions of Eq. 3 at . We see that, at 1800 GeV, the prediction agrees to within of the CDF result; at 546 GeV, there is also good agreement at the lowest –value, although their fitted -dependences at the two energies are not self-consistent.
4 Empirical determination of damping at small (,)
The –dependence of the disagreement between triple–Regge and the measured cross section is best seen by comparing the predictions with the experimental values of plotted vs. . This is done in Figs. 5 for eight ISR energies999Some of these data were obtained with unequal energies for the two beams and in Fig. 6 at the SS–Collider101010The UA4 points come from two independent runs, one at high– and one at low– which allowed them to span most of the available –range..
The dashed and dotted curves in Figs. 5 and 6 are the (undamped) triple–Regge predictions for , calculated by integrating Eq. 3 over the range, (for the dotted curve, is decreased by 1 from its central value).
At the ISR energies, where the triple–Regge prediction only exceeds the data by about 10–15% (see Fig. 1), the differences between dashed curves and data in Fig. 5 are hardly noticable, because the dot sizes are roughly similar to the discrepancies. At GeV, however, the same effect is larger and highly visible. At that energy, we see that there is a gradual transition from the low– region which dominates , and where the experimental is smaller than the (undamped) triple–Regge prediction, to the higher– region where the predictions agree with the data. This seems to be a smooth transition over the –range, 0.5–1.0 GeV2. The situation at the lower ISR energies in Figs. 5 is similar but less pronounced. We conclude that the discrepancies between predictions and data are confined to the low– region.
Since, as noted above, the calculated rise in with increasing is due to the fact that, kinematically, decreases with increasing , it seems natural to introduce an empirical damping factor, , in Eq. 3 which suppresses small –values; i.e., we strike at the “heart” of the problem. D() will be unity everywhere except at small–.
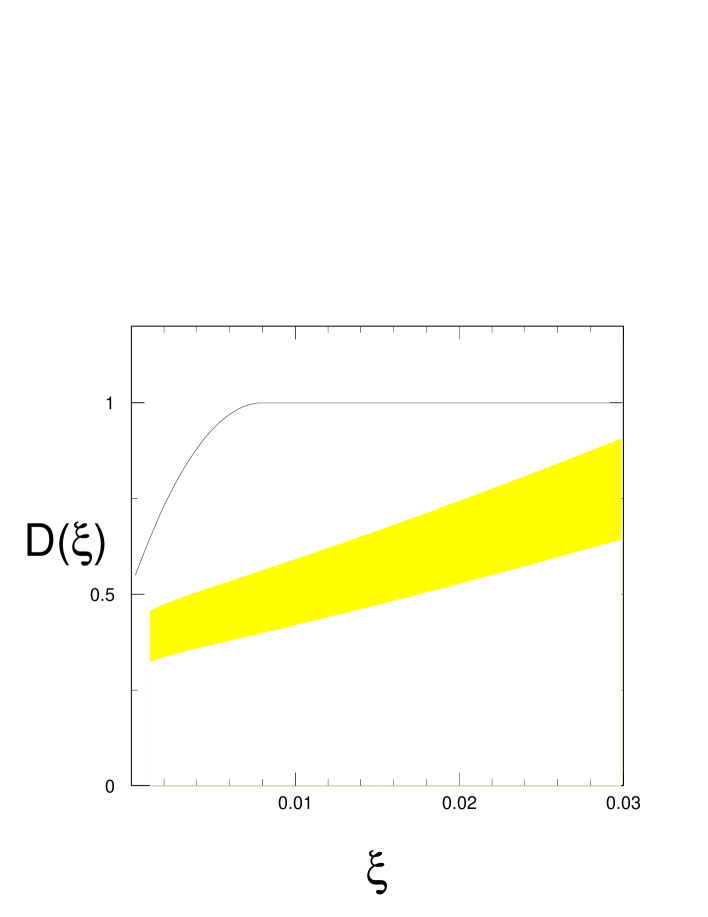
For , we have tried a “toy” damping function which decreases from unity for , following a quadratic function as shown in Fig. 7. The parameters of the quadratic function are choosen to reproduce the leveling–off of at ISR energies in Fig. 1. To account for the Tevatron and SS points, an additional (steep) fall–off is needed for . We arbitrarily use a cubic form111111. has a total of 3 free parameters, since the quadratic and cubic have identical slopes and magnitudes at . These were chosen to be the parameters of the quadratic function and the slope of the cubic function at .. The dashed curves on Fig. 1 shows how such a function accounts reasonably well121212The bump between the ISR and SS energies is due to the interplay between the 2–component and the damping function at . for at high energies.
The solid curves in Figs. 5 and 6 are calculated from Eq. 3 multiplied by the above damping factor. As expected from Fig. 1, the effect of damping is very small at ISR energies, but increases with . At the energy of the SS, however, the damping is about a factor of 3 in the low region, which dominates . There is good agreement with the damping predictions at low– in both Figs. 5 and 6.
While, as explained above, the parameters of the quadratic term are chosen to agree with the departure of the ISR cross sections from the triple-Regge prediction in Fig. 1, there seems to be no reason a-priori why this formulation should be valid at higher energies. To clarify this point, we assume that the formula CDF fitted[17] to their data is a sufficient description of and compare its -dependence at = 0.05 GeV2 with that of Eq. 3. The band in Fig. 7 shows the ratio of the CDF at 1800 GeV to the triple-Regge prescription, which can be interpreted as an empirical damping factor. This decreases from near unity at to about 0.5 at , but is insufficient to account for the factor of 5 required by the 1800 GeV cross section in Fig. 1; therefore an additional (rapid) decrease in the damping factor must occur at smaller , analogous to our toy damping factor discussed above.
The CDF function thus indicates that, at larger , the onset of damping occurs at increasingly larger –values. However, this does not invalidate the solid (damped) curve calculated with the above and shown in Fig. 6, because the overall damping calculation is not sensitive to the details of in the larger -region.
5 Conclusions
We first summarize the key points of this Letter:
-
•
We have a triple-Regge parametrization of inclusive single diffraction which agrees with the data in two domains of the – plane: (a) at all , (b) GeV2 at all (Figs. 2, 3 and 4). Since the triple-Regge parametrization fails when applied to the full – range of the total single diffractive cross section ( and all ), we can conclude that damping occurs only at low– and low–.
- •
-
•
An effective damping factor calculated for the CDF fitted function for at GeV and GeV2, suggests that, at fixed-, damping increases as increases (Fig. 7).
These results raise a number of issues: We can conjecture that, in the regions where the triple-Regge formalism describes the data and there is no evidence of damping, factorization is valid and the omeron-flux-factor may be universal. A systematic program of testing universality of the flux factor in these regions should be carried out in , and interactions.
Our damping results may shed some light on the measurements of the quantity from the cross sections for diffractive jet production in React. 1 and its analogue reaction (K is the normalization constant in Eq. 3 and measures violation of the momentum sum rule, when ). Assuming that the omeron has dominant gluonic structure[31], there are three measurements of :
The fact that the UA8 data is at large- where there is no damping, whereas the CDF data is at small- where the damping factor in the region of the jets is of order 0.50, could account for the difference between the UA8 and CDF values.
In addition, despite the large errors, it is interesting that the UA8 and ZEUS values for are consistent. This might be expected, if there is no damping in collisions at high-. Of course, at low-, where the photon exhibits hadronic properties, multi-omeron exchange, and hence damping, may result in smaller values of .
In order to further study the possible -dependence of the effective damping factor, it would be very useful to make detailed measurements of single diffraction in pp interactions at RHIC energies. This would fill in the large gap getween ISR and SS–collider energies seen in Fig. 1.
We note that UA8[25] offers as possible explanations of their observed flattening of the omeron trajectory for GeV2, either that it is an effect of multiple-omeron exchange, or that it is evidence for the onset of the perturbative 2-gluon pomeron[34, 35]. In view of our observation that damping is not required in this -region, it seems that the perturbative omeron, explanation is more likely. It may therefore be interesting to study the –omeron cross section from up through the GeV2 region.
Acknowledgements
We thank A. Kaidalov, P. Landshoff and E. Gotsman for helpful comments.
References
-
[1]
For reviews, see e.g.:
A.B. Kaidalov, Phys. Reports 50 (1979) 157;
G. Alberi and G. Goggi, Phys. Reports 74 (1981) 1;
K. Goulianos, Phys. Reports 101 (1983) 169. - [2] G. Ingelman and P.E. Schlein, Phys. Lett. B 152 (1985) 256.
- [3] R. Bonino et al. (UA8 Collaboration), Phys. Lett. B 211 (1988) 239.
- [4] A. Brandt et al. (UA8 Collaboration), Phys. Lett. B 297 (1992) 417.
- [5] A. Brandt et al. (UA8 Collaboration), Phys. Lett. B 421 (1998) 395.
- [6] K. Goulianos, Phys. Lett. B358 (1995) 379; B363 (1995) 268.
-
[7]
A.H. Mueller, Phys. Rev. D2 (1970) 2963; D4 (1971) 150;
A.B. Kaidalov et al., Pisma JETP 17 (1973) 626;
A. Capella, Phys. Rev. D8 (1973) 2047;
R.D. Field and G.C. Fox, Nucl. Phys. B80 (1974) 367;
D.P. Roy and R.G. Roberts, Nucl. Phys. B77 (1974) 240. - [8] V. Blobel et al., Nucl. Phys. B92 (1975) 221.
- [9] H. Bialkowska et al., Nucl. Phys. B110 (1976) 300.
- [10] J.W. Chapman et al., Phys. Rev. Lett. 32 (1974) 257; the cross section at 405 GeV is multiplied by a factor 0.82 to estimate the value for .
- [11] S.J. Barish et al., Phys. Rev D9 (1974) 2689; Phys. Rev. Lett. 31 (1973) 1080.
- [12] F.T. Dao et al., Phys. Lett. B45 (1973) 399.
- [13] M.G. Albrow et al., Nucl. Phys. B108 (1976) 1.
- [14] J.C.M. Armitage et al., Nucl. Phys. B194 (1982) 365.
- [15] M. Bozzo et al. (UA4 Collaboration), Phys. Lett. B136 (1984) 217.
- [16] D. Bernard et al. (UA4 Collaboration), Phys. Lett. B186 (1987) 227.
- [17] F. Abe et al. (CDF Collaboration), Phys. Rev. D50 (1994) 5535.
- [18] A. Capella, J. Kaplan and J. Tran Thanh Van, Nucl. Phys. B 105 (1976) 333.
- [19] A.B. Kaidalov, L.A. Ponomarev and K.A. Ter–Martirosyan, Sov. J. Nucl. Phys. 44 (1986) 468.
- [20] P. Aurenche et al., Phys. Rev. D 45 (1992) 92.
- [21] E. Gotsman, E.M. Levin and U. Maor, Zeit. Phys. C 57 (1993) 667; Phys. Rev. D 49 (1994) R4321; Phys. Lett B 353 (1995) 526.
- [22] A. Capella, A. Kaidalov, C. Merino and J. Tran Thanh Van, Phys. Lett. B 337 (1994) 358.
- [23] A. Kaidalov, private communication (1998).
- [24] A. Donnachie & P.V. Landshoff, Nucl. Phys. B231 (1984) 189; Nucl. Phys. B267 (1986) 690.
- [25] A. Brandt et al. (UA8 Collaboration), Nucl. Phys. B 514 (1998) 3.
- [26] A. Donnachie & P.V. Landshoff, Phys. Lett. B296 (1992) 227.
- [27] A. Donnachie & P.V. Landshoff, Nucl. Phys. B244 (1984) 322.
-
[28]
J.R. Cudell, K. Kyungsik and K.K. Sung, Phys. Lett. B395 (1997) 311;
J.R. Cudell, K. Kang and S.K. Kim, “Simple Model for Total Cross Sections”, preprint, Brown–HET–1060, January 1997. - [29] R.J.M. Covolan, J. Montanha & K. Goulianos, Phys. Lett. B389 (1996) 176.
-
[30]
M.G. Albrow et al., Nucl. Phys. B54 (1973) 6;
M.G. Albrow et al., Nucl. Phys. B72 (1974) 376. - [31] C. Adloff et al. (H1 Collaboration), Z. Phys. C76 (1997) 613.
- [32] F. Abe et al. (CDF Collaboration), Phys. Rev. Lett. 79 (1997) 2636.
- [33] M. Derrick et al. (ZEUS Collaboration), Phys. Lett. 356 (1995) 129.
- [34] L. Frankfurt and M. Strikman, Phys. Rev. Lett. 63, (1989) 1914; 64 (1990) 815.
- [35] J.C. Collins, L. Frankfurt and M. Strikman, Phys. Lett. B307 (1993) 161.