Modification of parton distributions in nuclei
Abstract
Nuclear parton distributions are studied in a parton model with rescaling and recombination mechanisms. Parton distributions are first calculated at =1 GeV2 by the model, and they are evolved to larger in order to be compared with various data. The experimental shadowing is explained by the parton-recombination effects. Then, the modification of sea-quark and gluon distributions is investigated. We show and dependent results of the ratios and . They indicate significant shadowing at small and large ratios in the medium- region. Our theoretical results should be tested by future experiments, for example, at RHIC (Relativistic Heavy Ion Collider). Furthermore, our studies are important for finding a signature of the quark-gluon plasma in heavy-ion reactions. We also indicate that nuclear effects in the deuteron should be taken into account for finding the accurate structure function of the neutron.
pacs:
24.85.+p, 25.30.-c, 13.60.HbI Introduction
Although unpolarized parton distributions in the nucleon are now known in detail from very small to relatively large , the distributions in nuclei are not investigated to such a great extent [2]. It was usually assumed in the 1970’s that the nuclear structure functions were simply given by the one for the nucleon multiplied by the mass number for isoscalar nuclei: . Nuclear binding energies are very small compared with energy scales in deep inelastic scattering, so that they were expected to be insignificant in discussing the structure functions. It is, therefore, rather startling to find significant modification of the nuclear at medium in the European Muon Collaboration (EMC) data [3] in 1983. The nuclear modification is now named the (“old”) EMC effect after the experimental collaboration name.
In the middle of 1980’s, theoretical models were proposed for explaining the nuclear modification in the medium- region. The first idea after the EMC finding is a rescaling model [4] in 1983. The original motivation for the rescaling model was to consider that the nucleon size is modified in the nuclear medium. Because the structure function reflects lightcone momentum distributions of nuclear partons, the size change results in the modification of . Although such modification may exist, the rescaling model is no more interpreted in the original form. It is better to be considered as an effective model [5], which could be consistent with the following binding model. A conservative idea in terms of nuclear binding was, on the other hand, proposed in 1985 [6]. The nuclear is given by the nucleon’s convoluted with a spectral function, which indicates momentum distributions of the nucleons in the nucleus. Due to the binding energy , the distribution of is shifted a few percent (). Although the magnitude itself is not large, the shift becomes 1020 % effects in the at medium . Because the model is successful in explaining a significant portion of the experimental data, the binding model is now accepted as the most probable interpretation of the EMC effect at medium . The model can also explain the large- region, where the ratio increases as , in terms of the nucleon Fermi motion. We discuss the compatibility of the rescaling model with the binding model in section II.
The small- region was studied particularly from the late 1980’s. Accurate ratios were obtained experimentally at small for several nuclei by the New Muon Collaboration (NMC) [7] and the Fermilab-E665 collaboration [8]. It became possible to test theoretical calculations in comparison with the data. The nuclear modification at small is called shadowing, which means that internal constituents are shadowed due to the existence of nuclear surface constituents. A laboratory frame picture for describing the shadowing is a vector-meson-dominance (VMD) type model [9]. A virtual photon transforms into vector meson states, which then interact with a target nucleus. The propagation length of the hadronic fluctuation exceeds the average nucleon separation (2 fm) in nuclei at , so that the shadowing occurs because of multiple scattering of the hadron inside the nucleus. On the other hand, the shadowing phenomena could be explained by a parton-recombination model [10, 11, 12, 13], which is a description in an infinite momentum frame. The recombination occurs because the localization size of a parton with momentum fraction exceeds 2 fm at .
We showed in the parton model with the rescaling and recombination mechanisms that the nuclear could be explained from very small to large [12, 14]. Although the nuclear structure functions are established, the sea-quark and gluon distributions are not well tested [15]. Of course, because the at small is essentially given by the sea-quark distribution, the sea modification should be equivalent to the modification in the leading order (LO) of . However, we would rather have independent confirmation, for example, by the Drell-Yan experiment. Although there exist the Fermilab-E772 Drell-Yan data [16], the small- shadowing part and the medium- region were not probed. Furthermore, there is little experimental information on the nuclear gluon distributions [17, 18]. An item of good news is that the Relativistic Heavy Ion Collider (RHIC) will be completed in the near future, so that the shadowing in the sea-quark and gluon distributions could be observed experimentally by the Drell-Yan and direct-photon processes. Considering these experimental possibilities, we should try to predict the shadowing behavior theoretically in order to test our theoretical understanding on high-energy nuclear structure.
The major purpose of this paper is extend the parton model in Ref. [12] to the studies of the sea-quark and gluon distributions in nuclei. In addition, the parton distributions in the nucleon are updated to the new ones. The small- distributions were particularly modified due to the HERA data after the publication of Ref. [12]. Another purpose is to study the parton distributions in the deuteron. They were assumed to be the same as those of the nucleon in the previous publications [12, 17]. In section II, our parton model is introduced with explanation for the rescaling and parton-recombination mechanisms. In section III, the structure functions are calculated for various nuclei in order to be compared with measured experimental data. In section IV, the model is extended to the sea-quark and gluon distributions. Their and dependent results are shown. As a byproduct of our investigation, we can discuss the relation between the deuteron and neutron structure functions. In section V, our results are compared with the experimental ratios . The summary is given in section VI.
II Nuclear model
People studied possible physics mechanisms for interpreting the medium- modification of the structure functions just after the EMC finding. A few years later, the small- mechanisms were investigated independently from the medium- physics. It is rather unfortunate that enough efforts are not made to unify these pictures to produce from small to large . For example, the parton distributions in the wide range are necessary for studying dependence of the structure functions because they should be supplied as input distributions. For this reason, we set up a parton model which could describe the parton distributions in the whole region in a dynamically consistent way [12]. We calculated the modification of the nuclear parton distributions at certain () by the rescaling and recombination mechanisms. Then, they are evolved to larger where experimental data are taken. Because the same model is used in our studies, we explain only the essential part in the following. The interested reader may look at the original papers [4, 5, 11, 12] for finding the detailed formalism.
A rescaling
As explained in the introduction, the rescaling model was originally proposed as a first explicit quark signature in nuclear physics in terms of nucleon-size modification in the nuclear medium [4]. As a result, the nuclear structure function is related to the nucleon’s by a simple rescaling,
| (2.1) |
where is called rescaling parameter. The factors and are confinement radii for the nucleus A and the nucleon, respectively.
The proponents of this model modified the interpretation [5]. They rather consider the rescaling model as an effective model, which could include the binding and/or nucleon modification effects. In order to justify this idea, they used factorization-scale independence. It means that physics observables should not depend on the scale which is introduced artificially by hand. This is generally used in structure functions, which are separated into nonperturbative quantities (parton distributions) and perturbative ones (coefficient functions) by the separation scale . The scale is introduced artificially, so that the structure functions should be independent of the scale. It leads to so called renormalization group equation. In our situation, the factorization means that a nuclear structure function is separated into a nucleon momentum distribution and the corresponding structure function in the nucleon. The factorization scale independence is not, to be exact, proved in this case. However, we consider it rather as a working hypothesis: the observables, nuclear structure functions, are independent of the artificial separation into nuclear physics and subnucleon physics. Then, the nuclear binding model could be also expressed in term of the rescaling terminology. For example, the binding energy and Fermi momentum in the Fermi gas model are related to the rescaling parameter by [5] and , where . Therefore, the rescaling model could be considered as an effective model which could include the binding-type nuclear effects and possibly also subnucleon-type contributions. In this sense, the rescaling parameter could be determined by fitting some experimental data, rather than calculating it in a particular nuclear model such as the one in the rescaling paper of 1985 [4]. In any case, the original fits are no longer valid if Fermi-motion effects are included [19]. As explained in section III, the parameter for the calcium nucleus is determined by the data at medium . The other nuclear values are calculated by using the A dependence relation of the rescaling model.
B Parton recombination
We use an infinite momentum picture, the parton-recombination model [10, 11, 12, 13], for describing the small- shadowing physics, although there are other descriptions, for example, VMD-type models [9] and Pomeron models [20]. These different models explain the nuclear structure functions in some ways or other, so the appropriate description may be determined by studying other observables such as nuclear gluon distributions or possibly the valence-quark distributions at small [21].
The parton recombination, which means the interaction of partons in different nucleons, is used as a model for interpreting the nuclear shadowing [10, 11, 12, 13]. This mechanism could occur by the following reason. In an infinite momentum frame, the average longitudinal nucleon separation in a Lorentz contracted nucleus is , and the longitudinal localization size of a parton with momentum is . At small (), the localization size becomes smaller than the average nucleon separation. It means that partons from different nucleons could interact significantly. The interaction is called parton recombination or parton fusion. According to this mechanism, the modification of a parton distribution is given by
| (2.2) |
for the recombination process . Here, the factor is defined by with the expression for the nuclear radius . The function is called parton fusion function. Because the recombination is opposite to the splitting process, the is related to the corresponding splitting function in the Dokshitzer-Gribov-Lipatov-Altarelli-Parisi (DGLAP) evolution equations:
| (2.3) |
where is the color-factor ratio, for example . The averages are taken over the initial color indices, for example, indicates the average over the index . There is also a momentum-cutoff factor for the leak-out partons. It indicates that large-momentum partons are confined in the small region so that they do not leak out from the nucleon. It is known that =2 fm is an appropriate value [22, 12], so that it is used throughout our analysis. Because the recombination formalism itself is discussed in detail in Refs. [11, 12], we do not repeat it here. The explicit equations are given in the Appendix part of Ref. [12].
III Structure functions F
In order to calculate nuclear parton distributions, it is necessary to employ a set of parton distributions in the nucleon. The optimum parton distributions are obtained by fitting many experimental data from various processes. There are three major groups in the studies of the unpolarized parametrization. They are CTEQ (Coordinated Theoretical/Experimental Project on QCD Phenomenology and Tests of the Standard Model), GRV (Glück, Reya, and Vogt), and MRS (Martin, Roberts, and Stirling). Among these parametrizations, we decided to take the MRS-R2 distributions [23] without any serious reason. Of course, the details of our numerical results depend on the input distributions; however, the essential results should not be altered. For simplicity, the MRS-R2 is modified to have the flavor symmetric sea, , in the following analyses.
We have to determine the point , at which the initial nuclear distributions are calculated. It is considered as a parameter in our model, and it is determined in the following way. In order to explain the large shadowing, for example in , it is necessary to take rather small because the recombination effect has a higher-twist nature (). On the other hand, perturbative Quantum Chromodynamics (QCD) is assumed in evolving the calculated distributions at to those at experimental points. Therefore, should be in the perturbative region. With these two reasons, we end up taking 1 GeV2. Because the MRS-R2 distributions are set up at =1 GeV2, it is simply taken as the MRS-R2 point, namely =1 GeV2, in the following analyses.
Using the MRS-R2 distributions, we calculate first the rescaling effects for the valence quark distributions at 1 GeV2. Because this procedure violates the momentum conservation, the gluon distribution is multiplied by a constant amount so as to satisfy the conservation. Then, the obtained distributions are used as input distributions for calculating the recombination effects. The experimental values are different depending on the region: they are typically a few GeV2 at small and a few dozen GeV2 at large . In order to compare with the experimental data, we evolve the obtained nuclear distributions at =1 GeV2 to those at =5 GeV2 by the parton-recombination (PR) evolution equations [24, 25]. In particular, we use the equations proposed by Mueller and Qiu [25] and their numerical solution in Ref. [26]. The QCD scale parameter of the MRS-R2 is =0.344 GeV.
In calculating the rescaling, it is necessary to find the rescaling parameter . As we mentioned in the previous section, is determined for explaining the experimental medium- ratios, , reasonably well. It is found that =1.74 is the appropriate value at =1 GeV2. The rescaling parameters of other nuclei are determined by the relationship of the original rescaling model. Namely, the scale parameter is determined by with =0.66 GeV2. The effective confinement size is given by =1.194 according to Eq. (2.1) and =1.74. The confinement size is 5.0 percent larger than the one (=1.137) in Ref. [4]. Therefore, other nuclear confinement radii in Ref. [4] are also multiplied by the factor 1.050. To be explicit, they are given for the deuteron, helium, carbon, and tin as =1.066, =1.186, =1.133, =1.437, =1.159, =1.557, =1.235, and =2.001, where we assumed that the nuclei are 4He, 12C, 40Ca, and 118Sn in the theoretical calculations. All the rescaling parameters are obtained at =1 GeV2. Using these parameters, we calculate the rescaling modification.
In the previous publication [12], the deuteron structure function is assumed to be equal to the one for the nucleon in calculating the ratios . A special attention should be paid for the deuteron if we wish to calculate it in the recombination model. There is an explicit nuclear radius factor in Eq. (2.2) and also in the PR evolution equations. However, it is well known that the deuteron radius does not follow the rule, with =1.1 fm. We estimate it by the relation , where is the distance between the proton and the neutron. Then, the constant becomes =1.56 fm for the deuteron. It is fairly large in comparison with the usual nuclear value =1.1 fm because the deuteron is a loosely bound system. It means that the recombination effects in the deuteron are much smaller than those in other nuclei. Throughout this paper, we use =1.56 fm for the deuteron.
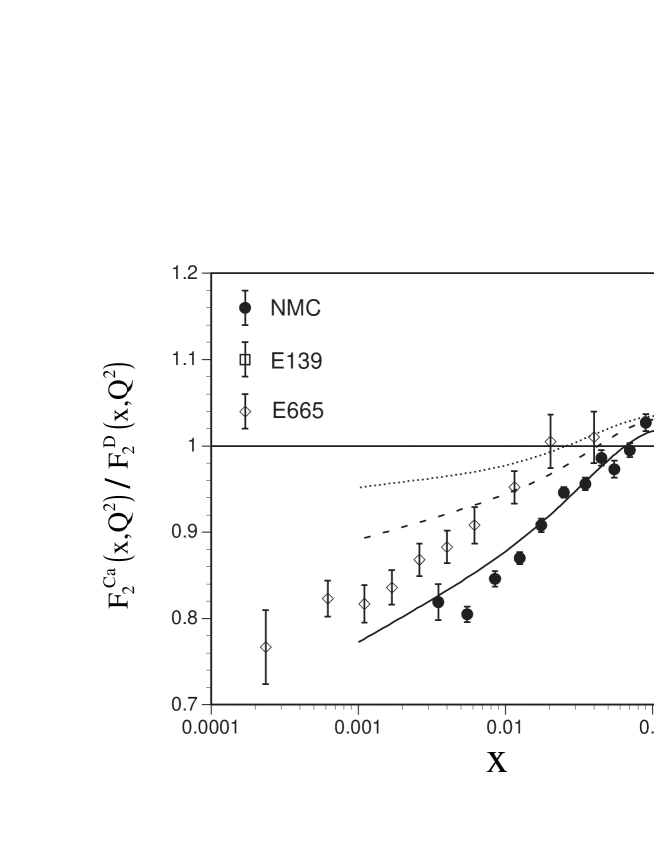
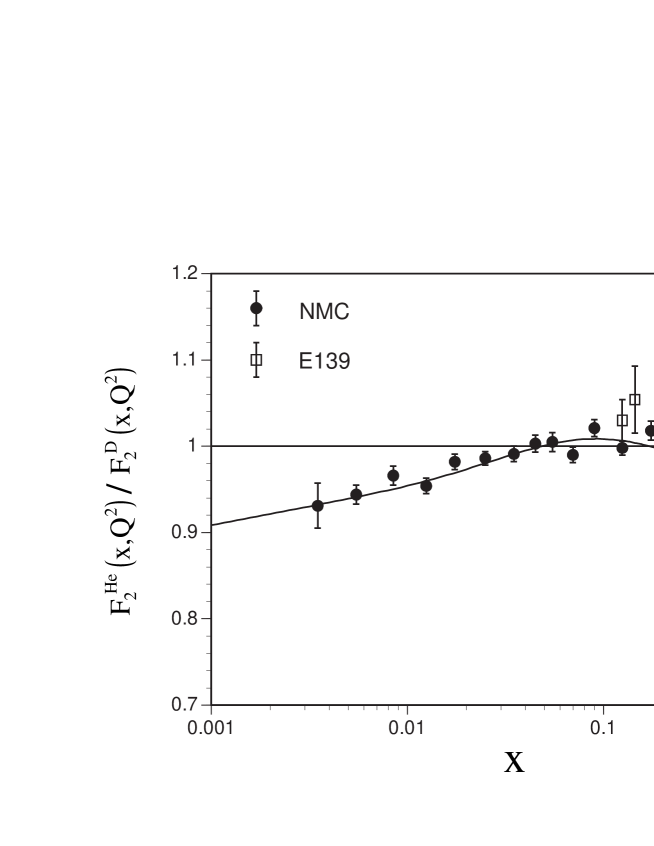
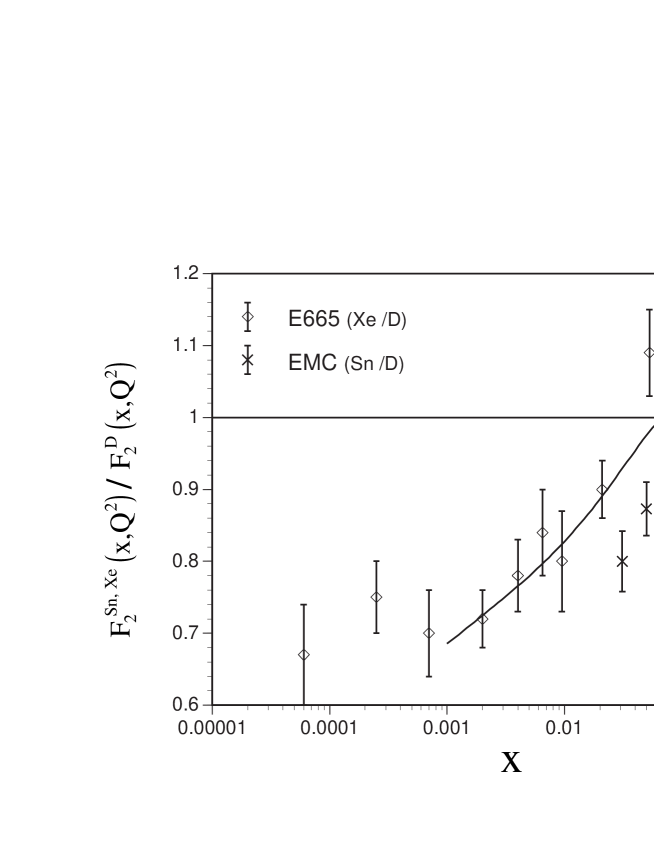
With these preparations, we are ready for calculating the ratios . First, we show the results for the calcium nucleus in Fig. 1. The dotted curve indicates the distribution at =1 GeV2. It should be noted that the convolution integrals of the next-to-leading-order (NLO) coefficient functions with the parton distributions are calculated for obtaining the . The ratio is evolved to the ones at =5 GeV2. The dashed curve is obtained by using the NLO DGLAP evolution equations, and the solid one is by the PR evolution equations. The dependence from =5 GeV2 to larger values is rather small as we show it later. The experimental data are those of the NMC [7], the Fermilab-E665 [8], and the SLAC-E139 [27]. The theoretical curves are not shown at because the values of the E665 data are very small and our perturbative calculations cannot be compared with them. We note that there are significant differences between the NMC and E665 data. From Fig. 1, we find that our theoretical shadowing is rather small at =1 GeV2 in comparison with the experimental one. The evolved distribution by the DGLAP shows also smaller shadowing. The NMC data can be explained only if the PR evolution equations are used. It is also interesting to find that the ratio at large is explained as a recombination effect without the explicit Fermi-motion corrections. We apply the model for other nuclei. Our results are compared with experimental data for a small and large nuclei, helium and tin, in Figs. 2 and 3 where the EMC data [28] are also shown. The solid curves indicate our theoretical results at =5 GeV2 with the PR evolution. Although the modification tends to be small at , we find in these figures that our model can explain the dependence reasonably well in the wide region () for the small, medium, and large size nuclei.
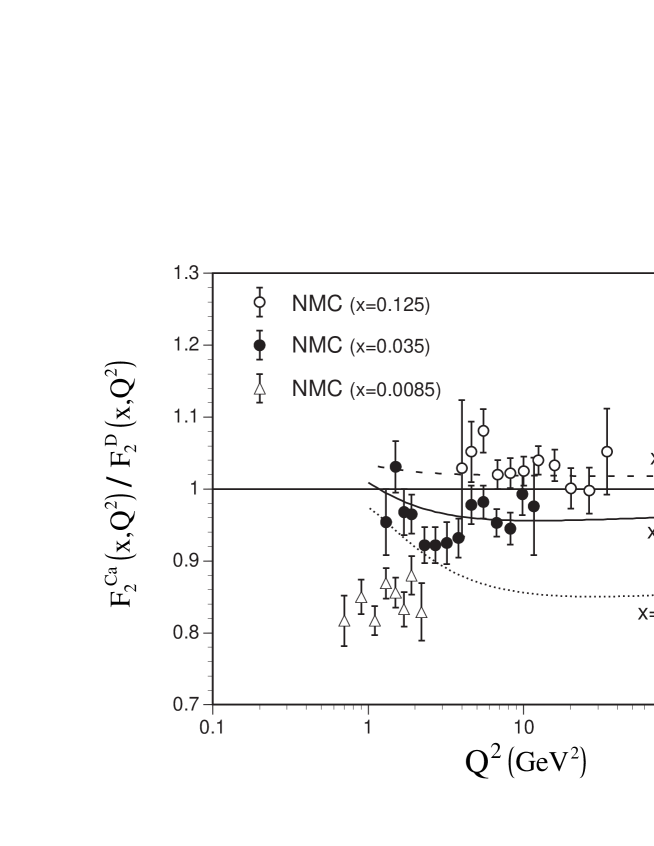
Next, dependence of is calculated at the fixed points, =0.0085, 0.035, and 0.125. Then, the theoretical ratios are compared with the NMC data in Fig. 4. The calculated results are shown by the dotted, solid, and dashed curves for =0.0085, 0.035, and 0.125, respectively. The figure indicates that our model is successful in explaining the dependence at =0.035 and 0.12; however, it is not very successful in the small region at =0.0085. Namely, the calculated shadowing is too small to explain the experimental one in the region 1 GeV2. Therefore, the model needs to be studied further whether it is in fact impossible to explain the shadowing behavior at small . We leave this problem as our future research topic.
We found that our model is successful in explaining the gross properties of the nuclear structure functions . It is interesting to extend the model to the studies of sea-quark and gluon distributions in nuclei. This topic is discussed in the next section.
IV Sea-quark and gluon distributions
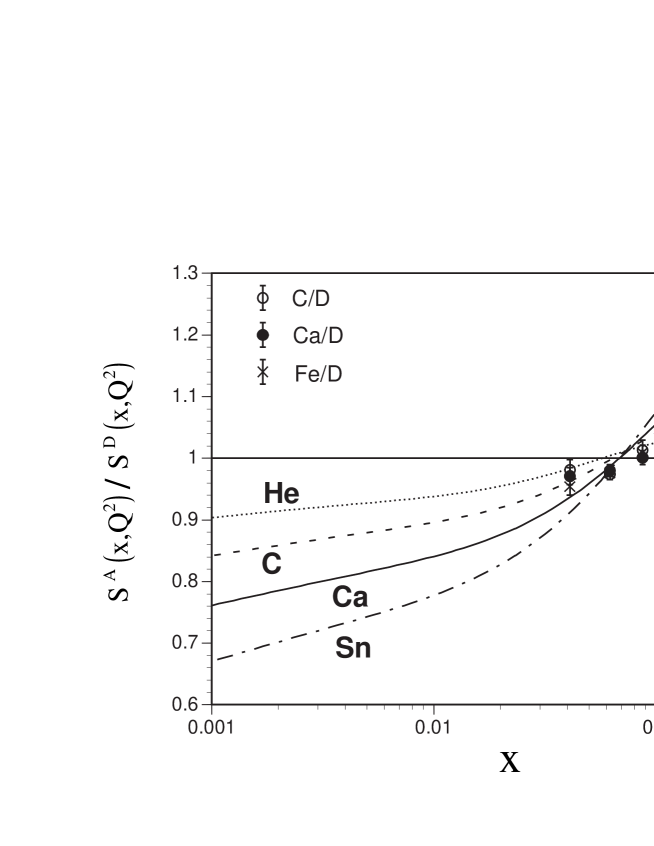
The nuclear modification of sea-quark and gluon distributions is not well investigated. Because the at small is determined by the sea-quark distributions, the sea-quark shadowing is almost equal to the shadowing. However, there is no independent experimental confirmation of the sea shadowing. There are Fermilab-E772 Drell-Yan data [16], which measured the ratios, , , and in the range . The data are shown in Fig. 5. Although the iron data are often quoted in suggesting that there is no nuclear modification in the measured range, it is not very obvious by noting the dependence and the experimental accuracy. The nuclear sea-quark distributions have been studied extensively in the context of the pion-excess model [29]. However, we do not step into the pion-excess problem in this paper.
We show our theoretical results for the helium, carbon, calcium, and tin nuclei in Fig. 5. The calculated sea-quark shadowing is not exactly equal to the one for because the gluon distribution also contributes to through the coefficient function. However, the gluon corrections are small so that both shadowing results are almost the same. The ratio becomes large at medium due to the recombination effects. The data for in Figs. 1 and 2 indicate antishadowing features at . Our model explains this region by the large sea-quark ratios in Fig. 5. However, we are annoyed that our ratios are too large to explain the experimental sea-quark distributions in the region . If there were no nuclear modification as suggested by the E772 data, the antishadowing should be interpreted as the valence-quark antishadowing. On the other hand, there seems no physics mechanism to produce the valence antishadowing in such a region [21]. Of course, it is possible to produce the antishadowing artificially if the baryon-number conservation is imposed with the valence-quark shadowing and the medium- EMC effect [30]. However, it does not solve the physics problem. We hope that experimentalists measure the sea-quark ratios from very small to medium accurately for several different nuclei. The accurate data should be able to clarify the theoretical problems. At this stage, there is no experimental information on the dependence of the sea-quark ratios, of course, except for the one implied by the data at small . We show the ratios for the calcium nucleus at =0.0085, 0.035, and 0.125 in Fig. 6. The curves in the figure are almost the same as those in Fig. 4 except at the =0.125 results where the valence-quark distributions also contribute.
The detailed sea-quark distributions will be investigated experimentally at RHIC (Relativistic Heavy Ion Collider). We may wait a few years for the accurate data. In addition, flavor distributions of the sea could be an interesting topic. For example, the asymmetry in nuclei is important for testing a dynamical aspect of the nuclear parton model [31]. There is also a possibility to measure the nuclear asymmetry at Fermilab [32].
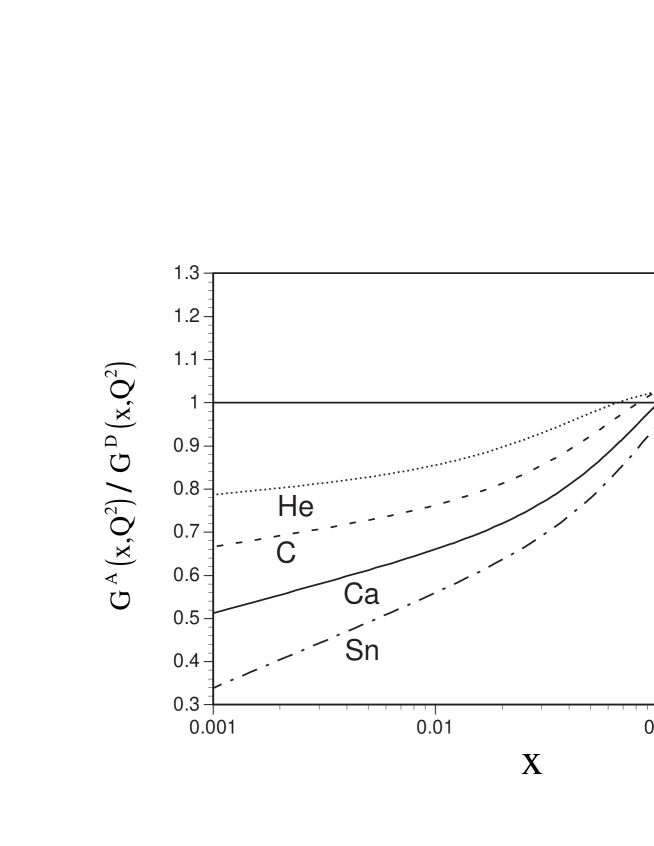
Next, the nuclear gluon distributions are calculated. We have already shown the first version in Ref. [17]; however, the results were not obtained in a consistent manner with the structure functions. Here, the model was tested first by comparing various data. We found that it is a fairly successful model in section III, so that it is reasonable to extend it to the studies of the sea-quark and gluon distributions. To find the accurate nuclear gluon distributions is important not only for establishing the nuclear model at high energies but also for other applications to heavy-ion physics. For example, the J/ suppression may be interpreted as a quark-gluon plasma signature; however, the initial gluon distributions in heavy nuclei are not known. It would be, at least partially, a local gluon shadowing effect [33]. In order to find the correct interpretation, the information on the precise gluon distributions is inevitable. At this stage, most people just assume that nuclear gluon distributions are equal to the nucleon’s distribution. However, it is known that the recombination mechanism produces strong gluon shadowing [17, 18]. Despite their importance, it is unfortunate that the gluon distributions are not actually measured. There are implicit data on the nuclear modification and explicit data taken by the NMC [34] for the ratio . However, the data are not accurate enough to enlighten us.
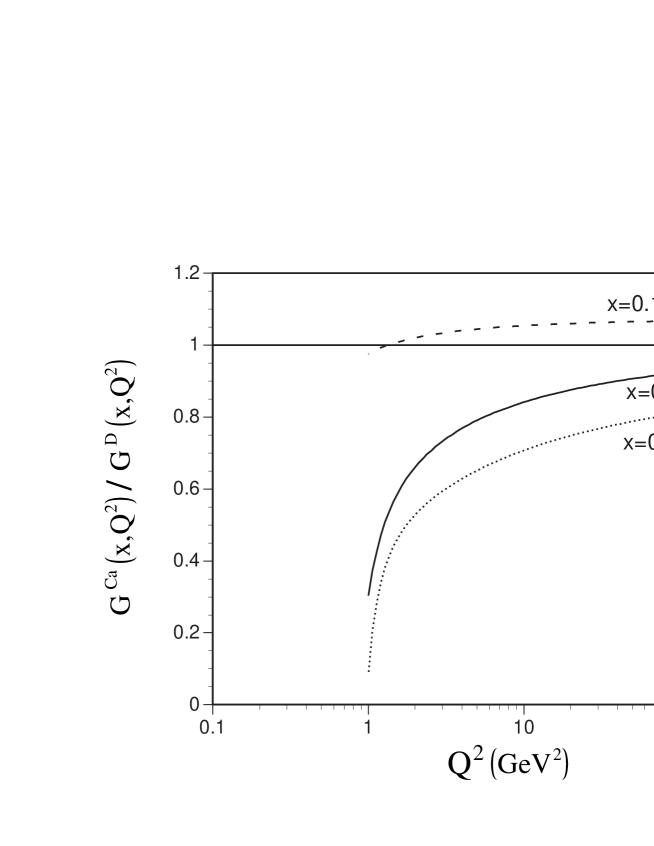
We show the calculated nuclear modification in Figs. 7 and 8. Figure 7 shows the dependence for the helium, carbon, calcium, and tin nuclei. The figure indicates that the gluon shadowing is significantly larger than that of quarks, and the ratio becomes large at medium due to the recombination effects. The dependence in Fig. 8 shows that the gluon shadowing is very large at small and it has large dependence at small .
It is interesting to test these predictions by future experiments. The RHIC facility is appropriate for finding the gluon shadowing [35], for example, through the direct-photon production process. In order to find accurate sea-quark and gluon distributions, experimental information is crucial.
V Deuteron
The nuclear corrections have been calculated in the deuteron for obtaining the structure-function ratios in section III. Here, we discuss the correction effects on a sum rule. Because there is no fixed target for the neutron, the deuteron or is usually used for measuring neutron structure functions. The nuclear corrections are important in extracting the “neutron” structure functions from the deuteron and data. For example, the Gottfried sum rule is given by the difference between and [36]:
| (5.4) |
The NMC used the measured proton and deuteron structure functions, and , for evaluating the difference [37],
| (5.5) |
These equations, of course, assume no nuclear correction. As it was discussed in section III, the nuclear structure functions are modified in the whole region. In particular, it is known that the small- part, namely the deuteron shadowing, is important for obtaining the “correct” sum in Eq. (5.4).
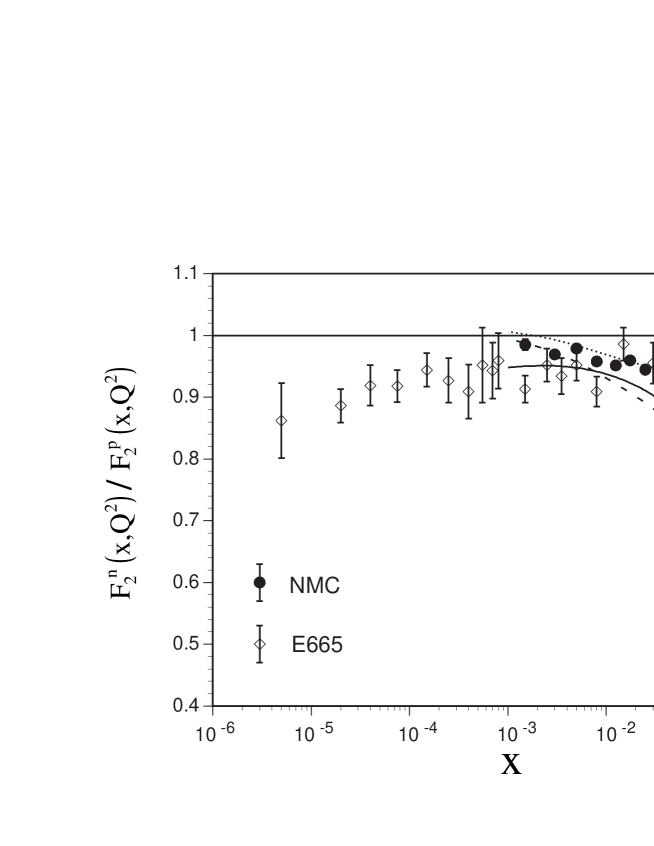
The ratios are measured by various groups. We compare our theoretical results with the data by the NMC [38] and the Fermilab-E665 [39] in Fig. 9. The dotted curve is the MRS-R2 distribution () for the ratio at =1 GeV2, and the dashed curve is the flavor symmetric one which is given by the modified MRS-R2 so as to have at =1 GeV2. The calculated distribution at =5 GeV2 is shown by the solid curve, which includes the nuclear corrections. Because the E665 small- data are taken at very small where the perturbative QCD would not work, the theoretical curves are not plotted at small (0.001).
Because the MRS-R2 was created so as to explain the NMC data as well as many other data, the dotted curve is in agreement with the NMC ratios. The flavor symmetric distribution, which is shown by the dashed curve, is well below the NMC data at small where sea-quark contributions are significant. The solid curve includes the nuclear modification due to the rescaling and recombinations, and it also contains evolution effects from =1 GeV2 to 5 GeV2. As a result, the solid curve is below the NMC data in the region (). It is mainly because our model used the flavor symmetric input in order to see the nuclear modification effects. However, the difference is partly attributed to the incomplete analyses by the NMC and MRS-R2 in the sense that the nuclear corrections are completely neglected. In order to illustrate the significance of the corrections, the nuclear contribution to the Gottfried sum is estimated by
| (5.6) |
The is the sum without the nuclear correction, and the second term () is the correction. The integral is evaluated for the structure functions at =5 GeV2, and we obtain for the integral from . It is the same order of magnitude as the other recent shadowing estimates [40]. This kind of correction should be taking into account in discussing the Gottfried sum rule and also other sum rules with neutron structure functions.
VI Summary
We have investigated the parton model with the rescaling and parton-recombination mechanisms for describing the parton distributions in nuclei. The nuclear modification of the distributions is calculated at =1 GeV2. If they are evolved to larger , for example =5 GeV2, by the parton-recombination evolution equations, they become comparable with the experimental shadowing.
The model was then extended to the studies of sea-quark and gluon distributions in nuclei. We showed the and dependent results of the ratios and . They indicate large nuclear shadowing at small and large ratios in the medium- region. These predictions could be tested by the experiments at RHIC. The understanding of nuclear parton distributions is very important for heavy-ion physics studies, for example, in finding a signature of the quark-gluon plasma.
We also indicated in our model that the nuclear effects should be taking into account properly in order to discuss the sum rules with neutron structure functions, which are extracted from the deuteron data.
Acknowledgment
SK and KU thank M. Miyama for discussions on nuclear structure functions and for his help in their numerical analyses.
REFERENCES
-
[1]
Email: kumanos@cc.saga-u.ac.jp.
Information on their research is available at
http://www.cc.saga-u.ac.jp/saga-u/riko/physics/quantum1/structure.html. - [2] A summary is given in D. F. Geesaman, K. Saito, and A. W. Thomas, Ann. Rev. Nucl. Part. Sci. 45, 337 (1995).
- [3] J. J. Aubert et al. (European Muon Collaboration (EMC)), Phys. Lett. B123, 275 (1983).
- [4] F. E. Close, R. G. Roberts, and G. G. Ross, Phys. Lett. B129, 346 (1983); F. E. Close, R. L. Jaffe, R. G. Roberts, and G. G. Ross, Phys. Rev. D31, 1004 (1985).
- [5] F. E. Close, R. G. Roberts, and G. G. Ross, Phys. Lett. B168, 400 (1986); Nucl. Phys. B296, 582 (1988).
- [6] S. V. Akulinichev, S. A. Kulagin, and G. M. Vagradov, Phys. Lett. B158, 485 (1985).
- [7] P. Amaudruz et al. (New Muon Collaboration (NMC)), Z. Phys. C51, 387 (1991); Nucl. Phys. B441, 3 (1995).
- [8] M. R. Adams et al. (Fermilab-E665 collaboration), Phys. Rev. Lett. 68, 3266 (1992); Z. Phys. C67, 403 (1995).
- [9] L. L. Frankfurt and M. I. Strikman, Phys. Rep. 160, 235 (1988); Nucl. Phys. B316, 340 (1989); S. J. Brodsky and H. J. Lu, Phys. Rev. Lett. 64, 1342 (1990); N. N. Nikolaev and B. G. Zakharov, Phys. Lett. B260, 414 (1991); Z. Phys. C49, 607 (1991); W. Melnitchouk and A. W. Thomas, Phys. Lett. B317, 437 (1993); Phys. Rev. D47, 3783 & 3794 (1993); S. A. Kulagin, G. Piller, and W. Weise, Phys. Rev. C50, 1154 (1994); G. Piller, W. Ratzka, and W. Weise, Z. Phys. A352, 427 (1995).
- [10] N. N. Nicolaev and V. I. Zakharov, Phys. Lett. B55, 397 (1975).
- [11] F. E. Close, J. Qiu, and R. G. Roberts, Phys. Rev. D40, 2820 (1989).
- [12] S. Kumano, Phys. Rev. C48, 2016 (1993).
- [13] J.-J. Yang and G.-L. Li, Z. Phys. C76, 287 (1997).
- [14] S. Kumano, Phys. Rev. C50, 1247 (1994); S. Kumano and M. Miyama, Phys. Lett. B378, 267 (1996). Other dependence studies are W. Melnitchouk and A. W. Thomas, Phys. Rev. C52, 3373 (1995); T. Gousset and H. J. Pirner, Phys. Lett. B375, 349 (1996); B. Kopeliovich and B. Povh, Z. Phys. A356, 467 (1997); D. Indumathi and W. Zhu, Z. Phys. C74, 119 (1997); D. Indumathi, Z. Phys. C76, 91 (1997); see also Ref. [15].
- [15] E. J. Eskola, V. J. Kolhinen, and P. V. Ruuskanen, hep-ph/9802350.
- [16] D. M. Alde et al. (Fermilab-E772 collaboration), Phys. Rev. Lett. 64, 2479 (1990).
- [17] S. Kumano, Phys. Lett. B298, 171 (1993).
- [18] K. J. Eskola, Nucl. Phys. B400, 240 (1993); K. J. Eskola, J. Qiu, and X.-N. Wang, Phys. Rev. Lett. 72, 36 (1994); L. McLerran and R. Venugopalan, Phys. Rev. D49, 2233 & 3352 (1994); nucl-th/9705055; A. L. Ayala, M. B. Gay Ducati, and E. M. Levin, Nucl. Phys. B493, 305 (1997).
- [19] R. P. Bickerstaff and G. A. Miller, Phys. Lett. B168, 409 (1986).
- [20] P. Castorina and A. Donnachie, Phys. Lett. B215, 589 (1988); Z. Phys. C45, 141 (1989); J. Kwiecinski, Z. Phys. C45, 461 (1990); L. L. Frankfurt and M. I. Strikman, Phys. Lett. B382, 6 (1996); V. Barone and M. Genovese, Phys. Lett. B412, 143 (1997).
- [21] R. Kobayashi, S. Kumano, and M. Miyama, Phys. Lett. B354, 465 (1995); S. A. Kulagin, hep-ph/9801039.
- [22] C. H. Llewellyn Smith, Nucl. Phys. A434, 35c (1985).
- [23] A. D. Martin, R. G. Roberts, and W. J. Stirling, Phys. Lett. B387, 419 (1996).
- [24] L. V. Gribov, E. M. Levin, and M. G. Ryskin, Nucl. Phys. B188, 555 (1981); Phys. Rep. 100, 1 (1983).
- [25] A. H. Mueller and J. Qiu, Nucl. Phys. B268, 427 (1986).
- [26] M. Miyama and S. Kumano, Comput. Phys. Commun. 94, 185 (1996).
- [27] J. Gomez et al. (SLAC-E139 collaboration), Phys. Rev. D49, 4348 (1994).
- [28] J. Ashman et al. (EMC), Phys. Lett. B202, 603 (1988).
- [29] E. L. Berger, F. Coester, and R. B. Wiringa, Phys. Rev. D29, 398 (1984); H. Jung and G. A. Miller, Phys. Rev. C41, 659 (1990); E. Marco, E. Oset, and P. Fernández de Córdoba, Nucl. Phys. A611, 484 (1996); G. A. Miller, Phys. Rev. C56, R8 (1997).
- [30] L. L. Frankfurt, M. I. Strikman, and S. Liuti, Phys. Rev. Lett. 65, 1725 (1990).
- [31] S. Kumano, Phys. Lett. B342, 339 (1995).
- [32] J.-C. Peng, private communication (February, 1998): The proposal is being written to measure the nuclear at Fermilab.
- [33] S. Kumano and F. E. Close, Phys. Rev. C41, 1855 (1990); S. Kumano, in Proceedings of the International Workshop on Gross Properties of Nuclei and Nuclear Excitations, Hirschegg, Austria, Jan. 2025, 1992, edited by H. Feldmeier.
- [34] P. Amaudruz et al. (NMC), Nucl. Phys. B371, 553 (1992).
- [35] N. Baron and G. Baur, Phys. Rev. C48, 1999 (1993); D. Kharzeev and H. Satz, Phys. Lett. B327, 361 (1994); S. Liuti and A. Vogt, Phys. Rev. C51, 2244 (1995); Z. Lin and M. Gyulassy, Phys. Rev. Lett. 77, 1222 (1996); K. J. Eskola, nucl-th/9705027; N. Hammon, A. Dumitru, H. Stöcker, and W. Greiner, hep-ph/9801292.
- [36] S. Kumano, hep-ph/9702367, Phys. Rep. in press.
- [37] P. Amaudruz et al. (NMC), Phys. Rev. Lett. 66, 2712 (1991); M. Arneodo et al. Phys. Rev. D50, R1 (1994).
- [38] M. Arneodo et al. (NMC), Nucl. Phys. B487, 3 (1997).
- [39] M. R. Adams et al. (Fermilab-E665), Phys. Rev. Lett. 75, 1466 (1995); Phys. Rev. D54, 3006 (1996).
- [40] See section 2.5 of Ref. [36] and references therein for other works.