Ginkeepaspectratio
The ALLM parameterization of
an update
Abstract
The ALLM parameterization of has been updated by using all published data to determine its parameters. The fit yields a /ndf of 0.97 for the 1356 data points. The updated ALLM parameterization, ALLM97, gives a good description of all the available data in the whole and range studied so far ( GeV2).
DESY 97–251
December 1997
1 Introduction
The ALLM (Abramowicz, Levin, Levy, Maor) parameterization [1] is a parameterization for describing the total cross section, , above the resonance region in the whole range, where is the negative of the four-momentum transfer squared of the exchanged photon in interactions. It is constructed so as to include also the real photon () cross section. There were two main reasons for such a parameterization. The practical reason was that it was needed for estimating acceptance corrections and radiative corrections in the whole region for 3 GeV2, where is the center of mass energy. The theoretical reason was the hope that it would shed light on the transition region between the soft and hard interactions and their interplay.
The parameterization is based on a Regge motivated approach, similar to that used earlier by Donnachie and Landshoff [2], extended into the large regime in a way compatible with QCD expectations. The data used to fit the parameters were all the measurements available in 1991 together with the total photoproduction cross section data, which were measured at that time up to center of mass energies of 20 GeV. In spite of the fact that the fit used relatively high Bjorken data and data of at low energies, its predictions agreed amazingly well with the new HERA data, both for real and virtual photon cross sections. This can be seen in figure 1 which shows the total cross section as function of the center of mass energy squared, , for fixed values [3]. The curves are the ALLM parameterization which were fitted to the lower energy data ( GeV2) and extrapolated to the first HERA measurements. The predictions did very well for the photoproduction data as well as for the GeV2 region. However, at low , in the intermediate 5 25 GeV2 region the predictions turned out to be higher than the data.
An attempt was made in 1995 to include the first HERA data in the fit. The new parameterization, ALLM-N [4], did somewhat better in the region of 10 GeV2, as can be seen in figure 2, but was not quite satisfactory in the low region.
The purpose of this note is to describe the results of a further update of the ALLM parameterization, to be denoted ALLM97, where all available published data of , including the very low , low data are used. As will be shown, this parameterization gives an excellent description of all the data and can reproduce features like the slope in and in , where all other parameterizations fail. It can be used in the whole and region above the resonance region ( GeV2).
2 The ALLM parameterization - a short recap
The proton structure function is assumed to have the form
| (1) |
where is the effective photon mass. The functions and are the contributions of the Pomeron or Reggeon exchanges to the structure function. They take the form
| (2) |
The slowly varying function is defined as
| (3) |
where is the QCD scale and is a parameter.
The two scaled variables and are modified Bjorken– variables which include mass parameters and , interpreted as effective Pomeron and reggeon masses:
| (4) |
where is the proton mass. The scale parameters , and , allow a smooth transition to = 0 values. For large , , the scaled and variables approach Bjorken .
Four of the six parameters in equation 2, and increase with as
| (5) |
while the remaining two, and decrease with like:
| (6) |
There are altogether 23 parameters to be determined from a fit to the data. Note that about half of the parameters are needed for the description of the low (high ) region where higher twist effects are important.
The data used in the first fit (ALLM91) were all data available from the pre–HERA era, which resulted in 694 data points. These included the low energy data of [5], and the data of the SLAC [6], BCDMS [7], and NA28 [8] collaborations. The best fit to the data had a /ndf=0.98.
As stated in the introduction and shown in figure 1, the predictions of the parameterization ALLM91 to the first HERA data were in agreement with the measurements at =0 and in the higher region. Though some of the low parameters were constrained by the NA28 measurements, the intermediate region was not well described, mainly due to the fact that the dependence of the Pomeron intercept, , shown in figure 3, came out too steep in the first fit.
The inclusion of the first HERA measurements as well as the preliminary NMC data yielded the parameterization ALLM-N, which produced a milder transition of the Pomeron intercept, but fails to describe the latest low low data. This prompted a third attempt to determine the parameters including the latest data, as described in the next section.
3 The data sample for ALLM97
The following data have been used for the present fit. All fixed target photoproduction total cross section data were used together with those of H1 [9] and ZEUS [10] in the HERA region, a total of 228 data points. The structure function data of the following fixed target collaborations: SLAC (211 points), BCDMS (177), E665 (87) [11], and NMC (158) [12]. From the HERA collider we used the H1–94 data (193 points) [13], H1 low data (44) [14], the ZEUS shifted vertex data (36) [15], ZEUS–94 (188) [16] and the very low ZEUS data measured with a beam pipe calorimeter (BPC) (34 data points) [17]. Altogether 1356 data points were used in the fit resulting in a /ndf=0.97. The contribution of each data sample to the is given in table 1.
Data set # of points [5], [9], [10] 228 262.3 SLAC [6] 211 171.2 BCDMS [7] 177 168.1 E665 [11] 87 95.7 NMC [12] 158 142.0 H1–94 [13] 193 127.1 H1(Low ) [14] 44 34.4 ZEUS(SVX) [15] 36 26.7 ZEUS–94 [16] 188 253.8 ZEUS(BPC) [17] 34 17.3 Total 1356 1298.7 /ND 0.97
4 Results
The resulting parameter values of the ALLM97 fit are compared in table 2 to their values from the ALLM91 fit.
Parameter ALLM91 ALLM97 (GeV2) 0.30508 0.31985 (GeV2) 10.676 49.457 (GeV2) 0.20623 0.15052 (GeV2) 0.27799 0.52544 (GeV2) 0.06527 0.06527 0.26550 0.28067 0.04856 0.22291 1.04682 2.1979 -0.04503 -0.0808 -0.36407 -0.44812 8.17091 1.1709 0.49222 0.36292 0.52116 1.8917 3.5515 1.8439 0.67639 0.80107 0.49027 0.97307 2.66275 3.4942 0.60408 0.58400 0.17353 0.37888 1.61812 2.6063 1.26066 0.01147 1.83624 3.7582 0.81141 0.49338
The biggest difference can be seen in the value of the scale parameter of the Pomeron which increased by almost a factor of 5. This increase affects the shape of the transition region in the low low region. This can be seen in figure 4 where the dependence of the Pomeron intercept on is plotted for the old (ALLM91) and the new (ALLM97) parameterization. The latter allows for an early start of the transition from the soft to the hard regime. Note that in the present fit the intercept at =0 was fixed to the Donnachie–Landshoff (DL) [18] value since the total photoproduction measurements in the HERA region do not allow a precise determination of this value.
4.1 as function of
The data [19] used in the fit are displayed in figure 5 as function of for fixed intervals, together with the results of the ALLM97 parameterization. One sees the well known scaling violation behaviour of the data, being positive for low values and turning negative in the high region.
The curves in the figure are the results of the ALLM97 parameterization and are seen to go through most of the data in the whole () region. This reflects the good obtained from the fit.
4.2 as function of
The H1 collaboration [14] presented their results together with those of the ZEUS BPC data as an effective virtual photon-proton cross section, , as function of for fixed intervals. The effective cross section is given by , where and are the cross sections for transverse and longitudinally polarized virtual photons and is the ratio of longitudinal to transverse flux. The data are displayed in figure 6. Since in the HERA kinematic region 1, the data are compared to the old (ALLM-N) and new (ALLM97) parameterization of . The ALLM97 parameterization gives a good description of the data. Also shown are the two points at =0 which are also well described by the new parameterization.
4.3 as function of
The data can be converted to using the relation
| (7) |
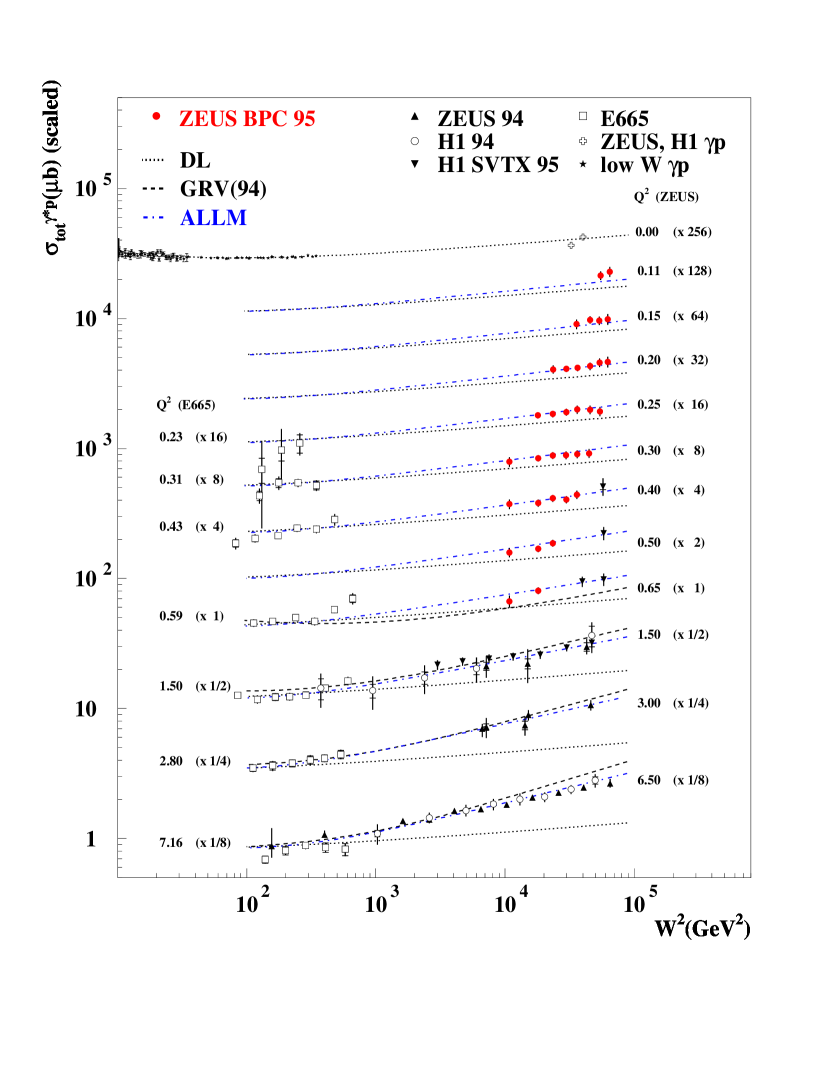
The data at low , starting as low as =0.11 GeV2, are shown in figure 7 in the form of together with the real photon total cross sections. The data are compared to expectations of different parameterizations. While the Donnachie–Landshoff (DL) parameterization agrees well with , its predictions are lower than the data once 0, with the disagreement increasing with . The GRV [20] parameterization is plotted starting at = 0.65 GeV2, where it lies below the data, while at higher values the predictions are above the data. The ALLM97 parameterization agrees with the data at all values.
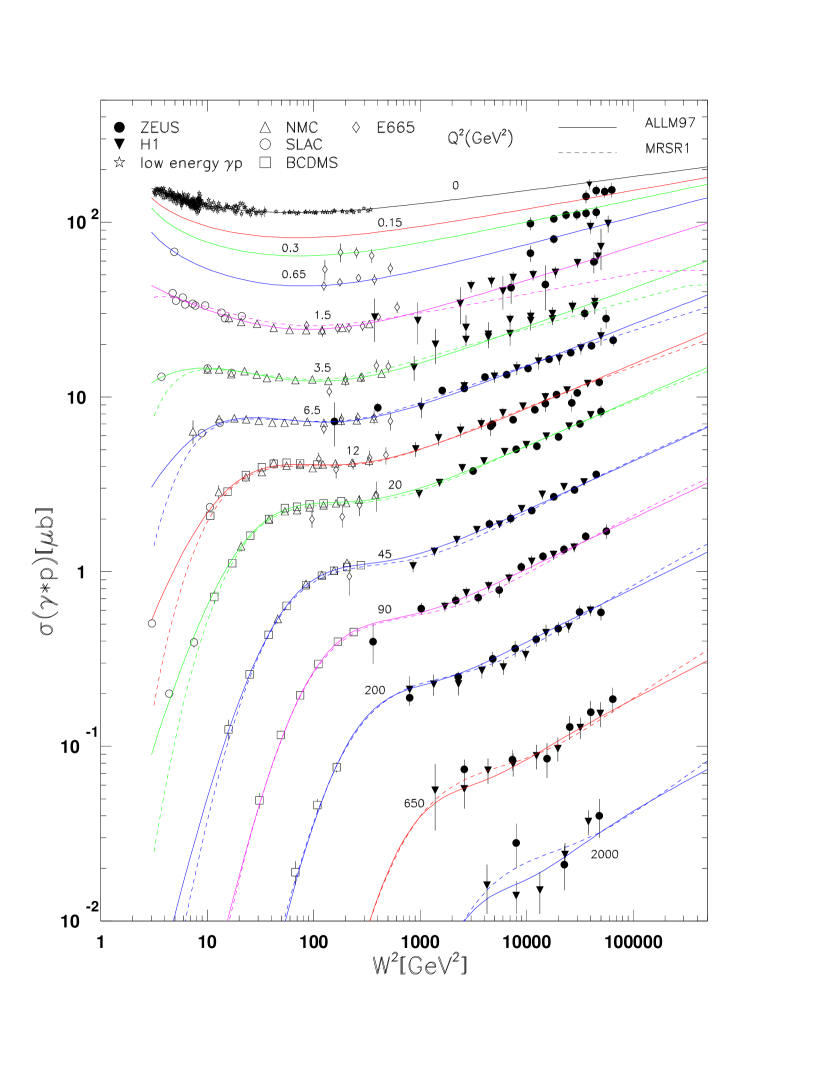
The good agreement of the ALLM97 parameterization in the whole accessible kinematic region at present can be seen in figure 8 where the total cross section is plotted in the range GeV2. It gives a good description of the data at high as well as at low .
In order to compare the results of the ALLM97 parameterization to that of a recent QCD evolution type of parameterization, we show in the same figure also the MRSR1 [21] parameterization which is valid for 1.25 GeV2. The two parameterizations agree well with each other for 10 GeV2, while at lower values the MRSR1 parameterization has a shallower dependence and thus is lower than the data.
5 The transition region
The different behaviour of the high data and at =0 prompted the measurements of deep inelastic reactions in the low region in order to find where the transition takes place. We will look at two ways of studying this question. One is by looking at the change in the slope of with respect to and the other is to study , both of which are discussed below.
5.1 as function of for some values
The scaling violation of is expected to increase as gets smaller according to QCD. This feature is also borne out by the data as shown in figure 5. One can quantify this by looking at the change of the slope of with respect to for different values. Once the non–perturbative processes take over, as expected at low , one should see a change in the slope. The place where the change occurs would indicate the transition from soft to hard physics.
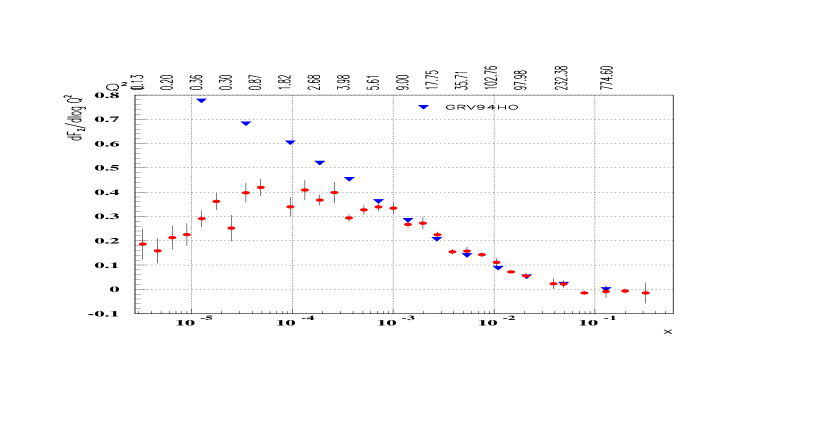
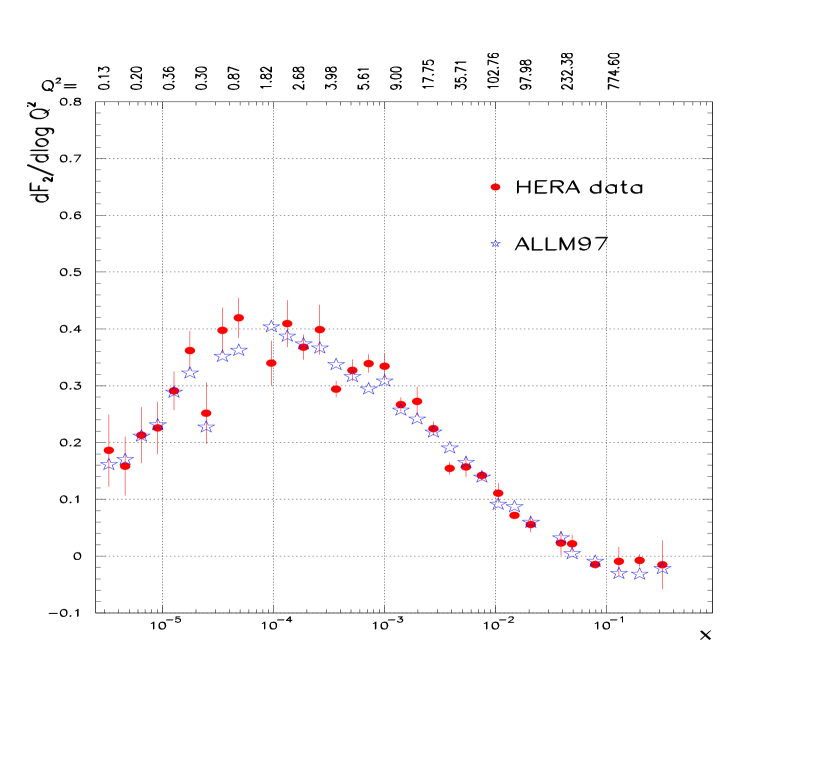
The distribution of as function of [22] is shown for the HERA data in figure 9 for values ranging from about 1000 GeV2 down to 0.13 GeV2. Some values are given at the top of the figure. The HERA data include the H194, H1 low , ZEUS94, ZEUS shifted vertex and ZEUS BPC data. As expected, the slope rises as decreases down to . However for lower there is a change in the tendency of the slope which becomes smaller as decreases. This happens at values of about 1-2 GeV2. Note that as decreases also decreases. In the same figure we plot for comparison the expectation of the GRV parameterization. This parameterization starts its evolution at 0.4 GeV2. While the parameterization shows the same features as the data for 5 GeV2, it continues to rise with also below , contrary to the data. Judging from the GRV distribution, the turnover point starts as high as 4 GeV2.
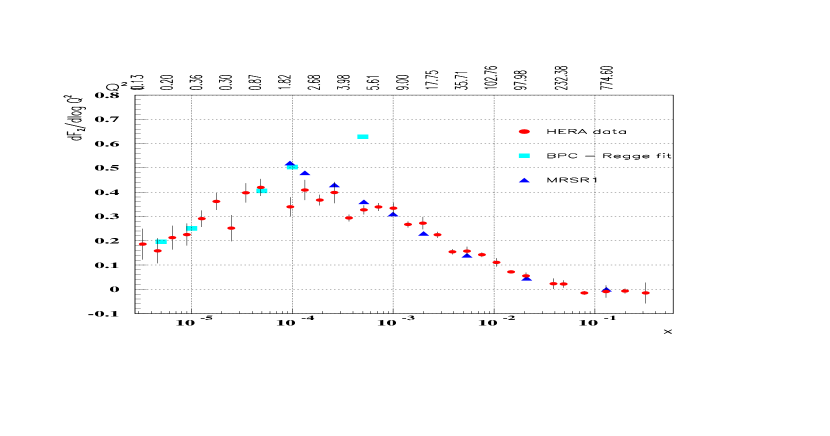
Another way of trying to find the turning point is to compare the same data to another QCD evolution type parameterization and to a Regge based one. This is done in figure 10, where the data are compared to the results of the MRSR1 parameterization and to the expectations from a Regge fit which was done [23] to the BPC data. The MRSR1 parameterization start its evolution at = 1.25 GeV2, where it is higher than the data until about 3-4 GeV2 from whereon it follows the data. The Regge fit starts from the lowest point and agrees with the data up to about = 1 GeV2, but continues to rise at higher values contrary to the data. The QCD and Regge results cross at 2 GeV2. One could thus conclude from here that the transition region is in the region of 1 - 3 GeV2.
Finally, in figure 11 the data are compared to the ALLM97 parameterization. One observes good agreement between the parameterization and the data. Thus one does not need to use two different parameterizations to describe the low soft and the high hard regimes. ALLM97 gives a good parameterization of both regimes.
5.2 as function of
The slope of can be related to the Pomeron intercept. In the low region, is behaving like , where is a function of . Since for fixed , , and therefore - 1. Therefore, measuring as function of is equivalent to measuring . When making this interpretation it is crucial to choose the right region from which the slope is determined.
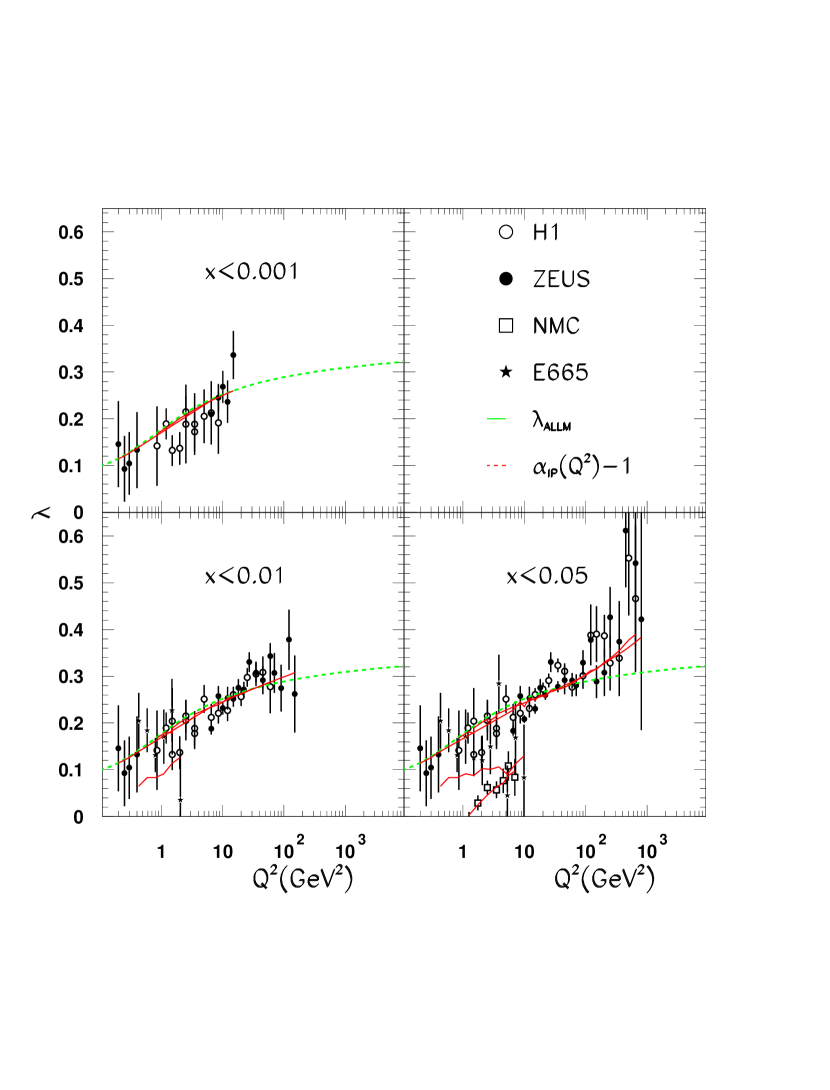
This last point is demonstrated in figure 12 where the slope as function of is shown for different cuts, as indicated in the figure, for the separate data sets of each experiment. Note that in order to obtain at a fixed , a minimum of 4 data points at different values were required. The full line is - 1 as calculated from the ALLM97 parameterization, where is the Pomeron intercept, and the dashed line gives the value of obtained from the parameterization in the same procedure as that applied to the data. As one sees, as long as one uses data in the very low region, , one can correlate the measured slope with the Pomeron intercept. For larger cuts may not be always a good estimate of -1, as shown for example for 0.05. The NMC data in the low region do not reach very low values, their lowest being =0.0045, and thus produce low results. The HERA data in the region 200 GeV2 overestimate the Pomeron intercept by determining the slope in a narrow region, typically . These effects are reproduced by the ALLM97 parameterization.
6 Summary and conclusions
The ALLM parameterization has been updated by using all the published data to determine its parameters leading to ALLM97. A very good description of the data in the whole () kinematic region is obtained, including the = 0 photoproduction measurements down to = 3 GeV2 and the low and low region where the transition from soft to hard processes is observed in the data.
We have hereby demonstrated that it is possible to find a functional form which describes the data in the whole of the kinematical region. Such a parameterization has many practical applications and in addition allows to study features of the data which are helpful for understanding the interplay between soft and hard processes.
Acknowledgments
We would like to thank our colleagues Eugene Levin and Uri Maor for their continuous support in this study. We also thank Vladimir Chekelyan and Bernd Surrow for their help with some of the figures. The critical reading of the text by Guenter Wolf is highly appreciated.
This work was partially supported by the German–Israel Foundation (GIF) and the Israel Science Foundation.
References
- [1] H. Abramowicz, E. Levin, A. Levy, U. Maor, Phys. Lett. B269 (1991) 465.
- [2] A. Donnachie, P.V. Landshoff, Nucl. Phys. B244 (1984) 322.
- [3] A. Levy, DESY 95–003 (1995).
- [4] A. Marcus, TAUP–2350 (1996).
-
[5]
D,O, Caldwell et al., Phys. Rev. Lett. 40 (1978) 1222;
S.I. Alekhin et al., CERN–HERA 87–01 (1987). - [6] L.W. Whitlow, SLAC–357 (1990).
- [7] BCDMS Collab., A.C. Benvenuti et al., Phys. Lett. B223 (1989) 485.
- [8] NA28 Collab., M. Arneodo et al., Nucl. Phys. B333 (1990) 1.
- [9] H1 Collab., S. Aid et al., Zeit. Phys. C69 (1995) 27.
- [10] ZEUS Collab., M. Derrick et al., Zeit. Phys. C63 (1994) 391.
- [11] E665 Collab., M.R. Adams et al., Phys. Rev. D54 (1996) 3006.
- [12] NMC Collab., M. Arneodo et al., Nucl. Phys. B483 (1997) 3.
- [13] H1 Collab., S. Aid et al., Nucl. Phys. B470 (1996) 3.
- [14] H1 Collab., C. Adloff et al., Nucl. Phys. B497 (1997) 3.
- [15] ZEUS Collab., M. Derrick et al., Zeit. Phys. C69 (1996) 607.
- [16] ZEUS Collab., M. Derrick et al., Zeit. Phys. C72 (1996) 399.
- [17] ZEUS Collab., J. Breitweg et al., Phys. Lett. B407 (1997) 432.
- [18] A. Donnachie, P. V. Landshoff, Phys. Lett. B296 (1992) 227.
- [19] See e.g. H. Abramowicz, Rapporteur talk in Proceedings of the XXVIII International Conference on High Energy Physics, Warsaw, Poland, 1996.
- [20] M. Glück, E. Reya, A. Vogt, Zeit. Phys. C67 (1995) 433.
- [21] A.D. Martin, R.G. Roberts, W.J. Stirling, Phys. Lett. B387 (1996) 419.
- [22] A. Caldwell, Invited talk in the DESY Theory workshop, October 1997.
- [23] B. Surrow, private communication.