Report of the Working Group on ‘W Mass and QCD’
Abstract
The W Mass and QCD Working Group discussed a wide variety of topics relating to present and future measurements of at LEP 2, including QCD backgrounds to production. Particular attention was focused on experimental issues concerning the direct reconstruction and threshold mass measurements, and on theoretical and experimental issues concerning the four jet final state. This report summarises the main conclusions.
[W Mass and QCD]
-
1University of Torino, Italy
2University of Birmingham, UK
3University of Siegen, Germany
4ICSTM, London, UK
5Rutherford Appleton Laboratory, UK
6CERN, Geneva, Switzerland
7University of Durham, UK
8University of Cambridge, UK
9University of Oxford, UK
10University of Lancaster, UK
11University of Manchester, UK
12ETH Zurich, Switzerland
13University of Southampton, UK
14University of Glasgow, UK
∗ convenors
1 Introduction††footnotemark:
††footnotetext: Unless otherwise stated, the sections have been prepared by the convenors.The ‘W Mass and QCD Working Group’ addressed a variety of topical questions during the Workshop. The format varied from formal seminar presentations to informal discussions, with a total of 28 people contributing. In this article we summarise the outcome of the discussions, including in particular new results obtained both during and after the meeting. We do not attempt to review the status of the various physics topics prior to the meeting, as this was very well covered in the plenary talks by J C Thompson [1], B R Webber [2] and G Cowan [3].
For most of the time the Working Group separated into two partially overlapping subgroups. The first focused on theoretical and experimental issues concerning various aspects of the final state in and QCD four jet production, in particular colour reconnection, Bose-Einstein correlations, and the accuracy of current QCD models for the four jet final state. The second subgroup was concerned with mainly experimental issues concerning the direct reconstruction and threshold cross section methods for measuring at LEP 2. In addition, the subgroup updated the expected precision of the two methods based on experience with the two methods to date.
2 Aspects of the hadronic final state in production
2.1 Experimental aspects of colour reconnection ††footnotemark:
††footnotetext: Prepared by M F Watson, N K WatsonColour reconnection (also referred to as ‘rearrangement’ or ‘recoupling’) in decays has been the subject of many studies (e.g. [4, 5, 6]) and at present there is agreement that observable effects of interference between the colour singlets in the perturbative phase are expected to be small. In contrast, significant interference in the hadronisation process appears a viable prospect but, with our current lack of knowledge of non-perturbative QCD, such interference can only be estimated in the context of specific models [5, 7, 8, 9, 10, 11]. In the studies described below, experimentally accessible features of these models444In studying these models, no retuning was performed when reconnection was enabled. are investigated, paying particular attention to the bias introduced to a typical measurement of by direct reconstruction of the decay products.
Throughout this section reconnection effects were studied using: PYTHIA 5.7 [tt11], type I and type II superconductor models (with the string overlap integral in the type I case characterised by ) [5, 6]; ARIADNE 4.08 allowing reconnection between the two W bosons; and HERWIG 5.9, in both its default reconnection model and also a ‘colour octet’ variant in which merging of partons to form clusters was performed on a nearest neighbour basis555This was suggested by B R Webber, as a partial emulation of the model of reference [11].. In all cases, the tuning of the models was as used in reference [12].
2.1.1 Inclusive charged multiplicity
It has been suggested [5, 7] that simple observable quantities such as the charged multiplicity in restricted rapidity intervals may be sensitive to the effects of colour reconnection. More recently [11] it was suggested that the effect on the inclusive charged multiplicity itself may be larger than previously considered and that the mean hadronic multiplicity in events, , may be as much as 10% smaller than twice the hadronic multiplicity in events, . It was also reported during this workshop that the effects of Bose-Einstein correlations may increase by –% (see section 2.2).
The shifts in at the hadron level predicted by the models studied thus far are given in table 1, where is defined as the change in mean multiplicity relative to the ‘no reconnection’ scenario of each model. From these, it is clear that the multiplicities themselves and also the magnitude and sign of the predicted shifts are model dependent.
-
model (%) PYTHIA normal 38.64 type I 38.21 0.1 type II 38.39 0.1 HERWIG normal 37.07 reconnected () 37.25 +0.50.1 reconnected () 38.38 +3.50.1 ARIADNE normal 38.14 reconnected 37.07 0.1
In this study, the precision with which such tests may be performed is quantified. As a starting point for such tests, it was first verified that in the absence of reconnection effects in the models PYTHIA and HERWIG. The statistical uncertainty of this test was . Next, samples of HERWIG and PYTHIA events were generated at GeV with a full simulation of the OPAL detector, and realistic event selections were applied for both and ( e, and ). The efficiency in each case was 80%, while the purity is for and for the channel.
The resulting (uncorrected) charged multiplicity distributions for the hadronic and semi-leptonic channels are shown in Figs. 1(a) and 1(b), respectively. The simulated data correspond to an integrated luminosity of 10 pb-1 at GeV, i.e. that delivered by LEP in 1996. In both distributions, the expected background is shown as a hatched histogram. The significant level of background is apparent in the fully hadronic channel.
To extract the mean charged multiplicity at the hadron level at a fixed centre-of-mass energy from such distributions, one can apply a simple correction, based on Monte Carlo, to the observed mean value, after subtracting the expected background contribution. An alternative is to carry out a matrix-based unfolding procedure using the event-by-event correlation between the charged multiplicity at the hadron level and that observed in the detector after all analysis cuts have been performed. A separate correction for the effects of initial state radiation are necessary in this latter case. A third alternative is to integrate the fragmentation function but this is not discussed here.
Based on the the simulated data in Fig. 1(a) and (b), the expected statistical uncertainty on the difference for an integrated luminosity of 10 pb-1 is 2.2 units, or 5.7% on . The evolution of the precision of such difference measurements with more data is estimated using the following assumptions. Firstly, the distributions of and are seen to be relatively insensitive to changes in centre-of-mass energy once away from the threshold region, as illustrated by the energy dependence of in Fig. 1(c). Therefore both the mean and the corresponding rms are assumed constant at their 184 GeV values. Secondly, above GeV the production cross-section is predicted to vary by less than 10% in the region up to GeV, and so a constant cross-section of 16 pb is assumed. Thirdly, it is assumed that the selection efficiency at 171 GeV may be maintained at higher energies. The expected background cross-section is not important as it is subtracted in performing the measurement. Given these assumptions, the dependence of the expected statistical error on the difference, , is shown as a function of integrated luminosity in Fig. 1(d).
Typically in such multiplicity determinations, systematic effects become significant below a statistical precision of 0.5 units of multiplicity. Uncertainty in the modelling of 4-jet like background with parton shower Monte Carlos in the fully hadronic channel may become a significant systematic.
2.1.2 Event shapes
Global event shape variables have been considered in earlier studies as potential signatures for reconnection [5, 7, 11]. In most studies the predicted effects on such observables induced by reconnection has been sufficiently small that detection would be marginal, even with an integrated luminosity of 500 pb-1.
The choice of a ‘no reconnection’ reference sample with which to compare data deserves some thought. In trying to find sensitive observables, using the models alone is ideal. However, once possible signatures have been developed, and one starts to search for effects in data, it will be invaluable to have a well defined ‘no reconnection’ reference sample in data to reduce model and tuning dependence. LEP 1 data provide a high statistics reference, but additional assumptions are necessary in either extrapolating energy scales, or in combining pairs of to emulate events without reconnection. It is also necessary to assume that data recorded and processed by the detectors before 1996 can be directly compared with those recorded near the end of the LEP 2 programme. For some signatures, the ideal reference data are events. However, this sample has only limited size and the comparison may require the association of pairs of jets with Ws in the fully hadronic channel, a procedure which experimentally introduces more uncertainty. In the following, all changes are relative to the ‘no reconnection’ version of each Monte Carlo model and all samples are .
This study compares the differences in the rapidity distribution of charged particles, , relative to the thrust axis of each event, in the central region, and for all , as suggested in [4, 5, 7]. As the effects are expected to be more pronounced for softer particles, the distribution is studied for three momentum ranges, GeV, GeV and all momenta. It has been suggested [7, 11] that reconnection effects may be more pronounced in specific topologies where the quarks from different Ws are close to one another, therefore events are also studied for all thrust values and for . One aspect not considered in previous studies has been the effect of applying a realistic event selection, which is necessary to reduce the large background (). As this is dominated by two-jet like events, the efficiency for selecting events in a similar configuration is relatively small, as illustrated in Fig. 2(a); % of events selected satisfy , falling to % for .
In [11], the rapidity was studied relative to the axis bisecting the two di-jet axes, as a function of the angle separating these axes. Experimentally, without any reliable charge identification algorithm to separate quarks from anti-quarks, the specific angle proposed in [11] must at best be folded in experimental analyses, and also requires pairing of jets into Ws. While the reliability of associating the ‘correct’ jets together is possible with moderate efficiency using kinematic fits, selecting high thrust events was used in the current studies for expediency and simplicity. As the shifts in expected are modest compared to the experimental mass resolution on an event-by-event basis, it is worth considering the use of kinematic fits in which our current knowledge of is applied as a constraint, in a similar way to that used by experimental TGC analyses.
Hadronic events were generated using the models PYTHIA, HERWIG and ARIADNE, with and without a simulation of the OPAL detector, and studied within the ranges of , and described above. A smearing simulation of the OPAL detector, which is reliable for studies in the channel and necessary to achieve the relatively high statistics required, was used herein and also to estimate shifts in .
As an example of how the differences may be concentrated in restricted rapidity intervals, Fig. 2(b) shows the distribution for GeV in ARIADNE, for events with and without reconnection. Changes in charged multiplicity, , within given and intervals are summarised in Fig. 3(a) for each of the models introduced in table 1, without detector simulation. The left (right) hand side of the figure shows the percentage change in for the three momentum ranges considered for all (). The leftmost points in this figure correspond to the results of table 1. Fig. 3(b) gives the analogous results for . For illustration, statistical errors corresponding to an integrated luminosity of 500 pb-1 are given for the ‘HERWIG colour octet’ model.
It is seen that in all models the magnitude of the change increases when only low momentum particles are considered. Applying a thrust cut such as rejects % of events and may change by up to two units, but differences relative to the ‘no reconnection’ scenarios are essentially unchanged, therefore the sensitivity is reduced. The predicted maximum statistical significance of , as well as its sign, depends strongly on the model, varying from for ARIADNE and the HERWIG ‘colour octet’ model, for PYTHIA type I, for PYTHIA type II, down to for HERWIG. The point of maximal sensitivity is indicated (square markers) for each model in the figure. Similar trends were observed in studies with detector simulation but typically was found to be 50% smaller.
It may be possible to increase the sensitivity to reconnection effects using charged multiplicity based methods, by considering particle distributions relative to the decay axis, as reconstructed using kinematic fits. In [6], an alternative multiplicity signature (‘interjet multiplicity’) was introduced, having similar sensitivity to integrating for . This interjet multiplicity was similar in idea to methods normally used to quantify the ‘string effect’ in 3-jet events. It was suggested that this be studied further, using the shape of the particle density distribution as a function of the angular separation between jet pairs, rather than restricting the study to the integrated particle density in the fixed angular regions. However, the 4-jet case is somewhat more complex than the familiar 3-jet case, being non-planar, and so this was not pursued during the workshop.
2.1.3 Shifts in
Extracting from the decay products observed by experiments is non-trivial, requiring much attention to bias induced from effects such as initial state radiation, detector calibration, imperfect modelling of the underlying physics processes and of the apparatus. In comparison to this, estimating a shift which could result from the effects of reconnection phenomena is straightforward, as the value of interest is the relative shift between determined in two different scenarios of the same model. The absolute value of “” obtained is not central to these studies. However, there are still many uncertainties inherent in such studies, such as sensitivity of the method used to extract to changes in , to tuning of the Monte Carlo models (e.g. virtuality cut-offs in the parton shower development), to treatment of combinatorial background and ambiguous jet-jet combinations, and the range over which fitting is performed to name but a few.
In these studies, the method used to extract followed closely that used by OPAL for its preliminary results using 172 GeV data. In this, events with detector simulation are first selected using the same procedure as noted earlier. Four jets are formed using the jet finder, corrected for double counting of energy within the apparatus, and a parametrisation of the errors on the measured jet 4-momenta is carried out. A five-constraint kinematic fit, in which the jet-jet pair masses are constrained to be equal, is performed for each of the three possible jet-jet pairings, event by event. A mass distribution is constructed using the mass from the combination having the highest probability from the kinematic fit in each event if this has probability greater than 1%. A second entry is also admitted if the second most probable fit result has probability greater than 1% and within a factor of three of the highest probability combination. The aim of this is to include additional mass information for events in which the most probable fit combination is incorrect. In such events, these two masses are essentially uncorrelated. A typical mass distribution formed by this procedure is given in Fig. 4.
This method was applied to simulated events from each of the models in turn, and the shifts obtained are summarised in table 2, where uncertainties on these shifts are statistical. The ARIADNE model predicts a modest shift in mass of approximately 50 MeV. No significant shift is predicted by the models PYTHIA and HERWIG. In an earlier study, performed in a similar way, significant shifts were determined [6]. The PYTHIA and ARIADNE models considered in the present study were also included in [6], albeit with different model dependent parameters and looser event selection criteria.
-
(MeV) model selected events (%) all events PYTHIA type I 11 11 type II 11 11 HERWIG reconnected () 16 16 reconnected () 15 14 ARIADNE reconnected 16 15
One quite plausible explanation proposed was that the difference was due to the significantly more stringent event selection currently used. It has been shown that the current selection preferentially rejects events having two-jet like characteristics, which is where reconnection effects may be expected to be prevalent. The rejection of these events does not appear to be the reason for small mass shifts, as a similarly small effect is observed when all events are selected, as seen in table 2.
Many possible sources for the difference were investigated in the context of the PYTHIA models. Neither changes in the tuning of PYTHIA/JETSET by OPAL666Among these, the cut-off parameter, , was increased from 1.0 GeV in the similar investigation of [6], to 1.9 GeV. to improve the description of LEP 1 data, nor the different centre-of-mass energy ( GeV in [6]) were found to be significant. The current analysis procedure is slightly different to that in [6]. However, significant shifts are still found when the current procedure is applied to the same simulated events used in [6]. Conversely, applying the former procedure of [6] to the samples herein does not induce a significantly larger mass shift.
One apparently significant effect was found to be the choice of mass assigned to jets in performing kinematic fits. As discussed in [6], this choice is not unique. In the analysis of [6], the hadronic jets were assumed massless whereas in the current studies, the measured jet mass was used. Re-analysing the same simulated events of [6] but assigning measured masses to the jets reduces the mass shifts estimated, e.g. shifts quoted in [6] of MeV (type I) and MeV (type II) become MeV and MeV, respectively. For comparison, a sample of 200 000 fully hadronic type I events were generated at GeV using identical model parameters and program versions, and analysed using the procedure of [6], also using measured jet masses. This yielded an estimated shift of MeV. It should be noted that fluctuations due to finite Monte Carlo statistics have to be considered when comparing with the results of [6], in which samples sizes for the analogous studies were 50 000 events.
2.1.4 Future
The future for experimental studies of colour reconnection is quite open. There is clear model dependence in signatures and mass shifts may be smaller than earlier proposed [6], although there are other models available [10, 11] which were not tested in this study from which different conclusions may be drawn. A necessary condition for a model to be taken seriously is that it should describe the data, therefore tuning of models has to be addressed. With the current statistical precision of LEP 2 data, none of the models has been put to a stringent test. The effect of background cannot be ignored in the channel as it proves difficult to remove. More sophisticated selections may be developed, but typically these make use of non-trivial correlations between observables, which may be poorly described by the models. A particular concern is the description of parton shower Monte Carlos to describe the hard, 4-jet like background which is selected. The remaining point of note is that given the model dependence inherent to such studies, it is most important to develop signatures which can be tested taking the ‘no reconnection’ scenario from data themselves.
2.2 Bose-Einstein correlations††footnotemark:
††footnotetext: Prepared by V Kartvelishvili, D R WardAs discussed in [2], studies of the influence of Bose-Einstein
correlations on the W mass measurement were carried out for the
CERN LEP 2 workshop [6, tt10], which
suggested that there could be sizeable shifts in the W mass,
.
These studies were based on the LUBOEI algorithm, which shifts
particle momenta after generation of the event, and thus requires
rescaling. In this report of the present workshop,
we outline some more recent results using event
weighting schemes.
2.2.1 Event weighting schemes for Bose-Einstein effects
The Bose-Einstein effect corresponds to an enhancement in the production probability for identical bosons to be emitted with small relative momenta, as compared to non-identical particles under otherwise similar conditions. Assuming a spherical space-time distribution of the particle source, the correlation function takes the form:
| (1) |
where is the four-momentum difference, , and is the absolute square of the Fourier transform of the particle emitting source density, with the normalization condition . The incoherence parameter takes into account the fact that, for various reasons, the strength of the correlations can be reduced.
Often a Gaussian model is assumed for the source density, which leads to
| (2) |
where is the source radius.
In [13] the problem of Bose-Einstein correlations was addressed using an approach based on assigning weights to the simulated events according to the momentum distributions of final state bosons. In this global event weight scheme a shift in the reconstructed W mass distribution may arise if the average event weight depends on . The use of global event weights is complementary to the local reweighting scheme of ref. [tt10] in the sense that as opposed to the latter, in the former the kinematical properties of the events are preserved, while all probabilities and multiplicities may change. The method arises very naturally in a quantum mechanical approach, where the weight can be constructed as the ratio of the square of the symmetrized multiparticle amplitude to the square of the non-symmetrized amplitude corresponding to the emission of distinguishable particles. However, the use of global event weights leads to a number of conceptual and computational difficulties, which must be overcome before any quantitative conclusions can be drawn.
One way of forming the weight is to take a product of enhancements for all pairs of identical bosons in the event:
| (3) |
For high multiplicity events this weight can become extremely large, so that a few such events dominate the weighted distributions and lead to unrealistic results. The event weights therefore have to be regularized in some way. In order to keep the statistical error at a reasonably low level, events with very high weights (higher than some ) were discarded. The resulting dependence upon was analysed and the results were extrapolated to .
One can also rescale the weight of the event using a single constant :
| (4) |
where is slightly larger than 1, and is the number of pairs in the event (i.e. the number of terms in the product in (3)). However, for fixed and reasonable values of the scheme gave rise to numerical difficulties, stemming from the fact that increasing brings in more and more events from the high weight tail of , which leads to large fluctuations. The results for the shifts in multiplicity and using were roughly consistent with those found for .
A general problem with any weighting method is, that like the local reweighting scheme of ref [tt10], they introduce artificial correlations also between non-identical particles. In order to counteract this, one can rescale using the weight calculated with non-identical pairs:
| (5) |
where is the weight calculated according to (3) but for non-identical bosons in the same event, while and are the numbers of identical and non-identical pairs, respectively. This also leads to a better numerical behaviour, as illustrated in Fig. 5, which shows the distributions of and for simulated events at GeV. The high weight tail is much less pronounced for than for . Both fall off to a good approximation as inverse powers, with exponents and , respectively, which makes it plausible that the sum of all weights converges.
A different method of constructing the event weight, which is closer to a full quantum mechanical treatment, starts from the introduction of a symmetric amplitude, which has terms [14]. This leads to a weight:
| (6) |
where is the number of times when the first and second indices differ. For , and identical particles, equ. (3) gives a weight of , while equ. (6) results in the correct value . However, for typical hadronic configurations this difference is much smaller, and (6) is rarely used because of computational difficulties: by limiting the number of identical particles of each type to 8, one loses about 30% of events at the Z peak and about 50% of events in W pair production.
In a recent attempt to overcome these difficulties, in [15],
the permutations in (6) were divided into sub-classes where
exactly particles have been exchanged, and for low
energy hadronic collisions ( GeV)
BE effects were shown to saturate already at .
However, possible reasons for this improvement are that the
multiplicities in hadronic collisions in the above energy range are
much lower than at LEP, and that the source
radius used in [15] was fm as opposed to 0.5 fm measured
at the Z peak at LEP 1 and used in [13]. The larger radius
corresponds to
a narrower distribution in -space, so that the peak in
the -distribution of pions does not contribute any longer
and the number of significantly contributing pairs is dramatically reduced.
A subroutine LWBOEI for calculating event weights using this approach
can be incorporated into JETSET/PYTHIA, but it is not clear yet
how well this approach works for collisions at LEP energies.
Similarly, another simplified version of (6) was studied in [jada] to assess BE effects on W mass measurements at LEP. Here, particles were divided into “clusters” of neighbours in -space, and simple formulae were derived from (6) under certain assumptions (see [biaj] for details). Detector effects and reconstruction procedures have also been included. The authors of [jada] also use the source radius of 1 fm, and do not see any W mass shift due to BE correlations at the level of their statistical precision, concluding that BE effect has a negligible influence, below 30 MeV, on the reconstruction of W mass.
All event weights considered above were based on the Gaussian parametrization (2) of the particle emitting source. This implies that for all values of . In addition to the above weights, a different pair weight was also studied in [13], inspired by recent theoretical studies [bo]. Here in (1) is not required to be always positive:
| (7) |
For close to 1, this is very close to (2) apart from becoming slightly negative at large . The corresponding weight was built in analogy with (3), but with the Gaussian (2) replaced by (7) (the dotted line in Fig. 5). was found to lead to a good overall description. Due to the better numerical behaviour of this weight function (the exponent in the power fit is ), it was possible to apply without further rescaling.
2.2.2 Influence of event weighting on properties
In order to check the self-consistency and inherent systematic errors of the method the same weighting procedure was applied to the well studied process of Z hadronic decays. For weight calculation, was used for pions and kaons originating from sources with decay lengths fm, and otherwise. The source radius was taken to be equal to 0.5 fm everywhere. In Z decays at LEP 1 one observes if all particles are considered, 0.4 if only pions are taken into account and 1.0 for directly produced pions, while fm [alephBE, delphiBE].
Various measurable properties of the Z will be affected to different extents, if one introduces event weights into the simulation of its hadronic decays. Since the partonic states before hadronization are known to be well described by perturbative calculations, which do not take into account Bose-Einstein correlations, uncritical application of event weights may lead to large inconsistencies with e.g. measured branching ratios and relative frequencies of jet multiplicities etc. In order to see how serious these effects are and to judge what consequences this has for the analysis of the events, the precise experimental data from Z decays can be used to check the event weighting schemes of Bose-Einstein correlations. Samples of 100000 hadronic events at and GeV were simulated and the weighting schemes described above were applied. Table 3 presents the changes in the charged particle multiplicity, in the apparent Z peak position in hadronic vs leptonic decay modes, in the branching fractions for charm and beauty decays ( and ) and in the ratio of three- to two-jet events with and without event weighting.
-
, MeV % % 3jet/2jet, %
This analysis resulted in the following:
-
The average charged multiplicity has changed. The weight , which was not rescaled, leads to the largest increase when compared to the unweighted results, while both and give a smaller increase around 1.5. In all these cases, the change can be accommodated by retuning the parameters in the simulating program.
-
In principle, event weighting can result in a shift of the apparent Z mass peak. However, only yielded a shift of a few MeV, while for and the shift is essentially zero. We have not found any significant change of the apparent Z width.
-
The pattern of heavy and light quark fragmentation is rather different. Heavy quarks produce significantly fewer pairs with small , and all BE effects in this approach are less pronounced for heavy quarks. Heavy quark events thus obtain smaller average weights, which result in changes shown in Table 3. Note that the effect for -quarks is diluted because -quark events reduce the overall average weight. In order to exclude this artificial flavour dependence in W decays, the weighting and rescaling was performed separately for the different decay modes of the Ws.
-
The weighting resulted in a substantial increase of jet activity, as measured by the three to two jet event ratio. This is however difficult to quantify because of its dependence upon the jet finding algorithm and its parameters. The numbers shown in Table 3 were obtained using
LUCLUSwith default parameters ( GeV), corresponding to fairly narrow jets. The effect decreases for broader jets and in any case is much less pronounced in production, so no attempt was made to correct for it.
The reproduced correlation functions for the three weighting schemes, , and are shown in Fig. 6. Also shown are fits to the form
| (8) |
which is often used to parametrize the experimentally observed correlation function in Z decays [alephBE, delphiBE]. The dashed line in each figure represents the result of a fit to the correlation function of all particles observed in real data from hadronic Z decays [delphiBE].
does not reproduce the correlation function well, giving too small values for both the incoherence parameter and the radius , while and both give very reasonable descriptions.
Hence one concludes that, provided that the different quark final states (and possibly the final states with different number of jets) are treated separately, application of the global event weighting technique with rescaling of the weight , or built using the pair weight (7) is not inconsistent with LEP 1 data at the Z, whereas the direct application of the product of Gaussian pair weights should be treated with more care.
2.2.3 W pair production
PYTHIA 5.7 [tt11] was used to simulate the process , and the weighting schemes described above were applied to simulate BE correlations. A basic assumption here is that hadronic W and Z boson decays are sufficiently similar, so that by using the tuning of the Monte-Carlo model parameters that reproduces the experimental data from Z decays at LEP, Bose-Einstein effects in single W decays are already effectively taken into account in properties such as multiplicities and single particle momentum spectra. Only correlations between identical bosons originating from different Ws were included, since BE correlations within a single W cannot lead to any change in the W mass compared to the semileptonic channel . Measurement effects like experimental resolution and acceptance, reconstruction method etc. were not taken into account.
The information from the Monte-Carlo was used to assign each final particle to the W+ or the W-, as in [tt10]. Ws with mass values in the interval GeV were studied at 175 and 192 GeV to assess the energy dependence. At each energy, events were generated, which is about an order of magnitude higher than the expected statistics of all four LEP experiments combined at 500 pb-1 integrated luminosity per experiment. In general, one expects that BE-induced effects in production should die out at high energies, as the overlap between the two W decay volumes decreases. This requires much higher energies than will become available at LEP 2, however, and it is likely that the effect will increase with energy in the LEP 2 range [tt10].
The mass distribution of W bosons was built with and without event weighting for each of the weights used, and the differences were calculated in the average charged multiplicity , the mean W mass, , averaged over the whole interval GeV, and a fitted . The fit was performed using a relativistic Breit-Wigner shape with an -dependent width, in the interval GeV, with GeV. The results are presented in Table 4.
As mentioned above, for computational reasons, events with very large weights have been discarded. The dependence on the cutoff value, , was eliminated by calculating the multiplicity and mass shifts for three values of (20, 40 and 80) and then extrapolating to infinite cutoff. This method seems to be more reliable and less vulnerable to fluctuations than direct calculation with very high . Fig. 7 shows the values of the mean W mass, , and the fitted as functions of . For , the extrapolated value depended on the specific way the extrapolation was performed, and this ambiguity was added to the error shown in Table 4.
-
175 GeV 192 GeV (MeV) 175 GeV 192 GeV (MeV) 175 GeV 192 GeV
From these numbers one can draw the following conclusions:
-
There is a clear correlation between the BE-induced shifts in the W mass and in the charged particle multiplicity in production: the larger the increase in charged multiplicity, the larger are the expected mass shifts.
-
Both and weights result in fairly small mass shifts. They are well-behaved numerically and probably give quite reliable estimates of the effect. The spread of values using various weighting schemes can be considered as indicative of the systematic errors inherent to this approach.
-
The fitted value for the W mass is less sensitive to BE effects than the mean over the full distribution, which has been used to estimate the effect in previous investigations [tt10]. The estimated values for the shift in the fitted mass are less than 20 MeV, implying that BE correlations are not too dangerous for the W mass measurements at the expected level of accuracy at LEP 2. For the shifts in the mean W mass, values of order of a few tens of MeV were found, of the same general magnitude as in [tt10]. In all cases the shift is towards larger masses, as expected on general grounds [6, tt10].
-
For all weighting schemes, the shift in increases with energy in the energy range considered, but the increase is fairly small.
It is interesting to compare these results to the predictions based on the implementation of Bose-Einstein effects by shifting the momenta of final state particles [tt10]. The most important difference is in the particle multiplicity: event weighting naturally leads to an increase of the average number of particles due to Bose-Einstein correlations, while the momentum-shifting method assumes that the multiplicity is unchanged. The energy dependence of W mass shift is also different. The strong energy dependence in momentum-shifting scheme is a combination of two effects: the increase of the systematic shift for low momentum particles in the direction of smaller W momenta, and the differences in momentum spectra of W decay products for various energies, as stressed in [tt10]. This seems to be less pronounced in the present approach.
The study [13] confirms that the systematic effect of BE correlations on the W mass determination can potentially be quite large, as found in [tt10], although the actual values of the mass shift found here are somewhat smaller. The size of the shift is however quite sensitive to the procedure used to extract the value of the W mass. In particular it is observed that a fit to the lineshape of the W mass distribution has a much smaller systematic error from Bose-Einstein correlations than the average mass, due to the fact that the main effect on in our scheme arises from the tails of the mass distribution, which contain very little information about the peak position. Hence it seems possible to keep the systematic error from this source below about 20 MeV. Careful work linked to the actual event selection and fitting procedures used by the LEP experiments is obviously needed in order to assess this in the individual cases and to optimize the analysis procedures. Since the value of the mass shift is always positive (as also expected on general grounds), a further reduction of the systematic error by a factor two is in principle possible by assigning the expected shift as a correction to .
The comparison between hadronic decays in the and channels gives a unique possibility to investigate the influence of Bose-Einstein correlations on various properties of final state particles, such as multiplicity, transverse and longitudinal momentum spectra, resonance properties and reconstructed jet characteristics. It is possible, that by taking proper care in the fitting procedures used, one may at the same time be able to use a large part of the hadronic events for the W mass determination, and to study the interconnection effects in the relatively clean setting of events, by restricting the study to the region of large, off-peak W masses where these effects are expected to be the largest.
2.3 Four-jet events††footnotemark:
††footnotetext: Prepared by R Jones, S Moretti and W J StirlingThe QCD processes form significant backgrounds () to jet production at LEP 2. It is important, both for the threshold and direct reconstruction measurements, that these backgrounds are well under control. In particular, the QCD Monte Carlos (MCs) used in the analyses should correctly describe the relevant features (for example, the overall rate and the kinematic distributions) of the four-jet final states which pass the selection criteria.
In this connection it is worrying that certain aspects of four-jet production are not well described by the standard ‘parton-shower (PS) ’ MCs (JETSET, HERWIG, …). As discussed by G Cowan at this Workshop ([3], in particular Fig. 9, see also [16]), four-jet studies performed by the ALEPH collaboration at LEP 1 reveal significant disagreement between data and MCs for distributions in the standard four-jet shape variables , , and (for definitions, see for example Ref. [16]). This suggests that the MCs do not provide a correct description of the angular correlations between the quark and gluon jets. On the other hand, matrix element models (e.g. the JETSET model) give a much better description of four-jet final states [3]. The problem here is that matrix element models with ‘added-on’ hadronisation cannot be reliably extrapolated from LEP 1 to LEP 2 energies – the hadronisation tuning is only valid at the lower energy. (It was reported at the Workshop that ALEPH have a special ‘’ version of HERWIG , but this is so far not publicly available.)
Two studies directly addressed this problem at the Workshop. The first investigated whether QCD events which pass the event selection do in fact populate the ranges of the four-jet angular variables where the MCs are known to have problems describing the LEP 1 data. Fig. 8 shows simulations of QCD and events at 172 GeV binned according to the four angular variables listed above. Two event selections have been used, giving similar results. The first, used for the workshop itself, was a linear discriminant constructed by ALEPH and designed for selection of totally hadronic decays of pairs at 161 and 172 GeV. Subsequently, this has been replaced by a more generic cuts-based selection; by energy-scaling the appropriate cuts, this has also been run on JETSET PS Monte Carlo and real data at the Z0 peak, and the discrepancies observed by ALEPH are seen to persist. The problem regions can be roughly characterised as follows:
| (9) |
The plots shown in Fig. 8 correspond to generic cuts: the QCD predictions are taken from PYTHIA and the predictions are obtained from KORALW at 172 GeV. It is clear that both the selected events and the predicted QCD background do populate the regions of concern. For example, approximately half the QCD events have , a region where the PS MCs overestimate the LEP 1 data by up to 15% [3].
The second study attempted to address the question of the origin of the disagreement between the PS MC and matrix element predictions for the angular variable distributions. Perturbative QCD predicts very specific angular correlations between the four final-state partons in (see for example Ref. [17]). These correlations are naturally included in a full matrix element calculation, but are not necessarily included in a PS emulation of the four-jet final state.

To illustrate these correlations, we show in Fig. 9 the distributions in (at LEP 1, using the Durham algorithm to define the four-jet sample) calculated for the QCD (solid histogram, exact matrix element) and (dotted histogram, triple-gluon vertex graphs) processes. The former peaks around , indicating the preference for the plane of the two secondary quark jets to be orthogonal to the plane of the two primary quarks. In contrast, the two secondary gluons prefer to be produced in the plane of the primary pair. Now at LEP 1 the contribution dominates the total four-jet rate and so the distribution is sharply peaked at 1. The maximum deviation between the data and the JETSET MC occurs for , which is precisely the region where the contribution is maximal. It is possible, therefore, that the MC does not correctly include the angular correlations. To study this further, we can construct a toy matrix element PS-like calculation in which the correlations are switched off for the final state, i.e. the secondary splitting is azimuthally symmetric about the gluon direction. The corresponding distribution is shown as the dashed histogram in Fig. 9. The distribution is significantly flatter, as expected. Also shown in the figure (dot-dashed histogram) is the prediction of a decorrelated version of the matrix element (again only including the triple-gluon-vertex diagrams). Since evidently the MC gives a good description of the LEP 1 data for [3] we may conclude that the correlations are correctly implemented. (This is not perhaps surprising, since the ‘abelianized’ predictions do not differ markedly from the QCD predictions [18].) Fig. 10 shows the ratio
| (10) |
as a function of (solid line). The prediction has the same qualitative features as the data/MC ratio of the ALEPH analysis [3]. This suggests that the lack of correct angular correlations in the part of the PS MCs is at least partly responsible for the disagreement with the LEP 1 four-jet data. However the difference between data and MC seen by ALEPH is quantitatively larger than the ratio shown in Fig. 10 [3, 16]. In fact it appears to be similar in magnitude to what would be obtained by either switching off the contribution entirely (dashed line in Fig. 10) or giving it the same dependence as the contribution (dotted line). Further details of this study will be presented elsewhere [19].

3 Experimental issues in the measurement of
In this section various aspects of the experimental techniques and problems in the determination of are discussed. For the 1996 LEP data two methods were used. These are the measurement of the cross-section near threshold ( 161.3GeV) and the direct reconstruction technique for data at 172GeV. These two methods are considered in turn. The list of topics addressed at the workshop is by no means comprehensive.
3.1 Threshold method††footnotemark:
††footnotetext: Prepared by C J Parkes, P B Renton and M F WatsonThe main issue addressed during the workshop was the influence of interference between production and other four-fermion final states. This is discussed in sections 3.1.1–3.1.3. In section 3.1.4 the dominant systematic uncertainty resulting from QCD background, is reviewed.
3.1.1 Introduction
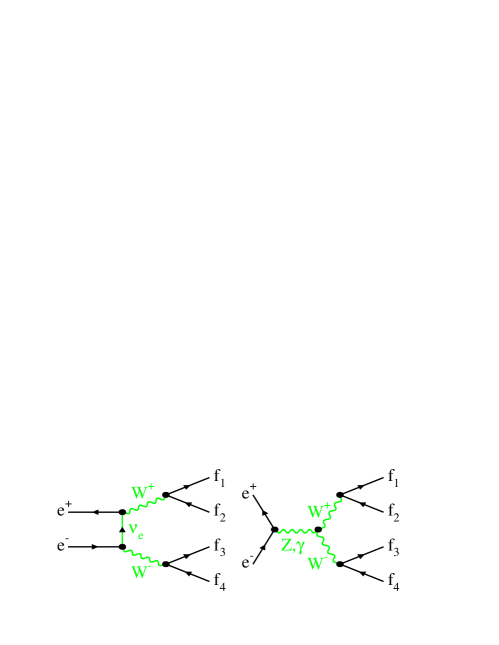
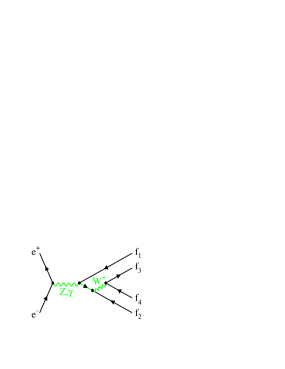
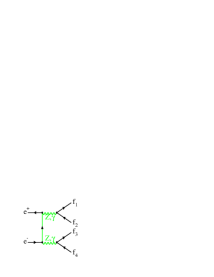
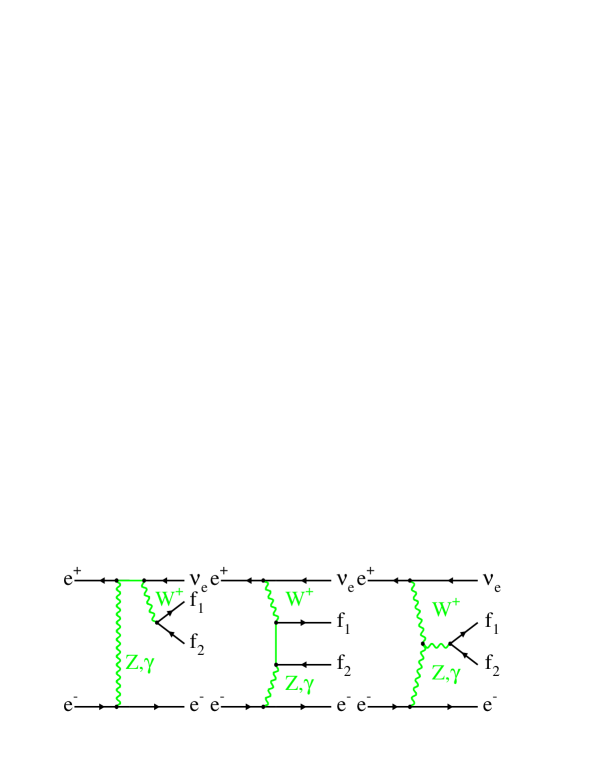
The measurement of the cross-section at LEP is the measurement of the cross-section for the process : . This involves the production of two resonant W bosons (via the so-called “CC03 diagrams” – see Fig. 11). However, identical final states can be produced through different intermediate states: singly resonant W production (Fig. 12(a)), neutral current diagrams (Fig. 12(b)) and diagrams containing -channel W boson exchange (Fig. 13), can all contribute (see [6]). Note that the set of diagrams contributing to the muon semi-leptonic final state and the tau semi-leptonic channel are identical. These extra diagrams contribute not only as a background but, as the final state is identical to that obtained through the CC03 diagrams, there is also interference between these processes: one must sum the matrix element amplitudes, not just consider the squares of the amplitudes.
 |
 |
| (a) | (b) |
The WW analyses are aimed at selecting events of the type resulting from the CC03 diagrams; hence the LEP experiments generally choose to interpret their results in terms of the CC03 cross-section, rather than the full four-fermion cross-section. A further significant disadvantage in interpreting the results in terms of the full four-fermion cross-section is that this quantity is divergent in several of the Monte-Carlo generators used by the analyses (due to their massless fermion treatment). Although the CC03 cross-section is not strictly a gauge invariant quantity (see [20]), in practice it is well-defined and allows comparison between the measurements made by the experiments. Clearly, only the doubly resonant CC03 subset of diagrams have a production cross-section sensitive to the W mass around the threshold energy. Hence, one does not lose sensitivity in obtaining the W mass from the CC03 cross-section, rather than from a four-fermion treatment.
In this section the methods adopted by the four LEP experiments to compensate for the interference effects are considered, and a quantitative comparison of their results is attempted.
3.1.2 Correction method
All the experiments used four-fermion generators to produce simulation samples for the set of all diagrams and the CC03 subset. These cross-sections are defined as and respectively and are used to make a correction from the measured (four-fermion) cross-section to the CC03 cross-section. In addition DELPHI have used samples for the non-CC03 four-fermion diagrams (). The selected cross-sections after experimental cuts are denoted by , where is the efficiency. The following methods were used by the four LEP experiments in their 161GeV cross-section papers [21, 22, 23, 12], where details of the procedures used can be found. The aim of all these procedures is to obtain the CC03 cross-section. Here we give the form of the correction term applied by each experiment: i.e. the term which contains the interference effect, as assessed from Monte-Carlo simulation.
ALEPH and OPAL applied additive corrections to the measured cross-section. The background from all four-fermion processes is defined to be , and has to be subtracted from the observed cross-section.444The corrections quoted by ALEPH have been divided by the the CC03 selection efficiency to produce a total, rather than a visible, correction cross-section. The background includes a ‘virtual’ contribution due to the interference between identical final states; in the channel the interference is large and negative, so the ultimate sign of the correction could be either positive or negative: in fact in this case the effective background cross-section is negative.
DELPHI and L3 applied multiplicative correction factors. For DELPHI this is simply the ratio of the result that is obtained when neglecting the interference between diagrams to the desired CC03 final result, i.e. . For L3 the correction factor includes the total contribution of the four-fermion diagrams and is defined as .
3.1.3 Correction results
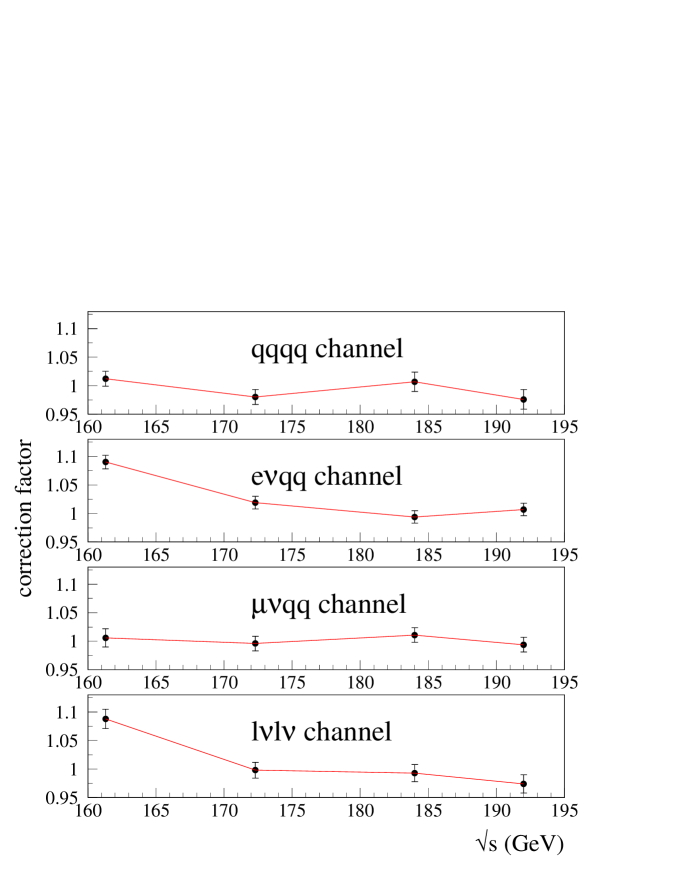
The DELPHI correction factors, as a function of , are given in Fig. 14. It can be seen that in the and decay channels no significant effects are observed; whereas there are significant effects in the and channels near threshold. The results were found to remain stable within the statistical errors over a wide range of different event selections. Thus at 161GeV DELPHI finds strong negative interference in the and channels which corresponds to a shift of about 30MeV in the W mass.
A quantitative comparison of the four-fermion corrections applied by the four experiments is complex due to the differences in procedure. Using information from refs [21, 22, 23, 12], and other details made available during the workshop, an attempt is made to put the results of the other experiments in a form similar to the published ALEPH numbers. For the results presented in Table 5 the OPAL and DELPHI values have therefore been scaled by the inverse of the selection efficiency . There was not sufficient information available to transform the L3 result to this form. The DELPHI and OPAL numbers include only the four-fermion backgrounds to the same final state as is under study, whereas the ALEPH number includes in the correction all four-fermion final states. Whereas the other experiments choose to include the background from a Z and radiated gluons in their two fermion production, the ALEPH numbers include this in the four-fermion correction: this explains the large discrepancy seen in the fully hadronic decay channel. Although the DELPHI results show the interference effects to be relatively insensitive to the event selection, when one adds in the full four-fermion backgrounds this will no longer be true. Hence the results quoted in Table 5 will also be sensitive to the analysis cuts.
In general, satisfactory agreement is obtained between the experiments. However, there could be a possible difference in the results of the two four-fermion generators used by OPAL . It is hoped that this study will stimulate further co-operation between the experiments on this matter.
| Experiment | Generator | Decay Channel Correction (fb) | ||||
|---|---|---|---|---|---|---|
| ALEPH | KORALW | +140 | 15 | +14 | ||
| DELPHI | EXCALIBUR | +4021 | 7 | 7 | 15 | +111 |
| OPAL | grc4f | +5634 | +617 | 18 | 32 | 18 |
| EXCALIBUR | +2823 | +1811 | 12 | 21 | 10 | |
3.1.4 Systematics
The four experiments agree on the source of the dominant systematic error on the WW cross-section: the precision of the simulation of the hadronic decay events. QCD at LEP 2 is considered elsewhere in this report ([3] and section 2.3; here the techniques used to assess this dominant systematic uncertainty are reviewed.
The background systematics were assessed by the experiments from a comparison of events produced by different generators/fragmentation packages; for example OPAL compared events produced using the JETSET, HERWIG and ARIADNE models. Simulated events were then compared with data, both at 161GeV, and because of the limited statistics available, with data taken at other energies: for example DELPHI rescaled its selection cuts and compared data and simulation at 130-136GeV and at 91GeV. The errors ascribed by the experiments are given in Table 6. The values of the errors assigned are reasonably compatible. The L3 value of this error cannot be compared directly to the others, but it would appear to be compatible.
-
Experiment Error ALEPH 5 on background cross-section (data/simulation comparison) 6.5 on background cross-section (different generators) DELPHI 10 on background cross-section OPAL 11.3 on background cross-section L3 4 on total cross-section
3.2 Direct reconstruction
A number of topics were discussed at the workshop, and are reviewed below. In sections 3.2.1–3.2.3 various aspects of kinematic fitting and mass estimation and their impact in the W mass resolution are discussed. In sections 3.2.4–3.2.5 we describe some of the possible biases on which can occur. Then, in sections 3.2.6–3.2.8 the question of four-fermion interference effects is discussed.
3.2.1 Kinematic fit methods††footnotemark:
††footnotetext: Prepared by P B RentonThe resolution on the jet-jet mass is too poor to make a precision measurement of . Fortunately, several methods are available to improve the resolution. The methods adopted are either scaling techniques, in which the energy of the hadronic decay products of the Ws are rescaled to the beam energy, or constrained kinematic fitting techniques, in which overall energy-momentum conservation is imposed. These techniques rely essentially on the fact that the jet angles are measured with good precision, but the jet energies much less so. Both methods result in a considerable improvement in the jet energy resolution.
In the absence of additional jets from QCD processes, the events WW give rise to a four-jet topology. The effect of extra jets is discussed below. If no additional constraints are imposed, then the fit for (where j signifies a jet) is a 4-constraint (4-C) fit. The four fitted jets are combined into two jet-pairs, corresponding to the two W bosons in the event, and this results in two estimates of per event. Three possible choices are possible for this pairing. The two measured masses from the 4-C fit are highly anti-correlated, and can then be combined into a single average mass using the error matrix from the fit. A second option is to use a 5-C kinematic fit in which the two fitted masses for the chosen jet-pairing are required to be equal. This is somewhat unphysical, since the masses of the two W’s will not, in general, be equal, but it is found that this procedure gives a good mass resolution. It is thus of interest to understand which of these choices gives the better final precision.
In the analysis procedures the event is often first forced into a 4-jet topology. However, in many events there are additional jets due to gluon radiation. Treating all events as 4-jet events will result in some loss of precision on . In the preliminary DELPHI analysis events with 5 jets are also allowed. However, the pairing problem becomes even more severe, with ten possible combinations.
The experiments have adopted different methods to tackle the pairing problem in the fully hadronic channel discussed above. ALEPH use a combination of the values from two different kinematic fits; a 5-C fit () and a fit in which both masses were compared to a reference mass (). Using the combination + 2, Monte Carlo studies show that the correct solution is chosen in 79% of the cases.
In the DELPHI analysis all the solutions are retained and used to create an ideogram probability distribution as a function of . Each solution has a Gaussian distribution, with a width equal to the corresponding 5-C fit error on the mass. The relative normalization of the solutions depends on the significance of the mass difference in the corresponding 4-C fit. Each event is assigned a purity on the basis of the value of the quantity , where is the minimum jet energy and the minimum jet opening angle. This quantity is chosen as it has a rather different shape for the WW signal events and the Z/ 4-jet background events. The background in the event is , and contains no information on . The most favoured of the three solutions is normalized to . For each solution a likelihood distribution, as a function of , is obtained by convolving a relativistic Breit-Wigner with a Gaussian distribution for the solution in question, with a width obtained from the fitted error for that solution. The likelihood distribution for the event is the sum of these distributions, normalized as described above. For the events classified as 5-jets, all 10 combinations are considered in this way. The probability distributions for each event are then multiplied together to give an overall likelihood from which the best estimate of and its error are obtained.
In the OPAL analysis the 5-C fit with the best probability is used. This is estimated to contain 68% of the correct parings. In addition, in certain cases, the fit with the second best is also used. This is estimated to contain 25% of the correct parings. The statistical problem of retaining more than one solution per event must then of course be handled.
The analysis of the semi-leptonic channel is considerably simpler than that of the fully hadronic channel. The hadronic decay products are usually forced to form two jets. For the e,) channel there is an undetected neutrino, so if no additional constraints are imposed then the fit is a 1-C fit. Imposing equal masses for the leptonic and hadronic decay products thus gives a 2-C fit. For the there are one or more additional undetected neutrinos, so that the lepton energy is poorly known, but the decay products can be used as an estimate of the direction. A rescaling technique can be applied to the fit results, or directly to the measured jet parameters. However, the final resolution on is worse in this channel than for e or .
The main difference between the experiments in their preliminary analyses of the e,) channel is whether the individual event errors from the 2-C fit are used. These are used by DELPHI, but not so far by ALEPH and OPAL. A significant difference between the and channels is that the missing neutrino leads to marked differences in the event topology, and resultant kinematic precision, depending on its momentum.
There is also a variation in the extracted precision coming from the choice of function used to fit the mass distribution. A study using DELPHI Monte Carlo data [24] has been carried out for the and channels and some of the results are shown in Table 7. In each case about 90 samples of Monte Carlo events, each corresponding to about 10pb-1, were analysed. From the distribution of the fitted errors the mean and rms are determined. It can be seen that the use of the event by event errors gives an improvement of 15% in the mean error. The rms spread is also improved.
-
method mean rms single Gaussian 0.598 0.197 single Breit-Wigner 0.595 0.215 BW*Gaussian, free 0.610 0.212 BW*Gaussian, event errors 0.503 0.088
3.2.2 ALEPH rescaling technique††footnotemark:
††footnotetext: Prepared by J C ThompsonPreliminary measurements of the W-boson mass from direct reconstruction have been made for the 1997 Winter Conferences by all experiments, and are discussed elsewhere in these proceedings [1]. All experiments employed a kinematic fit to reconstruct the event invariant masses. For the preliminary mass measurements using the 172GeV data, DELPHI, L3 and OPAL use 5-C kinematic fits to reconstruct the fully hadronic final state. The ALEPH Collaboration employs the kinematic fit in a somewhat different way (referred to here as 4C + Rescaling), and this is outlined in this section.
In the ALEPH analysis of hadronic events from the 172GeV data, events are forced into a 4 jet topology, using the DURHAM P scheme, and a 4-C kinematic fit is applied to the energy and direction of each jet constraining the total observed energy to be 2 (i.e. ignoring initial state radiation (ISR)). ALEPH Monte Carlo studies have shown that, on average, a 4-C fit reproduces the true jet energies more accurately than a 5-C fit with equal W masses. Then, to each of the three possible combinations of jet-jet pairs, the invariant masses, , are rescaled to obtain a more precise dijet mass. The rescaled mass for jet-jet pair (1+2) is defined to be:
| (11) |
and similarly for the other pair. The symbols and refer to the energy and momentum of the pair respectively. Errors coming from the loss of particles, or bad measurement of their momenta, are largely cancelled in the ratio ; i.e. the W velocities are being used to obtain a reduction of the errors. A simple application of 2-body kinematics gives:
| (12) |
demonstrating that the rescaled masses are not improved estimates of their respective measured masses, but are now inter-related. It can be shown that the correlation is a function of the two true W masses in the event, anti-correlated by their measurement errors which are likely to be sensitively related to any cuts applied to the two measured di-jet mass distributions.
A sample of sixty events is selected in the data and the best combination of jet-jet pairs, found as discussed above, is retained. The two separate rescaled jet-jet mass distributions are formed and each is fitted to a simple relativistic Breit-Wigner (BW), from which , and their respective widths are extracted. is obtained by averaging the two extracted masses taking into account the correlation expected from the Monte Carlo ( = +0.320.10).
Since the data sample is small, the statistical error is taken from the rms spread of the BW fitted masses, , obtained from 75 Monte Carlo samples each corresponding to 10.6 pb-1, where the input mass was 80.5GeV. This gives:
| rms | rms | rms | rms |
|---|---|---|---|
| 463MeV | 483MeV | 420MeV | 506MeV |
where is the average of and , taking into account their correlation. Thus the 4C + Rescaling procedure produces a smaller rms by 17% than the 5C fit. The corresponding average fit errors in the 4C + Rescaling and 5C analyses from the Monte Carlo samples are 320MeV and 350MeV respectively. The final calibration procedure increases these rms-based errors slightly: the corrected error for the 4C + Rescaling case is 450MeV, which is still smaller than the 5C uncorrected fit result.
3.2.3 Further investigation of the rescaling technique††footnotemark:
††footnotetext: Prepared by M ThomsonThe ALEPH rescaling method has been applied to OPAL Monte Carlo data. Three samples with different input W masses were considered, 78.33GeV, 80.33GeV and 82.33GeV. Each was generated at a centre-of-mass energy of 171GeV. Samples with different masses were considered in order to investigate any possible phase-space effects.
Three different fits to selected fully hadronic final states were considered, a 4-C fit where the average mass was used, a 5-C fit, and the ALEPH rescaling method described above. In each case the jet-pairings which most closely matched the parton level W pairings were used. No background was included. One thousand samples of 100 fully simulated events were considered. The rms of the values for obtained from the different methods were taken as estimates of the error on the fitted mass. The correlation coefficient between the two masses from the rescaling method was found to be 0.45. Calibration curves relating the measured to fitted mass were determined (separately for each fit) from the three different Monte Carlo samples, assuming a linear relation. The errors on the fitted masses were then scaled appropriately using the calibration curve to give the error on the measured W mass. Table 8 shows the errors on for the different methods and for the different Monte Carlo samples.
-
type of fit = 78.33GeV = 80.33GeV = 82.33GeV 4-C 369 396 447 5-C 354 370 339 rescaled 362 378 339
For the OPAL Monte Carlo samples, the rescaled method performs almost as well as the 5-C fit. No improvement of 20% in the resolution is obtained. It is interesting to note that when phase space effects are less important (i.e for the =78.33 sample) the performances of three different kinematic fits are very similar.
In summary, the preliminary ALEPH measurement of from the 172GeV data used 4-C kinematic fitted masses rescaled to the beam energy. The OPAL study does not confirm the ALEPH finding that there is an improvement of 20% in this rescaling technique compared to the 5-C fit method444A similar study by C Parkes, performed after the workshop using the DELPHI Monte Carlo data, reached similar conclusions..
3.2.4 Systematic shifts on the W mass obtained by direct reconstruction††footnotemark:
††footnotetext: Prepared by J J Ward, A Moutoussi and R EdgecockThe measurement of the W mass by kinematic reconstruction of the invariant mass of the W decay products requires several steps. Each of these may be conceptually well defined, but requires some operational definition, an estimator, for which there could be various options. The choice is motivated mainly by achieving high signal efficiency and the best resolution for the reconstructed mass. However these estimators may be biased, introducing mass shifts which have to be evaluated and corrected for using Monte Carlo events. Such corrections can introduce model dependences and systematic errors. Various sources of mass shifts are discussed below and the results are summarised in Table 9. These studies are carried out using the ALEPH selection and analysis procedures.
The first step in an analysis of is the event selection. events can be selected using a multivariate analysis (e.g. a Neural Network) which gives the highest signal to background discrimination. An upper limit for of 80MeV was calculated, for a given selection procedure, as the difference of the reconstructed mass obtained using the ‘standard’ cut on the selection variable, from the reconstructed mass obtained applying no such cut. In addition a ‘standard’ reconstruction analysis was applied to Monte Carlo events with and without ISR. The difference in the results obtained for the two cases was MeV.
Jet clustering can be performed using different particle association criteria and combination schemes, e.g the Jade or the Durham algorithm and massive () or massless () schemes respectively. All types of algorithms introduce mass shifts. Different association algorithms introduce similar shifts, but the different combination schemes produce substantially different results. The value of quoted here is the difference between the results obtained using a or an scheme. type schemes associate a larger fraction of particles to the correct jet, hence also better reproducing the parent-quark direction and energy. schemes, which assign masses to the particles, give, on average, shifts from the parent parton values in energies and angles which are larger than for the schemes.
The next step of the analysis is forming di-jet pairs. The pairing can be performed using information related to the di-jet mass itself; such methods give the highest efficiency for correct pair association but introduce biases to the measurement. The quoted value of is the maximum difference between results obtained using pairing algorithms based on several different variables, e.g. angular separation of the jets, of a kinematic fit, jet charge, etc.
In order to improve the mass resolution a kinematic fit can be applied, using the constraints of energy and momentum conservation (4-C fit). In addition, the exact (or Gaussian) equality of the two W masses of the event can be imposed (5-C fit). The difference in the reconstructed mass using the two types of fit is given in Table 9.
Finally, to extract from the reconstructed invariant mass, the signal is fitted with a function, such as a Breit-Wigner. However there is no unique form for such a function and, depending on the choice, different and errors (from the fit) on can be obtained. Functional forms used for the fit include convolving the Breit-Wigner with a Gaussian and including a phase space correction factor. The value in Table 9 is the maximum difference between results obtained using different functions and fit ranges; the maximum difference arises from performing the fit with or without the phase space factor. The shifts at generator level from using a phase space factor, or not, are about 150 MeV. At the detector level there is additional distortion of the line shape from the kinematic fit.
-
Component Evaluation Method Event selection Change cut value MeV ISR offon MeV Jet algorithm MassiveMassless scheme MeV Jet pairing Change algorithm MeV Kinematic fit 4-C5-C MeV BW fit Change functional form MeV
As we can see from the Table 9, the mass shifts and hence potential biases can be large, but it is the uncertainty on the necessary corrections that is important for the final measurement. Hence, at any stage, it is preferable to choose an algorithm that is not only efficient but also as unbiased as possible, so that any associated errors are small. Often there are physics grounds on which the choice for the most unbiased method can be based. For example, for the jet algorithm one solution is to assign particles to jets using a P scheme and then recompute the mass of the jet using an E scheme. Since nearly all the corrections rely on how well the Monte Carlo events describe the data, it is clearly important that this agreement is tested as extensively as possible.
3.2.5 Linearity and biases††footnotemark:
††footnotetext: Prepared by C P WardThe methods of extracting so far adopted rely heavily on calibration from Monte Carlo generated samples which are analysed with the same procedures as the experimental data. In order to ensure that this calibration does not introduce a bias, Monte Carlo samples for a range of values are used. The relationship between the fitted mass value and is determined. This is found to be essentially linear in the region of interest and can be cast in the form
| (13) |
Ideally one would like the linearity 1 and the bias 0. Table 10 shows the values of and obtained for the preliminary LEP results at the 1997 Winter Conferences.
-
channel expt. ALEPH 0.9380.035 0.190.02 DELPHI 0.980.07 0.04 OPAL 0.9530.012 0.0950.014 OPAL(no ISR) 0.9750.007 0.008 ALEPH 0.8940.048 0.03 DELPHI 0.800.06 0.03 OPAL 0.890.01 0.370.01 DELPHI 0.840.10 0.05 OPAL 0.9050.009 0.240.01 OPAL 0.9070.007 0.330.01 OPAL(no ISR) 0.9400.005 0.070.01
A value of less than unity results in a corresponding loss of precision in converting to . From Table 10 it can be seen that this is most often the case. The OPAL values with and without ISR show that ISR is part of the cause for being less than unity. Further work by the experiments is clearly needed to optimize the sensitivity.
3.2.6 Possible distortion by non-CC03 graphs
The presence of non-CC03 graphs will change the shape of the fermion-fermion invariant mass distribution in the region around compared to the case of CC03 graphs only. Although this can be taken into account implicitly in the analysis by using a full four-fermion generator for the “calibration” procedure, it is of interest to understand the size of the effects and the agreement between different four-fermion generators. Firstly the shifts in a specific four-fermion generator, WPHACT, are considered. Then other studies, including more detailed detector and selection effects, are discussed.
3.2.7 Generator level studies of distortion by non-CC03 graphs using WPHACT††footnotemark:
††footnotetext: Prepared by A BallestreroAn investigation of the shifts between the value of extracted from a full four-fermion treatment and the sub-set of CC03 diagrams has been carried out at generator level using WPHACT[25]. In each case distributions were generated for = 80.356GeV for the semi-leptonic channels and . The W width used was GeV. The effects of collinear initial state radiation were included, but not final state radiation. Two types of mass distributions were analysed. First the “true” invariant mass distribution, using the generated four momenta of these particles, was used. For the second distribution the three-momenta of the u,d and were used to compute the missing momentum pmiss. This was used as an estimator of the neutrino three-momentum. The neutrino energy is taken as the modulus of pmiss. The invariant mass of the system was then calculated, and will be referred to as .
An example of a generated mass distribution for the final state is shown in Fig.15 for the full four-fermion case. Some loose event selection criteria have been imposed. The minimum of the u, and energies must be greater than 10GeV and the ud invariant mass greater than 40GeV. The angle between the lepton and the beam must be between 10 and 170 degrees, and the u and angles greater than 5 degrees.

Fits have been made over the mass range shown in the plot to determine the W mass and width. A relativistic Breit-Wigner with a running width was used. The overall for the fits was poor, and the errors were multiplied by a factor of two to obtain those quoted below. This gives an acceptable /d.o.f. of about unity for the “true” distributions, but is still poor (/d.o.f. up to 2) for the reconstructed distributions. The results are the fits are given in Table 11.
-
distribution true 1 01 true +411 01 recon. +401 01
It can be seen from Table 11 that the differences in the fitted values between the full four-fermion and CC03 cases for the “true” distributions are small. For the channel the shift is about 3MeV, whereas for it is even smaller. The shift with respect to the generated mass is about 25MeV, and on the width the change is 4MeV or less. The “true” fitted masses show no difference in the channel, but a 40MeV shift is seen in the channel. When the fits are performed on the reconstructed distributions a similar pattern is observed: a shift is still found in the channel, and no mass difference occurs in the channel. The fitted widths also change significantly (increasing by 0.2GeV), indicating that the shape of the distribution is distorted by the reconstruction procedure. This is also apparent from the poorer of these fits.
3.2.8 Other studies of distortion by non-CC03 graphs††footnotemark:
††footnotetext: Prepared by C Parkes, P B Renton and D WardThis section reports on studies performed by the OPAL and DELPHI Collaborations comparing CC03 and full four-fermion simulated events.
In the OPAL study simulation events corresponding to an integrated luminosity of around 5000 pb-1 were generated. The full OPAL detector simulation and reconstruction methods were then applied. Events which pass the usual selection criteria are then analysed in two complementary ways.
The first method applied by OPAL uses the true generated W mass for each selected event. is calculated by appropriately pairing up the generated four final state fermions as if they came from . Two invariant masses are then formed, and the average is found. A fit is made to the distribution of to a function BW(, where BW() is a relativistic Breit-Wigner, and is a phase-space factor equal to the c.m. momentum of a pair of W’s of average mass . Then a comparison between the fitted mass parameter in the BW for CC03 and four-fermion cases is made, and the results for (four-fermion CC03) (inMeV) are shown in Table 12 for the different channels and for two four-fermion generators; grc4f and EXCALIBUR.
-
generator () grc4f 15 +2623 18 EXCALIBUR 13 +5819 +315
Despite the large statistics in these samples, the results are still somewhat inconclusive. Both generators seem to indicate a positive mass shift for compared to the other channels, at the level of about 50MeV, albeit with large errors. These results confirm the naive expectation that the shift is larger in the channel than the channel, as additional diagrams contribute in the electron channel (see section 3.1.1) However, there also seems to be an overall shift of the grc4f numbers with respect to the EXCALIBUR numbers, by about 25MeV. This, of course, is not expected.
In the second OPAL analysis the difference - , where is the reconstructed mass, is formed. From a fit to the peak region of this difference the mean is found. This is then a measure of the bias introduced by the reconstruction. Next the difference in this bias between four-fermion and CC03 is found. This study is done for events with only a small amount of ISR, because ISR distorts the resolution peak. The results are given in Table 13.
-
generator () grc4f 012 20 20 EXCALIBUR +2310 16 +2816
It is again difficult to draw very clear conclusions from this set of numbers. Naively one would have expected these all to be close to zero; and indeed they may, but only two lie within 1 s.d. of zero. Again, the grc4f numbers are systematically shifted compared to EXCALIBUR. Whether these differences stem from the original generators or from the modifications needed to implement them in the experimental environment (e.g. Coulomb corrections, QCD corrections to , an angle cut on the electron, treatment of masses etc.) is still an open question.
The DELPHI study was made using the EXCALIBUR four-fermion generator to produce CC03 and four-fermion event samples. The event selection was made at the generator level, where cuts were applied that mimic those of the collaboration’s full analysis. The samples were then analysed in a similar manner to the first OPAL method. The results of this study, and a further similar study in the DELPHI Collaboration [26], are compatible with the OPAL EXCALIBUR results given in table 13. The shifts in the and channels are found to be small ( 10MeV). For the channel the shifts are small ( 20MeV) when fitting the invariant mass, but about 75 MeV when fitting the invariant mass. Thus it would appear that it is mainly in the invariant mass distribution that a distortion of the Breit-Wigner shape by non-CC03 graphs occurs.
3.3 Error from the determination of the LEP energy††footnotemark:
††footnotetext: Prepared by P B RentonAt LEP 1 the absolute energy scale is determined by the very precise method of resonant depolarisation, which gives an accuracy of better than 1MeV in the average circulating beam energy. This technique becomes increasingly difficult at higher beam energies, so that the accuracy at high energy is largely determined by the highest value of the energy at which resonant depolarisation can be made.
Several attempts were made in 1996 to achieve transverse polarisation at as high an energy as possible. A measurable level of polarisation was obtained at 50GeV on several occasions, but so far attempts at higher beam energies have not succeeded.
The 1996 beam energy was obtained with a precision of about 30MeV [27]. By far the largest component of the error came from extrapolating the polarisation measurements at lower energies (45 and 50GeV) to the operating beam energies of 80.5 and 86GeV. The extrapolation errors were 24 and 29 MeV respectively. The other significant components in the error came from the relative fill to fill normalization (10 and 5MeV respectively) and the uncertainties in the modelling of the RF corrections (5 and 5MeV respectively). The LEP beam energy error is a common systematic error when combining results from the four LEP experiments. However, because of the limited luminosity for the 1996 data, the LEP energy error remained a small component of the overall error.
In order that the error from the LEP beam energy remains a small component in future high luminosity running it is desirable that it can be reduced to 15MeV or better444In [6] a target error of 12MeV was used. In order to achieve this the extrapolation error must be reduced. Two approaches are being pursued by the LEP Energy Working Group. The first is to understand better the relative energy scales at 45 and 50GeV, where measurements have been made. The relative error () for these two energies in 1996 was about 4MeV; and this leads to the extrapolation errors quoted above. A significant part of this error comes from the rather limited number of such polarisation measurements. In only one fill was the energy measured at both these energies, and in addition there were two fills where measurements at 50GeV were made. More depolarisation measurements at these energies should, provided there are no surprises, allow a significant reduction in .
The extrapolation with energy in 1996 was taken to be linear. If can be substantially reduced, then possible non-linear terms in the extrapolation could then constitute a sizeable part of the extrapolation error. Thus obtaining resonant depolarisation at energies higher than 50GeV is a high priority. During the 1996/97 shut-down improvements were made to LEP which are designed to produce flatter orbits, and thus improve the polarisation build up at higher energies. Polarisation measurements at 55GeV, or possibly 60GeV, would help considerably in understanding the extrapolation. If polarisation at higher energies cannot be achieved then there is a possibility to get a third point somewhat below 45GeV. However this possibility is limited by the range of the NMR devices which measure the dipole field and are needed in the extrapolation and modelling procedure.
In summary, provided that there are no hidden surprises, and that sufficient time is devoted to making resonant depolarisation measurements, then a LEP beam energy error of 15MeV should be achievable.
3.4 Error extrapolation††footnotemark:
††footnotetext: Prepared by D G Charlton, P Dornan, R Edgecock, P B Renton, W J Stirling, M F WatsonThe report of the Working Group in the LEP 2 Workshop Yellow Book (YB) [6] contains estimates for the likely attainable precision on from both the threshold and direct reconstruction method. These estimates contain the most accurate information available in late 1995; they were based on Monte Carlo simulation work and theoretical studies. However, now that a significant amount of LEP 2 data has been collected and measurements have been made using both methods (for a summary see [1]), it is worth reviewing these estimates. In the following sections we compare the precision currently achieved by the LEP collaborations with that predicted in the Yellow Book study, and use this comparison to refine the predictions for future attainable precision on as a function of luminosity.
3.4.1 Threshold method
The method of extracting from the cross-section at threshold is discussed in [1]. In 1996 the four LEP experiments combined obtained a total luminosity of approximately at a centre of mass energy of . In Tables 14-16 we consider the three decay channels (, , ) and compare the Yellow Book predictions (labelled YB) with the published experimental results of the four LEP collaborations (labelled achieved); in the light of experience we then provide new estimates that would be obtainable for future running. It is important to note that great effort has not yet been made in reducing the systematic errors, since for the current integrated luminosity the statistical errors are completely dominant: indeed currently the statistical errors from the number of simulation events produced can be a significant component of the systematic error.
Table 14 shows the signal efficiency, background cross section, and systematic error for the decay channel. The systematic errors obtained by the four experiments already largely match the YB estimates. In addition, ALEPH and OPAL report combined efficiencies for this channel in excess of the % YB prediction, however the backgrounds are somewhat larger than anticipated. To extrapolate to higher luminosities, we assume an efficiency of and a corresponding background estimate of . We assume a (common) systematic error of , a value already achieved by one experiment. Using these values we may estimate the fractional errors on for different luminosities. Table 18 compares the estimated (‘Oxford’) and YB errors for per experiment. Note that for this channel the Oxford and YB estimates are almost identical, the increase in background being compensated for by a slightly higher efficiency.
-
YB % % Achieved % % Projection % % (mostly common)
The results of the decay channel study are given in Table 15. The most significant difference between the results achieved and the YB predictions is in the substantial improvement in efficiency in the channel. The YB study made no attempt to optimize this channel, and as a result the efficiency was only . In contrast, the LEP experiments have already achieved efficiency, albeit with a significantly larger background. For the projection to higher luminosities we assume an overall efficiency of and a corresponding background of . We assume an overall systematic error of for this channel, of which is taken to be common. Comparing the fractional errors on the cross section listed in Table 18, we see a significant improvement in the predicted overall precision with respect to the YB.
-
YB % % Achieved % % Projection % % ( % common)
It is more difficult to make a similar assessment for the expected precision for the channel. After a loose preselection to eliminate the major component of the background, the four experiments use a combination of multivariate and sophisticated cut based analyses to separate the signal from the QCD background. In contrast, the YB predictions were based on a simple cuts selection [6], yielding a signal efficiency of approximately and a purity of approximately . Given the nature of the analyses performed, instead of quoting backgrounds and efficiencies, we provide a statistical sensitivity both for the present results and for our predictions. In order to extrapolate to higher luminosities we take the current ALEPH statistical sensitivity of for as typical, and assume a common systematic error of , slightly larger than the YB estimate, see Table 16.
-
YB % % Achieved 28% (ALEPH) Projection % % (common)
The corresponding fractional errors on are listed in Table 18. The improved signal selection efficiency leads to an overall slight reduction in the cross section error compared to the YB estimates. As anticipated in [6], similar errors on the cross-section are obtained in the and channels.
In order to translate a cross section error into an error on several additional (common) systematic uncertainties need to be taken into account. These are summarised in Table 17. As discussed in detail in Section 3.3, it is estimated that the LEP beam energy error (currently ) can ultimately be reduced to . A value of was assumed in the YB study [6]. The theoretical error on the cross section also contributes to the error on : . In the YB study a error was assumed, arising in part from (unknown) higher-order loop diagrams involving Higgs boson exchange. However calculations performed since the LEP 2 workshop [28] have shown that the corrections are intrinsically small and decrease rapidly with increasing . Using the range of values for obtained from direct searches and global electroweak fits essentially eliminates the error from this source. The remaining theoretical error on is therefore expected to come from higher-order finite QED corrections, and so it is reasonable to assume an error of for future projections.
-
YB Achieved Projection
Combining these two systematic errors with the cross section errors discussed above gives the estimated overall errors on at (per experiment) listed in Table 18. Also shown are the YB estimates. (It is interesting to note that the YB estimate of for is exactly the current error from the combined LEP experiments.) The key point to note is that a significant improvement on the projected YB errors can be expected. In particular, a relatively modest total luminosity per experiment could now be expected to yield an error of from the threshold cross section measurement.
-
luminosity/expt. channel YB Oxford 34% 32% 19% 15% 20% 15% combined 13% 10% (total) 220 MeV 170 MeV 15% 15% 9% 7% 10% 8% combined 5.9% 4.9% (total) 108 MeV 86 MeV 11% 11% 6.5% 5.1% 7.3% 6.7% combined 4.4% 3.8% (total) 84 MeV 69 MeV
3.4.2 Direct reconstruction
During the second period of running in 1996 the LEP experiments collected a similar total integrated luminosity (approximately ) at an energy of 172 to that obtained at threshold. However the future accuracy of the direct reconstruction method for measuring is more difficult to assess: the analyses are currently at a relatively preliminary stage, and these data are expected to comprise a relatively small proportion of those provided by the full LEP 2 programme. Much more work directed at reducing the systematic errors will be performed as more data are collected. Nevertheless, based on existing experience and the Yellow Book studies it is possible to make some educated guesses as to the likely ultimate precision. As a benchmark, we take the current ALEPH and DELPHI (see [1]) statistical and systematic errors, summarised in Table 19, based on approximately per experiment at . Note that the systematic errors currently range from to depending on the channel and the experiment. The major challenge is to reduce these to the level anticipated in [6], see elsewhere in this report. As discussed above, a LEP beam energy uncertainty of appears to be achievable.
-
channel expt. stat. sys. A 510 60 D 500 94 A 450 180 D 450 75
Table 20 summarises the expected uncertainties at the three luminosities (per experiment). Also shown are the YB estimates. Note that the dependence of on the beam energy in the range is expected to be weak [6]. The estimates for the channel in Table 20 do not include any contributions to the errors from colour reconnection or Bose Einstein correlations.
-
channel luminosity/expt. stat. sys. LEP total YB 71 21 15 76 41 21 15 49 32 21 15 41 44 71 24 15 77 41 24 15 50 32 24 15 43 45 (col.rec.BE) combined 35 34 (col.rec.BE)
Hence the results obtained on the 1996 data sample (using both methods) are broadly in agreement with the YB predictions. The opportunity is available at LEP 2 to obtain precision measurements of from these two independent methods. We conclude that there is every reason to believe that the direct reconstruction method YB estimate of can indeed be achieved.
4 Summary
After one year of LEP 2 data taking, measurements of the W mass have been made using two different techniques: from the threshold cross-section and from direct reconstruction. The results from these methods are compatible and the errors are dominated by their statistical components. A common theme of the various studies performed at the workshop was to ascertain whether the systematic errors were well understood. That is, are they understood at a level where one can extrapolate with confidence to the full LEP 2 statistics and ensure that systematic effects will not dominate?
The effects of colour recombination and Bose-Einstein statistics on the reconstructed W mass in the fully hadronic channel were explored in some detail. These studies supersede those made for the CERN LEP 2 Workshop and in both cases suggest that the error could well be smaller than previous studies have indicated; although more work is needed for a definitive conclusion on these topics. The importance of relating the predictions of the various models to measurable quantities, such as multiplicities, was stressed.
The background from the QCD processes to jets is large and needs to be well understood. One particular problem is the extent to which the precise LEP 1 studies can be extrapolated to LEP 2 data. A study at the workshop ascertained that the relevant events do populate the ranges of the four-jet angular variables for which there are discrepancies between data and Monte Carlo at LEP 1 . An attempt was also made to understand the differences between the PS MC and matrix element predictions for angular variables. Part of these differences was found to be due to the lack of correct angular correlations in the part of the PS MCs.
The correction factors in going from the measured four-fermion cross-section to the CC03 cross-section, as determined by the LEP experiments, were compared. This was difficult because of the different ways that these were implemented in practice. General agreement in these calculations was obtained.
A detailed investigation was made of many of the systematic effects which need to be understood to make a precise measurement of by direct reconstruction. These included studies of the problems of finding the correct pairing in fully hadronic decays and of the benefits and disadvantages of the various strategies of kinematic fitting and rescaling techniques. It was found that for these and other studies (on biases, linearity of response, distortion of the lineshape by non-CC03 graphs etc.) there was sufficient understanding at present but that further studies were needed to ensure the full LEP statistics can be exploited. The LEP energy error, which is a common systematic to all measurements of can probably be determined with sufficient accuracy, provided the much needed studies show no surprises.
Finally, a comparison of what can be expected if there was to be a further threshold run, and a review of the expected precision of the direct reconstruction method, were reported. From experience of running at , it appears that the precision on from the threshold cross section method estimated in the Yellow Book study can be improved upon. Overall, provided there are on-going studies on the systematics, the desired goal of (50) MeV, seems achievable.
References
References
- [1] Thompson J C Experimental aspects of W mass determination, these proceedings
- [2] Webber B R Colour recombination, BE correlations and other effects in W production, these proceedings
- [3] Cowan G QCD, data/Monte Carlo comparison, these proceedings
- [4] Gustafson G, Pettersson U and Zerwas P M, 1988 Phys. Lett. 209B 90
- [5] Sjöstrand T and Khoze V A 1993 Z. Phys. C 62 281
- [6] Determination of the Mass of the W boson, Kunszt Z et al , in ‘Physics at LEP2’, eds. Altarelli G, Sjöstrand T and Zwirner F, CERN Report 96-01, Vol.1, p.141-205 (1996)
- [7] Gustafson G, Häkkinen J, 1994 Z. Phys. C 64 659
- [8] Program ARIADNE, Lönnblad L, 1992 Comp. Phys. Commun. 71 15
- [9] Program HERWIG, Marchesini G et al , 1992 Comp. Phys. Commun. 67 465
- [10] Todorova-Nová S, DELPHI 96-158 PHYS 651, Colour Reconnection in String Model (unpublished)
- [11] Ellis J and Geiger K, preprint CERN-TH/97-46 (1997); 1996 Phys. Rev. D 54 1967
- [12] OPAL collaboration: Ackerstaff K et al , 1996 Phys. Lett. 389B 416
-
[13]
Kartvelishvili V, Kvatadze R and Møller R, MAN/HEP/97/3,
1997
hep-ph/9704424"
\bibitem{tt10} L\
onnblad L and Sjöstrand T, 1995 Phys. Lett. 351B 293 - [14] Haywood S, RAL-94-074
-
[15]
Fialkowski K and Wit R, 1997
hep-ph/9703227"
\bibitem{jada} Jadach~S and Zalewski~K, preprint CERN-TH/97-29
\bibitem{biaj} Biyajima~M \etal, 1990 Progr.~Theor.~Phys. {\bf 84} 931
\bibitem{bo} Andersson~B, in Proc.\ XXV Int.\ Symp.\ on Multiparticle
 Dynamics, WS, 1995, p. 335; Andersson~B and Ringner~M, LU TP 97-07,
 \hepph{97}{04383}
\bibitem{alephBE}\ALEPH\ Collaboration: Decamp~D \etal,  \zp{54}{75}{92}
\bibitem{delphiBE}\DELPHI\ Collaboration: Abreu~P \etal,
 \pl{286}{201}{92}; \zp{63}{17}{94}
\bibitem{tt11} Sj\
ostrand T, 1994 Comp. Phys. Commun. 82 74 - [16] ALEPH Collaboration: Barate R et al , preprint CERN-PPE/97-002 (1997)
- [17] Ellis R K, Stirling W J and Webber B R, QCD and Collider Physics, Cambridge University Press (1996)
- [18] Moretti S and Tausk J B, 1996 Z. Phys. C 69 635
- [19] Moretti S and Stirling W J, in preparation
- [20] Introduction: the need for Monte Carlo, in ‘Physics at LEP2’, eds. Altarelli G, Sjöstrand T and Zwirner F, CERN Report 96-01, Vol.2, p.6 (1996)
- [21] ALEPH Collaboration: Barate R et al , 1997 Phys. Lett. 401B 347
- [22] DELPHI Collaboration: Abreu P et al , 1997 Phys. Lett. 397B 158
- [23] L3 Collaboration: Acciarri M et al , 1997 Phys. Lett. 398B 223
- [24] Thomas J, University of Oxford, private communication
- [25] Accomando E, Ballestrero A, 1997 Comp. Phys. Commun. 99 270
- [26] Mönig K, CERN, private communication
- [27] LEP Energy Calibration in 1996, LEP Energy Group/ 97-01
- [28] Beenakker W and van Oldenborgh G J, 1996 Phys. Lett. 381B 248