PSI-PR-97-21
A Precision Measurement of
Nuclear Muon Capture on 3He
P. Ackerbauer1, D.V. Balin2, V.M. Baturin2, G.A. Beer8,
W.H. Breunlich1, T. Case6, K. Crowe6, H. Daniel5, J. Deutsch3, J. Govaerts3,
Yu.S. Grigoriev2, F.J. Hartmann5, P. Kammel6, R. King1, B. Lauss1, E.M. Maev2,
V.E. Markushin4,7, J. Marton1, M. Mühlbauer5, C. Petitjean4, Th. Petitjean4,
G.E. Petrov2, R. Prieels3, W. Prymas1111This paper is part of the thesis works of W. Prymas and N.I. Voropaev, W. Schott5, G.G. Semenchuk2,
Yu.V. Smirenin2, A.A. Vorobyov2, N.I. Voropaev2∗, P. Wojciechowski5
(1) Austrian Academy of Sciences
Institute for Medium Energy Physics,
A-1090 Wien, Austria
(2) Petersburg Nuclear Physics Institute (PNPI), Gatchina 188350, Russia
(3) Catholic University of Louvain, B-1348 Louvain-la-Neuve, Belgium
(4) Paul Scherrer Institute, CH-5232 Villigen, Switzerland
(5) Technical University of Munich, D-85747 Garching, Germany
(6) University of California at Berkeley and
Lawrence Berkeley Laboratory, 94729 California, USA
(7) Kurchatov Institute, 123182 Moscow, Russia
(8) University of Victoria, Victoria B.C. V8W 2Y2, Canada
The muon capture rate in the reaction
has been measured at PSI using a modular high pressure
ionization chamber. The rate corresponding to statistical hyperfine population
of the He atom is (.
This result confirms the PCAC prediction for the pseudoscalar form factors
of the 3He -3H system and the nucleon.
PACS: 23.40.-s
1 Introduction
We report on a measurement of the muon-3He capture rate to the triton channel, , performed to a level of precision unprecedented in nuclear muon capture experiments.
The main information gained from this measurement is the determination of the induced nuclear pseudoscalar form factor in the system treated in the frame of the Elementary Particle Model (EPM) pioneered by Kim and Primakoff[1] and elaborated recently by Congleton and Fearing[2]. The value obtained for provides a stringent test of the Partially Conserved Axial Current (PCAC) approximation[3], based on the Goldstone mode realization of the approximate chiral symmetries of QCD.
In addition, comparison of the measured capture rate with that calculated according to the presently available[4] microscopic model of muon capture by 3He allows a test of the validity of this approach which takes the Meson Exchange Currents (MEC) explicitly into account. Using this model, one can evaluate the induced pseudoscalar form factor of the nucleon, . Furthermore, our experimental result also allows for further tests of the Standard Model in its electroweak sector[5].
In spite of the uncertainties in the various form factors entering the calculation, PCAC and EPM predict the capture rate to a precision of 1.4%[2]. Until now the experimental situation did not equal such a precision, since only three measurements[6, 7, 8], dating back to over thirty years ago were available, with precisions ranging from 3% to 10%. The situation thus called for a new precision experiment which is described in this work. Preliminary results were published earlier[9, 10].
2 Experiment
One of the main advantages in measuring nuclear muon capture on 3He, compared to hydrogen, is the production of a charged particle in the final state, which can be detected with high efficiency and good background suppression. For muon capture on 3He, the main reaction channel is
| (1) |
accompanied by triton breakup into (20%) and (10%)[11].
These reactions occur from the two hyperfine states of the He muonic atom, of total spin and , see the kinetics scheme in Fig.1. Since in the present experiment the 3He target is not polarized and the spin flip is small (cf. results below), the hyperfine states are statistically populated, and it is the statistical capture rate to the triton channel
| (2) |
The strategy of the experiment was to select a clean sample of muon stops, , in the fiducial volume of an active target well isolated from the target walls and to ensure a 100% efficiency in detection of the tritons, , from reaction (1). Then, the ratio combined with the decay constant of the muon will be a direct measure of the muon capture rate.
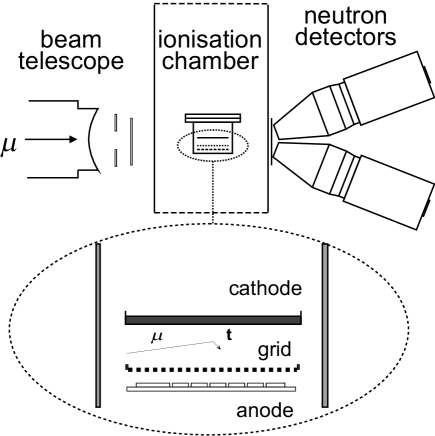
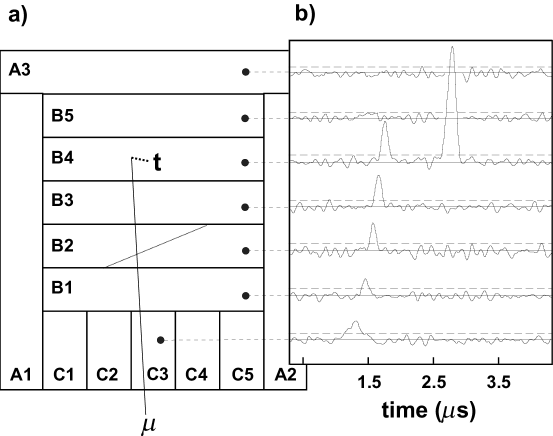
The experiment was performed at Paul Scherrer Institute (PSI) using the E4 superconducting muon channel. The apparatus is shown in Fig.2. The target, which is also the main detector, consists of a high pressure ionization chamber (IC), filled with 120 bar 3He at room temperature111The level of impurities was checked before and after the run using a quadrupole mass spectrometer, and found to be for 4He and less than for isotopes with . . The ionization chamber includes a total of 14 anodes (see Fig.3a): 5 entrance anodes (type C), 5 stopping anodes (type B), one of which is split, and 3 veto anodes (type A). The anodes have a pad pattern, which allows the tracking and location of the stopping muon. The B-anodes cover an area of . The cathode to grid and grid to anode distances are and , respectively. This amounts to a sensitive volume of . The cathode voltage is , while the grid is kept at . These conditions result in a maximum electron drift time of . The energy resolution is (). The IC is surrounded by an array of plastic scintillation counters for the detection of neutrons from the breakup reactions and electrons from muon decay. In the present experiment, this detector array serves mainly for time scale calibration. A beam telescope of thin plastic scintillators provides a fast trigger and also eliminates double-muon events in a time interval. The muons enter the IC through a Beryllium window of thickness with minimal Coulomb scattering in the window.
A two-level charge-integrating trigger was used for the B-anodes. The three main modes were (threshold , typical rate ) which fires for each muon stopping over the B-anodes, (two time-separated thresholds at , typical rate ) which fires for each muon track followed by a separated triton signal, and (threshold , typical rate ) which fires for most tritons and for each triton piled up on the muon signal). together with provide a 100% effective trigger for the triton events. For triggered events, the signals from all anodes were recorded over a period of with flash ADCs (Fig.3b). In total, about muons entered the fiducial volume triggering . The trigger was prescaled by various factors = 500, 1000, and 2000 to reduce the data rate. Finally, prescaled and (+) triggers were registered on tape during a four weeks running period.
3 Data Analysis
There are two basic event types in this experiment, those in which the triton was emitted late enough () to have its signal cleanly separated from that of the muon (see example in Fig.3b) and those in which the two signals overlapped. The bulk of the statistics (85%) comes from the separated events. However, to determine the muon capture rate, we should measure the total number of tritons including pileups. There are two possibilities for measuring the number of the pileups: direct counting of the pileup signals or exponential extrapolation to of the time distribution of the triton signals separated in time, with , where and are the arrival times of the triton and the muon signals on the IC anodes.
This data was analyzed using both of these techniques which have different systematic effects and therefore cross-check each other. We label these techniques as analysis A (inclusive of pileups) and analysis B (separated events only)[9, 10]. Furthermore, each of these analyses was performed independently in a smaller fiducial volume and with a substantially different approach to the systematics: analysis C (inclusive of pileups) and analysis D (separated events only)[13]. Note that, for instance, analysis A and analysis B are identical in all phases except in finding the pileup events. In analyses B and D, was determined with a mid-pulse timing technique, with some corrections for the geometrical effects of the muon and triton angles. Analyses C/D used the region of muon stops from the center of B2 to the center of B5, while analyses A/B used the whole region B1-B5. Also, analyses C/D used less vertical space by more conservative cuts of the muon drift times. Analysis A, by including pileup events, using more B-anodes, and extending the drift volume gave the largest triton statistics (1141263 events).
We should stress that special attention was paid in all of our analyses to guarantee strictly identical detection efficiencies for muons with and without tritons. Below, for brevity, we present in detail only the results of analysis A together with some remarks about and the final results of analyses B/C/D.
3.1 Selection of Muon Stops
The position of a muon stop along the beam direction was determined by the energy deposits on the stopping anode Bi and the preceeding one. In analyses A/B the muon stop position was determined by finding the most downstream anode of those anodes with the biggest number of signals (generally two at most). In analyses C/D this position was determined by following a contiguous muon track from a single C-anode hit. Vertically, the fiducial volume was determined by cuts on the drift time of muon tracks () which set the capture location at least from the anode and grid, such that the triton track would not touch these electrodes. Note that the triton range was under the conditions of our experiment. Laterally, the volume was set by rejecting events in which there was a muon signal on one of the A-anodes within from the muon track. This restricted the penetration into the A-anodes to less than . Furthermore, the number of muon stops over the side anodes was kept low by triggering only on single, central C-anodes, selecting mostly events in the middle of the chamber and further reducing double muon events.
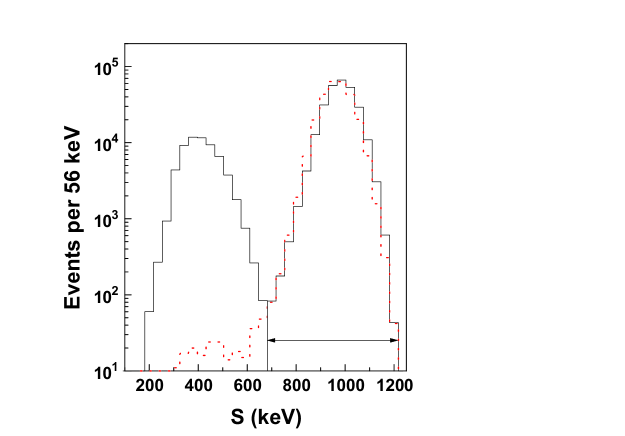
Finally, we strictly define the characteristics of the muon stop using the muon energy deposits on the stopping anode and on the previous anode. The distribution (Fig.4) shows a narrow peak for stopping muons. By making a cut on we severely reject any track or noise except a well defined muon stop. This cut is loose enough that we estimate from the -distribution less than 0.01% difference in efficiency for muons followed by capture tritons versus muons without capture reaction.
3.2 Detection of the Tritons
In the analysis all triton events were subdivided into the following event types:
-
1.
Triton signal separated in time from the muon signal.
-
1.1
Triton signal is on the same anode, , as the muon stop.
-
1.2
Triton signal is split between and an anode neighbour to the one where the muon stopped.
-
1.3
Triton signal is completely contained on an anode adjacent to the one on which the muon stopped.
-
1.1
-
2.
Triton signal overlaps with the muon signal.
-
2.1
Pileup signal is on the same anode, , as the muon stop.
-
2.2
Pileup signal is split between and one of the neighbouring B- or A-anodes.
-
2.1
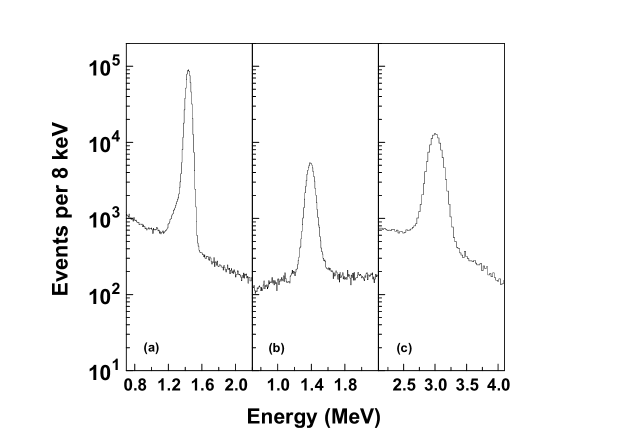
Fig.5 shows the energy spectra of the event types 1.1, 1.2 and 2.1, which dominate the overall statistics. The background under the triton peak is due to breakup reactions. In analysis A the background was subtracted by linear estimates based on the background above and below the peaks. The systematic error was then estimated by varying the regions of this linear fit. Analyses C/D used polynomial fits resulting in comparable errors. The numerical results of analysis A are presented in Table 1.
| Event type | (%) | BG | BG/ (%) | |
|---|---|---|---|---|
| 1.1 | 843322 | 73.9 | 30882 | 3.7 |
| 1.2 | 77881 | 6.8 | 11943 | 15.3 |
| 1.3 | 52638 | 4.6 | 2684 | 5.1 |
| 2.1 | 157165 | 13.8 | 20144 | 12.8 |
| 2.2 | 10257 | 0.9 | 9889 | 96.4 |
| sum | 1141263 | 100.0 | 75542 | 6.62 |
Several corrections were applied to the measured number of . The main correction (6.445%) is a trivial one taking into account the time beyond the analyzed time interval of . Other corrections compensate mainly for rare event types, e.g. tritons passing into one of the A-anodes, not listed in Table 1, and for small losses of triton events. The sum of these corrections is 0.735% (see Ref.[10]), bringing the total correction to to = 7.18%.
4 Results
The calculation of the muon capture rate was done according to the formula
| (3) |
where is the number of detected tritons, is the number of selected muon stops, not followed by muon capture, is the decay rate of the muon, and is the trigger prescaling factor. Note that in our experiment, the muon stops which are not followed by muon capture are the events triggered by only. This trigger contains practically none of the muon capture events (except for about 10% of low energetic breakup events giving a negligible correction to of 1.4).
The statistical error is determined by the following expression
| (4) |
where is the fraction of muon stops used in the analysis. (In the approximation of Eq. 4 accounting for all muons would leave only the statistical error of .) In the considered case of analysis A: = 1141263, = 349479, = 0.356, while the total number of selected muon stops corrected by the prescaling factor is = 374028500. Substituting these numbers for each value separately in (3) and (4) and combining results statistically we obtain
| (5) |
The systematic error was evaluated by varying the energy and time cuts in wide ranges and comparing results from independent data on different anodes and under different running conditions. The main contribution to the total systematic error comes from uncertainties in the background subtraction (0.16%). The residual systematic errors in the determination of and are 0.03% and 0.05% respectively, giving a total systematic error of 0.17%.
| 2000 | 2000 | 1000 | 500 | |
| 53664 | 70619 | 25729 | 199467 | |
| 327252 | 429989 | 78622 | 305400 | |
| B1 | 149716 | 150015 | 151423 | 150911 |
| B2 | 148315 | 148914 | 149421 | 148210 |
| B3 | 148415 | 147113 | 148220 | 150310 |
| B4 | 149814 | 148613 | 151420 | 151610 |
| B5 | 150614 | 152513 | 149720 | 149210 |
| B1-B5 | 14936 | 14955 | 15018 | 15004 |
Table 2 presents the partial results in measuring (analysis A). These results show a remarkable stability. The final result from analysis A is
| (6) |
The results from the other three analyses are:
| (7) |
| (8) |
| (9) |
Let us recall, that the principal difference between analyses B/D and A/C is that B/D used only the separated events, requiring extrapolation back to . This method relies on the precision of the determination of the absolute value of the position. We have shown that the mid-pulse to mid-pulse technique determines this position with a precision better than 2 ns. In analysis B this was proven using the neutron detectors to compare the arrival times of decay electrons with neutrons from the breakup channels and correcting for the estimated time of flight. In analysis D, was confirmed by checking the average angle and curvature of muon tracks to estimate any offset to the mid-pulse technique. In all analyses, several other systematic effects were checked. These include: edge effects, binning errors, triton track angle effects, and pedestal shift effects. The very good agreement among all analyses demonstrates the low level of remaining systematic errors.
Finally, we present our result as
| (10) |
where the error is the combined statistical and systematic error of the larger statistics analyses A and B.
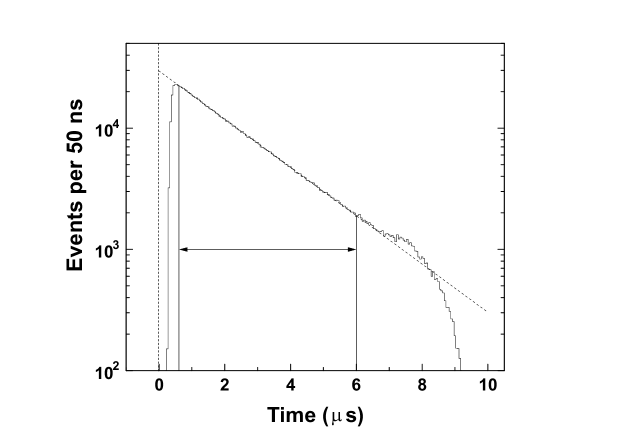
The measured value of corresponds to a statistical population of the singlet and triplet states of He atoms. An assumed hyperfine transition from the singlet to the energetically lower triplet state with a rate would change the observed by +0.17%. Fortunately, we can limit this process in our experiment by comparing the observed time distribution (Fig. 6) of the tritons with the expected one:
| (11) | |||||
Using the rate determined above and the total spin averaged capture rate [14] together with the theoretical values for the differences between the singlet and triplet capture rates [2] and [15] we obtain
| (12) |
thus restricting the possible influence of this process to a level of 0.14%.
Another uncertainty might arise if a significant fraction of the 2s-state were metastable with a lifetime comparable to the muon decay rate. The total initial population for the 2s-state is 7%[16]. According to the present understanding[16, 17], however, the quenching of the 2s-state occurs on a much shorter time scale and does not influence our result. But again, we can limit this effect with our own data by comparing the number of tritons, , obtained by the extrapolation method (analyses B/D) with that obtained by direct counting of pileups (analyses A/C). From this comparison we obtain the upper limit for the lifetime of the 2s-state
| (13) |
The effect of this transition is indeed negligible.
5 Discussion
The obtained result can be analyzed in the framework of the EPM[1]. In this model, the weak current of the 3He-3H transition is parametrized by four form factors , , , and , evaluated at the relevant value of the four-momentum transfer , see e.g. Ref.[2]. Two of these parameters, the vector and magnetic form factors, and , are derived from the conserved vector current (CVC) theorem and from the results of electron elastic scattering by 3He and 3H[2]:
Taking these data as inputs, our measurement determines the correlation between the pseudoscalar form factor and the axial form factor , as shown in Fig. 7. The width of the allowed region is determined mostly by the error in . In a further step we use extrapolated[2] from as determined from the 3H beta decay rate. Note that this extrapolation involves some theoretical consideration based on the impulse approximation that results in the increase of the error in . This procedure allows determination of the pseudoscalar form factor
| (14) |
The main contribution to the error comes from the error on , while the contribution from our measurement is only 0.5 .

The obtained value of can be compared with the PCAC prediction that relates the pseudoscalar and axial form factors:
| (15) |
This relation is shown in Fig.7 by the dot-dashed line. Taking again the extrapolated value for , one obtains
| (16) |
in perfect agreement with our experimental result (15).
The availability of precise three-body wave functions of the system makes it possible to perform calculations of the muon capture rate on a “microscopic” level. Calculations done in the impulse approximation lead to a capture rate[2] of which deviates from the observed rate by 13%. This clearly indicates that MEC must be accounted for. Full microscopic calculations including MEC have been performed recently by Congleton and Truhlík[4]. The authors obtained in excellent agreement with our experimental result (10). This agreement can be interpreted as a confirmation of the validity of the approach used to include the MEC in the microscopic theory.
Note that these calculations required the knowledge of the nucleon form factors , , , and at . Three of these, namely , , and , are experimental values, while the pseudoscalar form factor was determined by the PCAC relation[3] to be
| (17) |
In this context, we wish to point out two recent publications[18, 19] where, for the nucleon, a formula identical to the PCAC relation was derived within the framework of chiral perturbation theory. Assuming the validity of the microscopic model within the errors cited in Ref.[4], we can determine from comparison of the calculated value of with our experimental result:
| (18) |
The error of this result is largely dominated by the errors in the calculation of the theoretical muon capture rate and not in the precision of the present experimental result. Note also that our value of agrees well with the PCAC prediction
| (19) |
while the recent experiment[20] on radiative muon capture on hydrogen
shows a significant deviation. Further studies of muon capture on hydrogen are
definitely needed for a determination of with higher accuracy.
Acknowledgement
This work was supported in part by the Russian Ministry of Sciences, the Austrian Science Foundation, the German Federal Ministry of Research and Technology and the Paul Scherrer Institute. The accelerator and support staff of the Paul Scherrer Institute is gratefully acknowledged for their efficient help and expertise, without which the experiment could not have been a success.
References
- [1] C.W. Kim and H. Primakoff, Phys. Rev. 140B (1965) 566.
-
[2]
J.G. Congleton, PhD Thesis, British Columbia (1992),
unpublished;
J.G. Congleton and H.W. Fearing, Nucl. Phys. A552 (1993) 534. - [3] S.L. Adler and Y. Dothan, Phys. Rev. 151 (1966) 1267.
- [4] J.G. Congleton and E. Truhlík, Phys. Rev. C 53 (1996) 956.
- [5] J. Govaerts, Symmetry Tests of the Electroweak Interaction from Muon Capture on 3He, preprint UCL-IPN-97-P01 (January 1997), hep-ph/9701385.
-
[6]
I.V. Falomkin et al., Phys. Lett. 3 (1963) 229;
O.A. Zaimidoroga et al., Phys. Lett. 6 (1963) 100. - [7] L.B. Auerbach et al., Phys. Rev. B 138 (1965) 127.
- [8] D.B. Clay et al., Phys. Rev. B 140 (1965) 586.
- [9] D.V. Balin et al., Few-Body Systems Suppl. 8, Springer-Verlag, Wien (1995) 248.
- [10] A.A. Vorobyov et al., Hyperfine Interactions 101/102 (1996) 413.
- [11] A.C. Philips et al., Nucl. Phys. A237 (1975) 493.
- [12] J.G. Congleton, Phys. Rev. A 48 (1993) R12.
- [13] W. Prymas, PhD Thesis, Vienna (1997), unpublished.
- [14] E.M. Maev et al., Hyperfine Interactions 101/102 (1996) 423.
- [15] J.G. Congleton, Nucl. Phys. A570 (1994) 511.
- [16] G. Reifenröther et al., Phys. Lett. B191 (1987) 15.
-
[17]
H.P. Von Arb et al.,
Phys. Lett. B136 (1984) 232;
M. Eckhause et al., Phys. Rev. A 33 (1986) 1743. - [18] V. Bernard, N. Kaiser and U.G. Meissner, Phys. Rev. D 50 (1994) 6899.
- [19] H.W. Fearing et al., Phys. Rev. D 56 (1997) 1783.
- [20] G. Jonkmans et al., Phys. Rev. Lett. 77 (1996) 4512.