HADROPRODUCTION OF CHARM AND BEAUTY
aaato appear in Proceedings of the XVI International Conference on
Physics in Collision, Mexico City, 1996.
Recent results on the hadroproduction of charm and beauty are discussed in the context of the current theoretical and experimental status. The areas covered include production of open charm and beauty particles and charm and beauty quarkonia. Experimental results from both fixed target and colliding beam experiments are presented and compared to theoretical predictions. Predictions based on QCD perturbation theory are generally successful in explaining the shapes of differential cross sections but underestimate the scale of the cross section by factors of 2-3. An exception is production of the vector meson quarkonia which cannot be satisfactorily explained by perturbative processes alone.
1 Introduction
This review emphasizes recent progress in the understanding of the hadroproduction of charm and beauty with an attempt to explain the new developments in the context of the fundamental questions of interest. Experimental and theoretical work is presented which best illustrates the subject. In cases where two or more illustrations of the same topic are available, usually one is chosen for presentation here and the others cited as references. In making these choices, some preference is given to results published in the regular journals over preliminary results. However, important preliminary results are also presented here. As there are many recent publications in this field, the author sincerely hopes that the fraction of the available results presented here serves to stimulate interest in the whole.
2 Theory
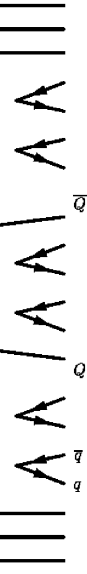
At high energy, heavy quark production is dominated by gluon collisions. For example, in a collision, illustrated in Figure 1, the valence quarks are spectators while the hard interaction producing the heavy quark pair is via gluon fusion. Many important characteristics of the heavy quark production properties are evident from consideration of the gluon-gluon collision in its center of mass frame as illustrated in Figure 2. At high energy, the energy is given by
| (1) |
where are the momentum fractions of the gluons and is the hadron-hadron energy. Since must be above threshold for a pair of heavy quarks, the cross section clearly depends on the gluon distribution functions of the colliding hadrons. Thus, pions, kaons and protons incident on the same target will produce different heavy quark cross sections. The frame is in general moving with respect to the hadron frame, and the heavy quarks can have substantial longitudinal boosts in the hadron frame. The more unequal the gluon momentum fractions, the larger will be this longitudinal boost. Since the gluon distribution functions peak at small , the heavy quark longitudinal momentum distributions (in the hadron-hadron ) will peak at zero and fall rapidly with increasing magnitude of the longitudinal momentum.


The production cross section is given by ,
| (2) |
where are the gluon distribution functions for momentum fraction and momentum transfer , and is the short distance cross section. The strong coupling constant appears in and has the form,
| (3) |
Perturbation theory can be used to evaluate when the coupling constant is less than one, as occurs when , which is of order , is greater than . This is the case for the charm and beauty quarks.
However, there are a number of theoretical problems with the formalism of equation 2. In existing calculations, the gluon distribution functions do not include heavy quarks in their evolution. Second, there are terms in the short distance cross section with coupling constants that become larger than one in certain kinematic regions. For example, factors of the form,
| (4) |
become large for . For existing calculations, the theoretical problems are manifested by large sensitivity to changes in the renormalization and factorization scales, as discussed later.
If the produced heavy quarks are close enough in momentum, they can form a bound state: the quarkonia states of charm or beauty. This formation process has a small probability and hence the fraction of heavy quark production into quarkonia is small, of order 1 part in 1000. The bulk of heavy quark production goes into open charm or beauty states. These cross sections depend on the formation of heavy quarks into particles, a process often referred to as hadronization or fragmentation. Several sub-processes can contribute to this hadronization, as illustrated in Figure 3. The heavy quarks can interact with light quark/ anti-quark pairs arising from virtual gluons. Also, the heavy quarks can interact with light valence quarks from the colliding hadrons which are spectators to the hard interaction which produced the heavy quark pair. The hadronization process can involve many small interactions and hence is intrinsically non-perturbative. Phenomenological models, such as the Lund string model, have been developed to describe the hadronization process.
Because the amount of heavy quark fragmentation into a given charm species cannot be reliably treated theoretically, comparison of the predicted total heavy quark cross section with experiment must include measurement of as many species (mesons and baryons) as possible. Comparison of measured differential cross sections for particles with theoretical predictions for quarks can reveal the effect of fragmentation.
As a preliminary remark, we note that rapidity, , and Feynman-, , are commonly used as variables to measure the longitudinal momentum of the produced heavy particle. Rapidity is the standard variable of special relativity. Feynman- is defined, in the frame of the colliding hadrons, as the ratio of the 3-momentum of the heavy particle (or quark) to the maximum possible 3-momentum. Hence, the range of is from -1 to 1.
3 Open Charm
There are new measurements of the production of open charm states from Fermilab Experiment E769 . This experiment utilized a 250 GeV charged secondary beam with the identified beam particles , , , , and . The charm particles , , , and are measured using fully reconstructed decays to all charged final states. Examples of mass plots are shown in Figure 4. The signal to background ratios and signal sizes are sufficient to measure the total and differential cross sections for most of the charm particles and beam types mentioned above. In some cases, only upper limits on cross sections are possible.

E769 is a fixed target experiment utilizing a forward spectrometer. The acceptance for reconstructed charm particle decays is typically over the range . Charm particle cross sections are reported for the , a range convenient for comparison with other experiments. Also convenient for comparing different experiments and theory is the sum of the inclusive cross sections,
| (5) |
for . This sum provides a partial measure of the total charm cross section for producing a pair of charm and anti-charm quarks.
Measurements of summed cross sections in equation (5) for -nucleon interactions from E769 and other experiments are plotted versus beam energy in Figure 5. Also shown are theoretical predictions based on perturbative QCD for different values of the renormalization scale, . The predictions are for twice the cross section for producing a charm quark pair for which at least one of the pair has . These predictions are generated using the computer program of Mangano, Nason and Ridolfi. It is clear from Figure 5 that the measured shape of the energy dependence is in reasonable agreement with theory and that the scale of the measured cross sections are higher than the central value of the prediction. Keep in mind that the summed cross section does not include charm baryons, which would increase the discrepancy if included. As can be seen from the curves for different values of , the prediction has significant variation. This is also the case for variation of the factorization scale.

For nucleon interactions, the comparison of the summed cross section with theory is shown in Figure 6. The comparison shows the same qualitative behavior as for the -nucleon case.

There are no theoretical predictions for the kaon- nucleon cross sections since no parton distribution functions are available for this case. Cross sections for five different charm species and for pion, kaon and proton beams, measured by E769, are compared in Table 1. Generally, for a given charm species, the cross sections are similar for the different beams. One notable exception appears to be the relatively large cross section for production with protons as compared to pions and kaons. This effect may indicate that an initial state light baryon enhances the production of a charm baryon. An analogous test is whether an initial state strange particle (kaon) enhances the production of charmed strange mesons . From the table, one sees no indication of this effect: the kaon induced cross section is consistent with the cross sections for pions and protons.
The relative size of the and cross sections to those of the light charmed mesons is important for measuring the total charm cross section. The data of Table 1 from E769 indicate that the cross sections for and production are comparable to those of and . This is also supported by earlier data from CERN experiment NA32 (ACCMOR) which are compared to those from E769 in Table 2. Thus, it appears that all charm species have comparable cross sections. The summed cross sections for all charm particles is at least a factor of three more than the central NLO QCD prediction.
| NA32 | E769 | |
|---|---|---|
Another new result from E769 is the measurement of differential charm cross sections in and for pion, kaon and proton beams . As we will see, the cross sections are affected by the parton distributions in the different beam particles.
For the E769 measurements, in each bin of the variable of interest ( or ), the cross section is summed as in equation (5). (The summation increases the statistical power of the measurement.) The measurements for are shown in Figure 7. Also shown are the NLO QCD predictions for charm quark production from pion and proton beams. (The predictions are normalized to best fit the data; the shape of the prediction has no constraints from the data.) It is clear that the expected shape for the proton beam is steeper in than for the pion beam. Indeed, the and data are not consistent with having the same shape (C.L. 99%). Furthermore, the and data are well fit by the predicted shapes (C.L. 50%). Thus, it appears that the dependence shows the expected effect of the beam parton distribution.

Although there is no prediction with a kaon beam, the data for pion and kaon beams are consistent with having the same shape (C.L. 95%). This indicates that the pion and kaon have similar parton distributions.
The differential cross sections in are shown in Figure 8. The pion beam data are consistent with the NLO QCD prediction for a pion beam, but inconsistent with the prediction for a proton beam. The difference in the distributions for pions and protons is evident, although not as distinct as that for the distributions.

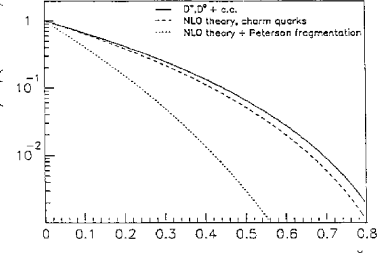
One of the puzzles of charm particle production is that shapes of the differential cross sections in and are so close to the NLO QCD predictions for charm quarks. This is certainly not the case in production, where the effect of fragmentation is substantial. Indeed, if the Peterson fragmentation function is used to modify the NLO QCD result for charm quark hadroproduction, the shape of the prediction falls much too rapidly compared to the data as shown in Figure 9. Perhaps loss of charm quark momentum from fragmentation is counterbalanced by an acceleration from interaction with spectator quarks.
4 Open Beauty
In contrast to measurements of the charm cross section, most measurements to date of the beauty cross section rely on partial reconstruction techniques, as did charm measurements of a decade ago. Many of these earlier charm measurements suffered from systematic errors due to the assumed models of production and decay dynamics. This history provides a lesson for the current measurements of beauty production. For the measurements based on partial reconstruction techniques, systematic errors in the beauty quark pair cross section are difficult to avoid from model dependent assumptions about the production and decay dynamics.
4.1 Fixed Target Beauty Experiments
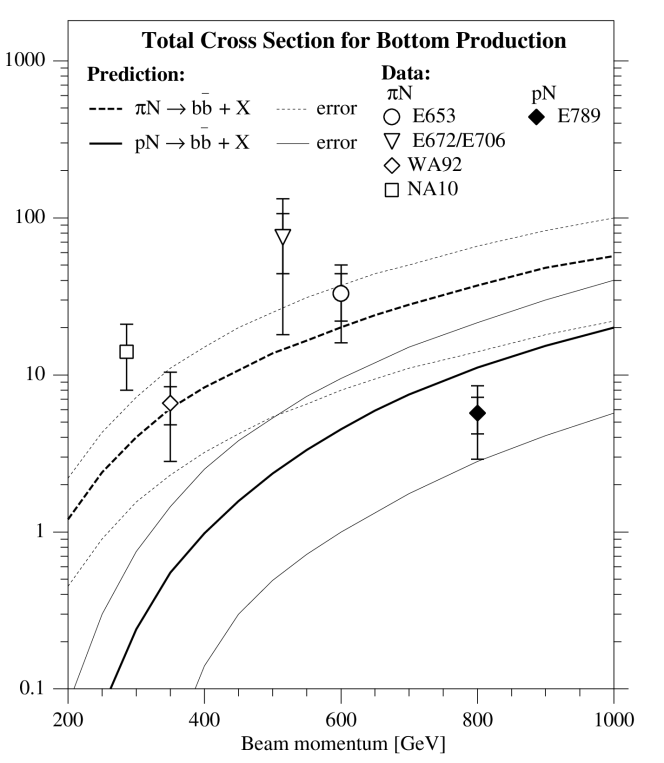
A variety of partial reconstruction techniques have been employed to measure the cross section in fixed target experiments. The experiments and techniques employed are listed in Table 3. The measurements, which are plotted in Figure 10, have large uncertainties, but generally lie at or above the central values of the QCD prediction.
| Experiment Name | Technique |
|---|---|
| CERN NA10 | tri muon |
| FNAL E653 | nuclear emulsion |
| FNAL E672/E706 | inclusive with detached vertex |
| FNAL E789 | inclusive with detached vertex |
| CERN WA92 | silicon active target |
4.2 Measurements at the Tevatron
At the Fermilab Tevatron collider, a well established technique to measure the beauty cross section is via the inclusive cross section for single high leptons. A recent measurement by the D0 experiment, using muons, is shown in Figure 11 as well as earlier measurements from CDF. Plotted is the cross section for a quark as a function of the minimum of the quark. The plotted cross section is derived under the assumption of the ISAJET model relating the of the lepton to that of the parent quark. The model takes into account the momentum fragmentation of the quark, the speciation into hadronic particles and the decay kinematics of those hadrons. Since few of these processes have been measured, systematic errors are inherent. The quark cross sections extracted from both experiments (using the same production model) are consistent with theory, but fall along the upper range of the theoretical uncertainty.

Beauty cross section measurements based on exclusive decay modes of specific particles avoid some of the model dependence of the measurements derived from inclusive lepton production. The CDF experiment has measured the cross sections for the production of and through the decay modes and with . Invariant mass plots for these decays, for different momentum ranges of the parent , are shown in Figure 12. Analysis cuts include those based on the and masses and proper lifetime greater than .

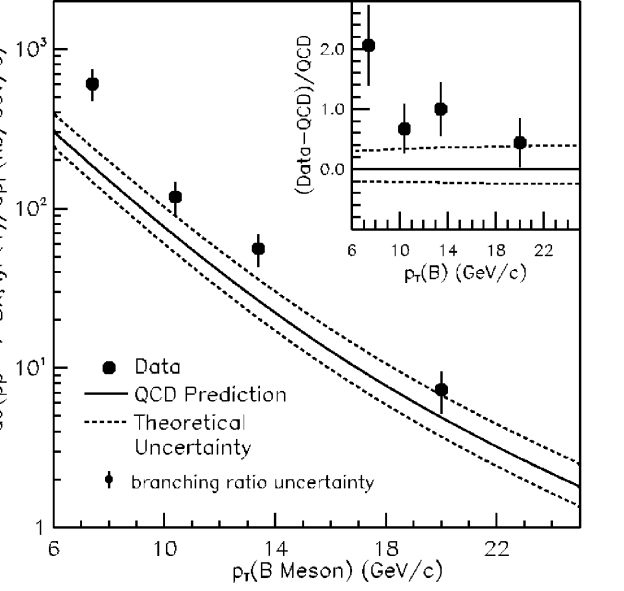
The signals for the two decay modes in Figure 12 are combined to measure an “average meson” differential cross section, shown in Figure 13. The measured differential cross section is consistent with the upper range of the theoretical prediction. Thus, this result shows the the same qualitative effect as the cross section extracted from the inclusive lepton method. Integrated over the range GeV and for , the average meson cross section is b.
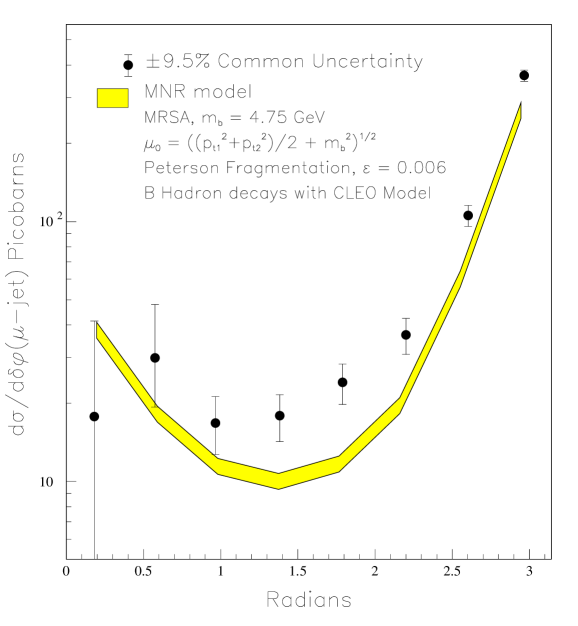
Yet another type of measurement is available as a check on the inclusive lepton and exclusive decay methods discussed above. This (third) method is the measurement of the associated pair where the muon is tagged from one quark and the jet is tagged from the other. This process has a distinct signature in the plane transverse to the line of collision. The and quarks emerge nearly back to back, the deviation from collinearity being due to the transverse momentum of the initial state partons, for example, the gluon pair. When the quark fragments, the muon tends to retain the direction of the quark. Thus, the muon and jet from the accompanying quark have a relative angular distribution, , in the transverse plane that peaks at radians. The differential cross section for from the CDF experiment is shown in Figure 14. The shape of the cross section is in reasonable agreement with the QCD prediction shown, but the data lie above the QCD prediction in absolute value. Thus it appears from a variety of measurements that the available QCD predictions underestimate the absolute cross section while being in good agreement with the shape of differential cross sections.
Measurement of the total beauty cross section requires measurements for both beauty mesons and baryons. Information on baryon production is just now becoming available. The CDF collaboration has studied the decay chain
| (6) |
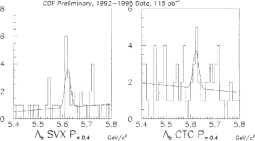
The charged tracks are required to have GeV. Vertex requirements are placed on the ,, and . Cuts are also placed on the reconstructed masses of the and . A signal of events is visible in the invariant mass plot for shown in Figure 15, on the left, for muon tracks measured with vertex detector hits.
The cross section for can be measured, under certain assumptions, by comparing the measured signal for with the signal for . Both signals have similar topologies in the detector. From the signal sizes and acceptances it is found that,
| (7) |
Assuming that,
| (8) |
and using,
| (9) |
which is consistent with the measured value, gives,
| (10) |
To the extent that we consider the later to be reasonable, the assumed ratio of cross sections is also reasonable and hence provides a rough estimate of the cross section.
5 Quarkonia
5.1 Theory
The ‘quarkonia’ are bound states of a heavy quark and its anti- quark. Charmonium is a state and bottomonium is a state. The states are further characterized by their spin, orbital angular momentum and radial quantum numbers. The charmonium states are the and family; the bottomonium states are the family. These states have quantum numbers .
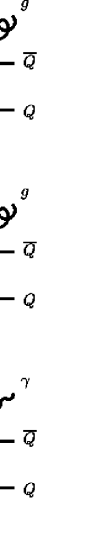
The theory of the hadroproduction of quarkonia is discussed in recent papers by Braaten and Fleming and Cho and Leibovich . The odd charge conjugation quantum number of the states leads to a fundamental restriction on their production in gluon collisions. The simple process is not allowed since gluons have . However, a similar production process is allowed in which a gluon is radiated from a final state quark line, as shown in Figure 16(a). This diagram is of order . If the intermediate state is a color singlet , this process is called direct color singlet production. But, the intermediate state need not be restricted to a color singlet.
The intermediate state may be a either a color singlet or octet . Furthermore, the intermediate state can be have the full range of quantum numbers . Thus, the general process,
| (11) |
is possible for the production of the and families. Examples of the intermediate state are , , and . An example of direct color octet production is shown in the diagram of Figure 16(b).
A third important process, also of order , involves the direct production of the states which are characterized by and the quantum numbers . Since , can be produced directly from a two gluon collision, without the emission of a final state gluon, as shown in Figure 16(c).
The () and () states have large branching fractions into . Thus, these states can be studied experimentally by detecting the alone or both final state particles. However, the () has a small branching fraction into and hence cannot be easily studied.
From inspection of the simple production diagrams considered above, it is evident that production has the most straightforward theoretical treatment. There is no soft gluon emission required in the fundamental production process, and furthermore, there is no fragmentation process as for a state with open charm or beauty. Direct or production is complicated by the emission of the soft gluon required by conservation of charge conjugation parity of the strong interaction.
5.2 Charmonium
The was co-discovered in a hadronic fixed target experiment and has since been studied in that way with high statistics. A number of results have been reported recently from Fermilab fixed target experiments using high energy and proton beams. As an illustration, we consider the measurement of and production from Fermilab experiment E789 which used the extracted 800 GeV proton beam.
The invariant mass plot from E789 is shown in Figure 17. Of particular note is the large number of signal events allowing for detailed studies of the and dependence of the production cross section.

The differential cross section in for is shown in Figure 18. Also shown are predictions from a computer program of Mangano based on leading order QCD. Shown separately are the contributions to the cross section from direct production and from the decay of states. The sum of the contributions seems to fit the data well. But actually the curves shown are 7 times the prediction! Thus, the theory predicts the shape reasonably well but severely underestimates the absolute scale of the cross section. This situation is even more dramatic for production.

The E789 measurement of for is shown in Figure 19. A multiplicative factor of 25 is required for the leading order prediction to match the scale of the data. Like the , the shape of the prediction for is in reasonable agreement with the data.

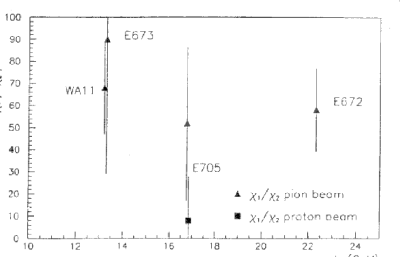
As mentioned in the theory section, measurements of production are important because of the firmer theoretical understanding of versus vector meson quarkonium production. Unfortunately, the measurement of the photon is typically inefficient in detecting the decay . A review of fixed target data on production is given by McManus . One simple prediction is that the ratio of cross sections for and is given by spin counting. Thus, one expects,
| (12) |
Data for this ratio from various experiments are plotted in Figure 20. Within the large statistical errors, the data are indeed consistent with the simple spin counting prediction. This result is consistent with the picture that leading order QCD processes are sufficient to explain production.
There have also been recent measurements of charmonium production from the Tevatron Collider. The CDF collaboration has reported preliminary measurements of the differential cross sections for and production. The data for the cross section times branching fraction for , versus of the is shown in Figure 21. The contribution of from decay is eliminated using vertex information. The contribution of from decays is measured separately by explicit reconstruction of the decay . The measured cross section for prompt production (including the small contribution from decays) is given by the open triangles. The perturbative QCD prediction, which is dominated by the contribution from production, underestimates the data by a factor between 5 and 10 over the range measured. Thus, the situation at ECM = 1.8 TeV is remarkably similar to that of the fixed target data at ECM = 0.04 TeV. Note also that the CDF measurement of from decay is in reasonable agreement with the QCD prediction.

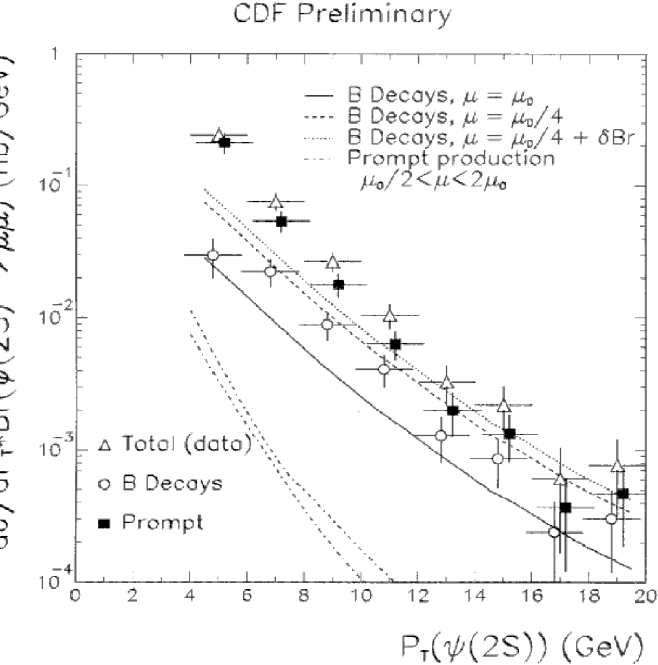
The CDF measurements for production are shown in Figure 22. The prompt data points are the solid squares. The QCD prediction for prompt production is the area between the dash-dotted lines. The data and theory disagree in both shape and normalization. At the lowest the prediction is at least 20 times too low. As increases, the discrepancy gets even larger. These results, along with those at fixed target energies, indicate that non-perturbative processes (such as the soft gluon emission shown in Figure 16) play an important role in prompt and production.
Explicit reconstruction of has also been accomplished with the D0 experiment at the Fermilab Tevatron. The signal can be seen in Figure 23 which shows the distribution of the difference in invariant mass between the reconstructed and the candidate combinations. Note that the resolution is not sufficient to resolve the states as is possible in fixed target experiments. It is found in D0 that the fraction of ’s originating from is,
| (13) |
That this ratio is far from one indicates that the bulk of production is direct and not from decay. This reinforces the importance of the non-perturbative process of direct production.

5.3 Production
The was discovered using fixed target hadroproduction and has now been well measured at the Fermilab Tevatron collider. An invariant mass spectrum for from CDF is shown in Figure 24. The experimental resolution is good enough to see separate peaks for the , and radial states. The differential cross sections in for these particles are shown in Figure 25. Also shown are the predictions of the color singlet model of Cho and Leibovitch. The prediction includes direct production and feeddown from . The predictions fall below the data for the three particles shown. For the , the shape of the prediction is not in agreement with the data. Thus, it appears that the theoretical treatment of the production of the bottomonium states suffers the same difficulty as for the charmonium states: nonperturbative effects are likely important.


6 Concluding Remarks
In this review, we’ve examined both open and closed charm and beauty states produced at energies spanning nearly two orders of magnitude (0.02 TeV to 1.8 TeV). Experimental accomplishments include measurements of fully reconstructed particles yielding normalized cross sections and their dependence on transverse and longitudinal momentum. For the open states, perturbative QCD calculations are successful in explaining the shapes of the differential cross sections but underestimate the scale of the cross sections by factors of 2-3. Furthermore, the theoretical predictions are too sensitive to variations in the underlying parameters of the theory, such as the scales of renormalization and factorization. This leads to theoretical uncertainties in the cross section scale of order of the difference between the measurement and prediction.
The picture emerging for quarkonia production is that for the and families the production mechanism is fundamentally non-perturbative. This is evidenced by the large discrepancy between the measured cross sections and those predicted using QCD perturbation theory. However, measurements of production seem to be reasonably explained as due to perturbative processes.
Future experiments promise progress in several areas. The Tevatron collider experiments will continue to study production of open beauty, and both charm and beauty quarkonia. LHC experiments will open a new energy regime. A new fixed target experiment, SELEX, is underway at Fermilab using and proton beams. The COMPASS experiment is planned for the future CERN fixed target program using a hyperon beam. The HERA-B experiment is under construction at DESY and will study fixed target production.
The challenge to theorists is to tame the theoretical errors in perturbative QCD calculations with new approaches to factorization and renormalization. Models that can treat the fundamentally non-perturbative processes in quarkonia production and in fragmentation of heavy quarks would be an important tool to assess whether “new” physics is required.
The hadroproduction of charm and beauty particles serves as one of the testing grounds for QCD. Hadronic collisions also provide a copious source of heavy quarks, allowing us to study their spectroscopy and decay with great precision. However, we must understand the production characteristics well to achieve precision in the decay measurements. These incentives spark our interest in future work in this field.
Acknowledgments
The author appreciates helpful discussions with Prof. James Johnson of Wayne State University. Thanks to Prof. Kwong Lau of the University of Houston for providing Figure 10. Prof. Stephen Takach of Wayne State generously provided a careful reading and critique of the manuscript. The author is grateful for funding from Wayne State and the United States Department of Energy.
References
References
- [1] P. Nason, S. Frixione and G. Ridolfi, in Proceedings of Physics in Collision, (1995), also CERN-TH/95-256.
- [2] G. Alves et al. (E769 Collaboration), Phys. Rev. Lett. 77, 2388 (1996).
- [3] G. Alves et al. (E769 Collaboration), Phys. Rev. Lett. 77, 2392 (1996).
- [4] S. Barlag et al. (NA32/ACCMOR Collaboration), Phys. Lett. B 247, 113 (1990) and Z. Phys. C 49, 555 (1991).
- [5] Z. Wu, Ph.D. thesis, Yale University, 1991, unpublished.
- [6] P. Nason et al., Nucl. Phys. B 327, 49 (1989).
- [7] S. Abachi et al. (D0 Collaboration), Phys. Rev. Lett. 74, 3548 (1995).
- [8] F. Abe et al. (CDF Collaboration), Phys. Rev Lett. 75, 1451 (1995).
- [9] CDF Collaboration, Phys. Rev. D 53, 1051 (1996).
- [10] CDF Collaboration, web page, http://www-cdf.fnal.gov/.
- [11] E. Braaten and S. Fleming, Phys. Rev. Lett. 74, 3327 (1995).
- [12] P. Cho and A. K. Leibovich, CALT-68-2026, April, 1996.
- [13] E672/E706 Collaborations, Phys. Rev. D 53, 4723 (1996).
- [14] E771 Collaboration, Phys. Lett. B 374, 271 (1996).
- [15] E789 Collaboration, Schub et al., Phys. Rev. D 52, 1307 (1995).
- [16] A. McManus in Heavy Quarks at Fixed Target, ed. B. Cox (INFN, Frascati, 1994).
- [17] G. Bauer (CDF Collaboration), FERMILAB- Conf- 95/055-E (1995).
- [18] S. Abachi et al. (D0 Collaboration), Phys. Lett. B 370, 239 (1996).
- [19] F. Abe et al. (CDF Collaboration), Phys. Rev. Lett. 75, 4358 (1995).