TIFR/TH/97-07 March, 1997 hep-ph/9703300
Is there Anomalous Suppression
in Present-day Heavy-ion Collisions?
R. V. Gavai111E-mail: gavai@theory.tifr.res.in and Sourendu Gupta222E-mail: sgupta@theory.tifr.res.in,
Theory Group, Tata Institute of Fundamental Research,
Homi Bhabha Road, Bombay 400005, India.
We re-analyse the data on cross sections for proton-nucleus and nucleus-nucleus collisions obtained by the CERN experiments NA38, NA51 and NA50. Our systematic analysis of error propagation shows that the no anomalous suppression of in Pb-Pb collisions can be substantiated at 95% confidence limit. The significance of the NA50 result would be enhanced by more precise p-A data on cross sections.
Recently the NA50 experiment at CERN announced an anomalous suppression of in Pb-Pb collisions at a beam energy of 158 GeV/nucleon [1, 2]. Such an observation had earlier been proposed as a signal for the formation of a quark-gluon plasma (QGP) [3]. In view of the implications of this observation, we reanalyse the CERN data in this paper, taking into account many obvious sources of uncertainties. We conclude that the data do not yet bear the claim they are asked to support.
The NA50 experiment as well as the NA51 and NA38 experiments have taken data on production in proton-nucleus collisions with beam energies of 450 and 200 GeV, and in nucleus-nucleus collisions at beam energies of 200 and 158 GeV/nucleon. The CM energies in equivalent proton-proton collisions are , and GeV. The acceptance region, , for the data analysed in [1, 2] is (where is the rapidity of the in the CM frame of colliding protons at the same ) and (where is the angle of the decay muon in the Collins-Soper frame).
The analysis consists of the following steps—
-
1.
All the data on the cross section per nucleon () are rescaled to 200 GeV beam energy, using a fit to previous data on the energy dependence of this cross section. The 158 Gev data are rescaled by a factor and the 450 GeV data by the factor .
-
2.
The rescaled data, at a common GeV, are extrapolated to , through a multiplicative factor of 2.
-
3.
The resulting cross section is extrapolated to the full forward hemisphere, , or equivalently, by multiplying by .
-
4.
The rescaled data in the forward hemisphere are fitted to a power-law
(1) where is the branching ratio for , and is the effective mass number, given by the product of the mass numbers of the projectile and target.
It is found that the data obtained from light ions (O-Cu, O-U and S-U) lie on the fitted line, whereas the Pb-Pb data lie far below. While the full procedure outlined above is used in [2], the steps 2 and 3 are not performed in [1]. However, the extrapolation in in both [1, 2] uses a fit to the world data for and full coverage in .
We note that there are uncertainties in every step of this procedure, and also in the order in which these steps are to be performed. Each such uncertainty is a source of error which must be combined with the statistical and systematic errors in the Pb-Pb data. We present three seperate analyses. First we accept the extrapolation in step 1 of the NA50 analysis [1] and examine only the error in step 4 above. The Pb-Pb data is seen to be consistent with the p-A data at the 95% confidence level (CL). Next we analyse the errors due to steps 1 and 4 only. Note that when the extrapolations are performed by NA50 [1], the errors in the extrapolations in steps 2 and 3 are not needed in estimating the confidence limits of the final result. Again the p-A and Pb-Pb data are consistent at the 95% CL. Finally, we examine the situation when steps 2 and 3 are performed before step 1, and combine the errors in each of these four steps. The p-A and Pb-Pb data are once again seen to be consistent at the 95% CL.
Since we shall repeatedly have to propagate errors, we outline the usual statistical procedure for this [4]. If the expectation values of a set of variables, , are known along with their full covariance matrix, , then the errors in any function of these variables, can be easily written down. Recall that the diagonal elements of the covariance matrix are simply related to the errors, . The off-diagonal elements can be used to extract the normalised correlation coefficients . These lie in the range . If is a linear function of the , then , and the error
| (2) |
Note that when the correlations vanish, this reduces to the usual formula for adding errors in quadrature333When is not a linear function, the expectations and errors can be obtained either under the assumption of a multivariate Gaussian distribution of the , or by a detailed bootstrap or Monte Carlo [5]. In this paper we will not need to use a non-linear function .. In the succeeding analysis it will turn out that we often have information on the full covariance matrix. As a result, we can easily evaluate the formula in eq. (2). In the exceptional cases when we have no knowledge of the off-diagonal elements, we will choose them (by choosing ) to minimise the errors. This would give the best possible statistical significance to the result.
We begin by examining the errors involved in step 4 above. The form in eq. (1) is linearised by taking the logarithm of both sides. A fit is performed using the p-A data listed in [2] obtained by rescaling to a common GeV. The result of this fit is—
| (3) |
Note that the value of is exactly the same as quoted [1, 2] by NA50. Following exactly the NA50 analysis [1], in Figure 1 we show the best fit line to the data along with the error bands about this fit line (using eq. 2). The prediction for Pb-Pb collisions is nb. The measured point, nb, is then within of the extrapolation. Note that the extrapolation errors are more crucial than the statistical errors on the Pb-Pb cross section. As a result, the suppression observed by NA50 is indicative, but not a quantitative proof of the existence of new physics, such as the QGP.

The assumption that O-Cu, O-U and S-U collisions do not yield a QGP can be used to make a similiar statement. With this assumption, these three extra points are included in the fit. Then we find
| (4) |
The prediction for Pb-Pb collisions is nb. The measured point is then less than away from the prediction. The extra assumption makes the observation stronger.
We turn now to the second analysis. Recall that the rescaling of energy is performed using a fit to data on the dependence of cross sections in the full forward hemisphere, using a formula discussed later. We have no reason to believe that the two ratios
| (5) |
are equal. The higher the energy, the larger is the allowed range of , and the slice is consequently a smaller part of the full phase space. For the same reason, the orders in which the two extrapolations are performed may give different results. However, cuts on are not expected to change these ratios provided they are identical for the numerator and denominator.
Since we do not have data on the dependence of , we use models to extract . We have at our disposal the colour evaporation model [6] and the colour octet model [7]. Both give a reasonably good description of the dependence of as well as the distribution in (or ). For details we refer the readers to [8, 9]. In Figure 2 we show the ratio obtained in these models using several different sets of modern structure functions. Note the good agreement among the models and the structure function sets. The results shown in the figure translate to
| (6) |
where the central values are the averages over the model predictions and the errors are the range of errors under variation of the structure function set. These ratios and their errors may also be obtained from data if they are available.

If the procedure followed by the NA50 group is adopted, then the errors from the recaling of energy must be compounded with the statistical errors on the data. We can add these errors in quadrature since the errors in are independent of the statistical errors in the NA50 and NA38 experiments. In addition, the errors in the fits to the nuclear effects must be included as before. The extrapolation to the full forward phase space is a common multiplicative factor for all the data, and is unnecessary for the comparison. Again our conclusions will therefore apply to both Refs. [1] and [2]. Using this procedure, we find that the extrapolation of the p-A data to Pb-Pb is nb, whereas the measured value after rescalings is nb. Thus the Pb-Pb data is within of the extrapolation from the p-A data.
We move on to the third analysis. Recall that the Collins-Soper frame is the rest frame of the decaying particle with the -direction chosen such that the spin is aligned in this direction if the helicity is positive. Then, in this frame, the angular distribution of the decay leptons coming from any massive vector particle (either for the Drell-Yan process or any vector quarkonium) should be , when strong interaction corrections are neglected. Then the extrapolation from to the full acceptance is a factor for both Drell-Yan and vector quarkonium production, independent of .
The NA50 group uses this factor for Drell-Yan cross sections, but a factor 2 for . Since this is an overall factor, it does not affect the present analysis. However, in any comparison of Drell-Yan and cross sections, the correct factor444 After this paper was written we were informed by some members of the NA50 collaboration that data on production at lower energies shows a flat angular distribution, suggesting 2 as the appropriate rescaling factor. must be used. It should also be recalled that QCD corrections change this distribution. The modification can be written as a series in the strong-coupling, , multiplying . The first term in this series is 1 for all vector particles, but the subsequent terms may be different for and . Then the extrapolation uncertainty in the ratio of Drell-Yan and cross sections is of the order of .
There remains the question of extrapolation from to (or equivalently, ). Many experiments [10] have parametrised the distribution in the form . Using this form, and the range of errors quoted, we find that
| (7) |
In order to obtain these scalings at the values of we need, we could use a parametrisation of the dependence of the exponent fitted in the form [11]
| (8) |
However, this gives results at variance with those in eq. (7). This might be due to fitting too simple a functional form to the data. On the other hand, the colour octet model calculations yield numbers in reasonable agreement with eq. (7) and the actual value used by the NA50 analysis [2] at GeV. We find
| (9) |
The third analysis may be performed by doing the extrapolation from to the forward hemisphere first, and then using the available data on the energy dependence of to bring all the data to a common value of . In this case the errors in eq. (9) must be combined with the error in energy extrapolation.
The rescaling of with is performed by a fit of the form [11]
| (10) |
to data on the total forward cross section at different . The problem is linearised by taking logarithms on both sides of this equation. Taking GeV, [11] reports the best fit to be555Using the data collected in Table 8 of [11] and using MINUIT without linearising the problem, we get somewhat different values of the parameters— nb and . This evidently increases the errors quoted below on the quantity .
| (11) |
These numbers were obtained by fitting both p-p and p-A data. Nuclear effects in the p-A data were eliminated by assuming in [11]. The formula in eq. (10), with the values in eq. (11), was used by the NA50 group to compute the rescaling in [1, 2]. We find
| (12) |
where the error in depends only on the error in . Possible systematic errors in this extrapolation can be investigated by changing the form in eq. (10). In particular, at larger energies, one should take into account the expected rise in cross sections as (roughly) .

Using eqs. (9) and (12), along with a scaling factor of for the extrapolation of the Collins-Soper angle, we find that
| (13) |
Recall that the factor of is a common overall factor, and hence its value or error is immaterial to the following analysis. The errors in the coefficients in eq. (13) are independent of the measurements of the NA38, NA50 and NA51 experiments. Hence they may be added in quadrature to the statistical errors on the data. When the data are scaled in this fashion, the fit of the form in eq. (1) becomes
| (14) |
Although the value of decreases, it still remains consistent with the E-789 extraction of [12]. The scaling of the CERN data, however, is a little stronger than that observed by the E-772 experiment666The comparison of all these values of is a measure of the systematic uncertainty in this quantity. One can assign the value to the systematic error on . which sees [13]. The comparison of the extrapolation of this data with the Pb-Pb cross section is shown in Figure 3. Note that the cross section for production in Pb-Pb collisions is still consistent with those for p-A collisions at the level.
If the light-ion data is included in the fit to the form in eq. (1), by making the assumption that there is no new physics seen with light-ions, then the fitted parameters become
| (15) |
With this extra assumption, the extrapolated line fails to agree with the Pb-Pb data at the level, but remains consistent at the level.
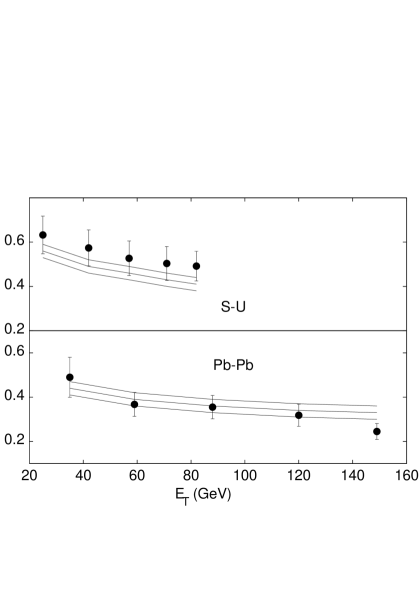
The experiments have more information than just the total cross section. In particular, they measure the transverse energy, , dependence of the cross section. A quantitative analysis [14] found that the well-known absorption mechanism can account for the dependence in S-U collisions, but not in Pb-Pb collisions. This analysis uses the survival probability of the , defined by the ratio
| (16) |
where the cross sections have been scaled to a common and the full forward hemisphere, by the prescription of NA50 [2]. It was found that, for Pb-Pb collisions, the data point at the lowest agrees with a Glauber description, but the remaining points fall below the prediction [14].
This analysis could also be redone in a fashion similiar to our analysis of the total forward cross sections. Figure 4 shows the data points which are scaled as in the second analysis (eq. 6). All data agree with the Glauber model at the level. The fit to the S-U data is not as good as before; although remaining consistent at the level it seems to lie systematically above the Glauber model prediction. The Pb-Pb data agree much better, with the sole exception of the point at highest . This point agrees with the model only at the level. When eq. (13) is used for the rescalings, both the S-U and Pb-Pb data lie systematically below the Glauber model predictions, although being consistent at the level. In either case, the Glauber model does equally well (or badly) in explaining the dependence of both the S-U and Pb-Pb data.
In conclusion, we find little statistical significance for an anomalous suppression of cross section in Pb-Pb collisions at the CERN SPS energy. In our analysis, the uncertainties are dominated by the errors due to the extrapolation of the usual nuclear effects in p-A collisions to Pb-Pb. Clearly, reduced errors on the p-A cross sections would enhance the statistical significance of the deviations seen by NA50. The importance of controlling nuclear effects was first pointed out in [15]; it continues to be an important problem. Even in future experiments at the RHIC and LHC, the p-A data will always serve as a baseline of “known physics”. We feel that the worldwide heavy-ion effort must be supplemented by an effective study of the systematics of p-A collisions. Unless improved data from p-A collisions are available, interpretations of data from present and future heavy-ion colliders may be plagued by uncertainties of the kind we have pointed out.
References
- [1] M. Gonin et al. (NA50), Report at the Quark Matter 1996, Heidelberg, Germany, Nucl. Phys., A 610 (1996) 404c.
- [2] C. Lourenço, Report at the Quark Matter 1996, Heidelberg, Germany, Nucl. Phys., A 610 (1996) 552c.
- [3] T. Matsui and H. Satz, Phys. Lett., 178 B (1986) 416.
- [4] See for example, J. R. Green and D. Margerison, Statistical Treatment of Experimental Data, Elsevier, Amsterdam, 1978.
- [5] B. Efron, SIAM Rev., 21 (1979) 460.
-
[6]
H. Fritzsch, Phys. Lett., B 67 (1977) 217;
F. Halzen, Phys. Lett., B 69 (1977) 105. -
[7]
G. T. Bodwin, E. Braaten and G. P. Lepage,
Phys. Rev., D 51 (1995) 1125;
E. Braaten, M. A. Doncheski, S. Fleming and M. Mangano, Phys. Lett., B 333 (1994) 548;
D. P. Roy and K. Sridhar, Phys. Lett., B 339 (1994) 141;
M. Cacciari and M. Greco, Phys. Rev. Lett., 73 (1994) 1586. -
[8]
R. V. Gavai, D. Kharzeev, H. Satz, G. A. Schuler, K. Sridhar
and R. Vogt, Int. J. Mod. Phys., A 10 (1995) 3043;
J. Amundson, O. J. P. Eboli, E. M. Gregores and F. Halzen, Phys. Lett., B 390 (1997) 323. -
[9]
S. Gupta and K. Sridhar, Phys. Rev., D 54 (1996) 5545;
M. Beneke and I. Rothstein, Phys. Rev., D 54 (1996) 2005;
S. Gupta and K. Sridhar, Phys. Rev., D 55 (1997) 2650. -
[10]
H. D. Snyder et al., Phys. Rev. Lett., 36 (1976) 1415;
K. J. Anderson et al., Phys. Rev. Lett., 37 (1976) 799;
J. G. Branson et al., Phys. Rev. Lett., 38 (1977) 1331;
K. J. Anderson et al., Phys. Rev. Lett., 42 (1979) 944;
E. J. Siskind et al., Phys. Rev., D 21 (1980) 628. - [11] G. A. Schuler, preprint CERN-TH.7170/94, February 1994.
- [12] M. H. Schub et al., Phys. Rev., D 52 (1995) 1307.
- [13] D. M. Alde et al., Phys. Rev. Lett., 66 (1991) 133.
- [14] D. Kharzeev, C. Lourenço, M. Nardi and H. Satz, preprint CERN-TH/96-328, hep-ph/9612217.
- [15] R. V. Gavai and S. Gupta, Phys. Lett., B 216 (1989) 239.