Diffraction at HERA
Abstract
Recent results on diffraction at HERA, as measured by the H1 and ZEUS collaborations, are reviewed. Results on the photon-proton total hadronic cross section, on vector meson production both at small and large photon virtuality and on photon diffraction are presented. The experimental signature of diffraction at HERA, as well as the selection methods used by the two collaborations are explained.
1 Introduction
Photon-proton collisions have been extensively studied in fixed target experiments up to centre of mass energies, , of about 20 GeV, using both real and virtual photons. At the HERA collider at DESY, 820 GeV protons collide with 27.5 GeV electrons or positrons. The HERA physics program is very rich, ranging from non-perturbative to perturbative QCD, heavy-flavour physics and to the measurement of the quark and gluon densities in the proton and in the photon. Two general purpose detectors, H1[1] and ZEUS[2] , operate at HERA and are instrumented with high resolution calorimeters and tracking chambers.
The results presented here have been obtained using data collected during 1994 and 1995, for a total of about . More detailed presentations on individual subjects can be found in many proceedings[3] .
2 Diffraction and total cross section
Historically, hadronic diffraction processes and total cross sections have been described using the concept of ‘pomeron exchange’. The simplest way to introduce the concept of pomeron is within the framework of Regge theory[4, 5] . Consider the example shown in Fig. 1: where t is the 4-momentum transfer. According to quantum numbers conservation, this reaction might happen via the exchange of a virtual hadron. If the values of the masses and spins of these particles are plotted on the right hand side of the spin-t plane (where t is positive), they lie almost on a straight line determining a ’trajectory’ of particles. The general expression for a straight line trajectory is:
where is the intercept and the slope. The most important trajectories are approximately linear with a universal slope Ge; the first particle on a trajectory gives the name to the trajectory itself (in the above example the trajectory is exchanged). Regge theory predicts that the properties of a t-channel reaction (that happens on the left hand side of the spin-t plane, where t is negative, via the exchange of off mass shell particles), for example, are determined by the parameters of the trajectory formed by the exchanged particles on the right hand side of the spin-t plane (the trajectory in the case above).
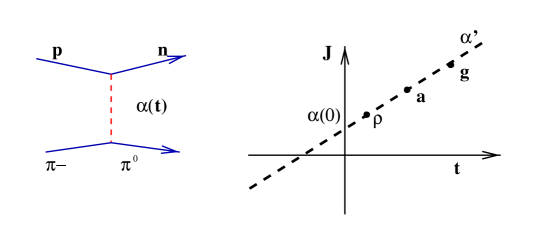
Let’s consider the dependence of the total cross section (a t-channel process) with the square of the centre of mass energy s. According to Regge theory it is parametrized as:
| (1) |
where , are the intercepts of the trajectories exchanged. Using only two main trajectories, for have been fitted by Donnachie and Landshoff [6] with an expression of the form:
where are parameters which depend on the exchanged field. The first trajectory, called pomeron trajectory, has intercept while the second term, which represents an effective meson trajectory, has intercept . At high enough energy, only the pomeron term is important. The pomeron, identified as the first particle of the pomeron trajectory, is responsible for the rise of the total cross section as a function of the centre of mass energy. Since the bulk of the processes contributing to the total cross section has very small , the pomeron exchanged in these reactions is called ‘soft pomeron’. The soft pomeron trajectory has intercept and slope Ge.
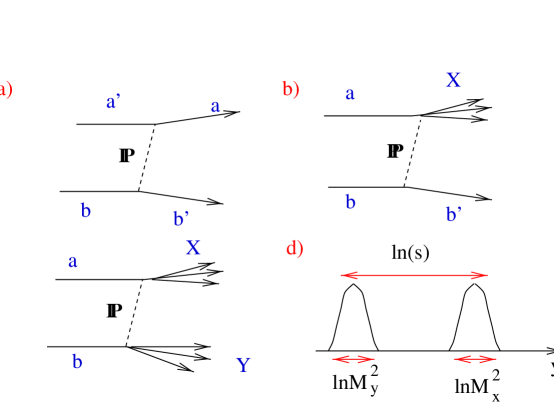
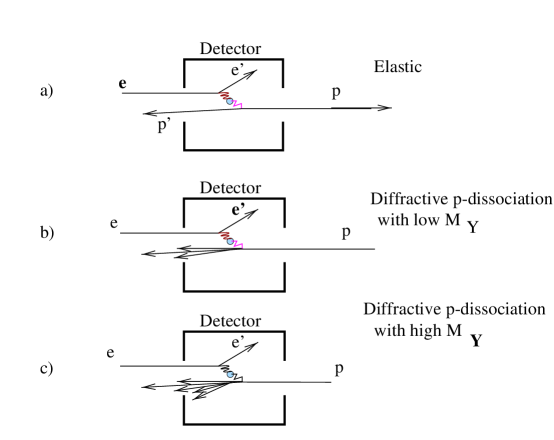
Fig. 2 schematically shows three different types of diffractive reactions: elastic scattering (a), single diffraction (b), where one of the incoming particle dissociates, and double diffraction (c), where both incoming particles dissociate. In diffractive scattering the hadronization of the final states X and Y with masses happens independently, as shown in Fig. 2(d). If the centre of mass energy is large enough (ln(s) ), then there is a gap in rapidity between X and Y.
3 Total cross section at HERA
The values of the total hadronic cross section at HERA as measured by the H1 [7] and ZEUS [8] collaborations are shown in Fig. 3 together with a compilation of low energy results. The Donnachie and Landshoff parametrizations including (dotted line) or not (solid line) recent CDF [9] results and the ALLM [10] parametrization (dashed line) are also shown.
| Experiment | range | |
|---|---|---|
| ZEUS | b | |
| H1 | =200 | b |
The HERA data are in agreement with these predictions and therefore with the assumption that also at HERA ‘soft’ pomeron exchange is responsible for the increase of as a function of the centre of mass energy.
The diffractive cross section represents a large fraction of the total cross section: at HERA, for example,
the diffractive and non diffractive parts are, according to the H1 collaboration [7] , b and b, giving , while according to the ZEUS collaboration [8]
.

4 Kinematics of diffractive events at HERA
In Fig. 4, a diagram for diffractive ep scattering is shown. A photon with virtuality is emitted at the electron vertex∗*∗* The symbol is used for quasi real photon while the symbol is used for virtual photon. . Depending on the value of , the events are divided into two large families: photoproduction, for Ge, and deep inelastic scattering (DIS), for Ge. is defined as the centre of mass energy squared of the ep system while is used to indicate the centre of mass energy of the virtual photon-proton () system. At large , in the frame where the proton has infinite momentum, the variable = represents the fraction of the proton longitudinal momentum carried by the struck quark. In the proton rest frame, equals the fraction of the electron energy transferred to the proton.
In addition, diffractive events are described by the following variables: t, the square of the four-momentum transfer at the proton vertex and , the momentum fraction of the pomeron in the proton.

If the reaction is elastic or single diffractive (or photon diffraction as sometimes single diffraction is called for the HERA regime), then the quantities t and can be determined either from the scattered proton or from the system .
If the longitudinal and transverse momentum of the scattered proton, , are measured, then and t are calculated as:
| (2) |
| (3) |
where is the proton mass. If the proton is not observed, a measurement of can be obtained as:
| (4) |
where is the mass of the system X. t can be reconstructed from the system X only for some exclusive reactions, such as vector meson production, where the resolution on is accurate enough.
5 Experimental signature of diffraction at HERA
One of the main issues concerning diffraction at HERA is the experimental method to separate diffractive from non-diffractive events. For some exclusive reactions the distinction is actually quite easy. Let’s consider for example exclusive production and decay:
The central detector is empty, except for the two tracks coming from the decay. This topology is very unusual and the background from ‘non-pomeron’ exchange is negligible. Inclusive diffraction, , is on the other hand more difficult to identify. Two quantities can help in the distinction: a rapidity gap in the final state particles production and/or the presence of a highly energetic scattered proton.
5.1 Rapidity gaps

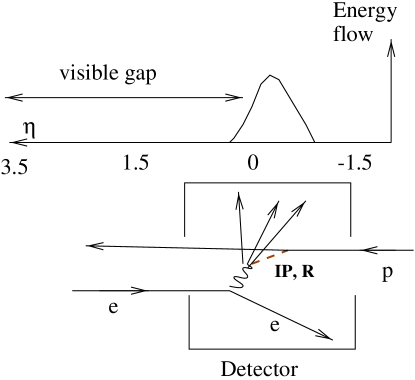
Fig. 5 schematically shows the energy flow as a function of pseudorapidity for non diffractive ep scattering at HERA†††††† The pseudorapidity is defined as: . Following the HERA convention, the angle is measured with respect of the proton beam direction. . Aside from the recoil electron, two main groups of particles can be identified: particles produced at high rapidity in the hadronization of the proton remnant, and particles produced in the hadronization of the photon-parton system, typically at small or negative rapidity. In deep inelastic scattering, for example, the struck parton is deflected and emerges from the proton remnant at an angle . It is useful to express this angle as the difference in pseudorapidity between the struck parton and the proton remnant:
| (5) |
Since the pseudorapidity interval covered by a system with centre of mass energy is given by:
| (6) |
with mp the proton mass, then we can show that the pseudorapidity interval between the proton remnant and the struck quark is:
| (7) |
where is the
total rapidity covered by the -p system and is the amount covered by the - struck quark system.
Due to the colour string connecting the struck parton and the proton
remnant the rapidity gap is filled with particles
in the hadronization process. In particular as decreases, the average
hadron multiplicity increases faster than the pseudorapidity
interval making it less and
less likely for rapidity gaps to be visible [13] . If we assume the produced
hadrons to fill the rapidity gap according to a Poisson distribution, the probability
to have no particles in the gap has the
form:
| (8) |
This expression means that rapidity gaps between the proton fragments and the jet produced by the struck quark are exponentially suppressed.
For Reggeon or Pomeron exchange, Fig. 6, the probability to have a rapidity gap depends on the intercept of the exchanged trajectory[14]:
Let’s then consider different possibilities:
-
exchange:
-
exchange:
-
exchange:
Therefore, even though are colourless exchanges, only exchange produces rapidity gaps that are not suppressed as the gap width increases. It is therefore possible to operationally define diffraction [15] by the presence of a rapidity gap: diffractive events are those which lead to a large rapidity gap in final state phase space and are not exponentially suppressed as a function of the gap width.
5.2 Leading proton in the final state
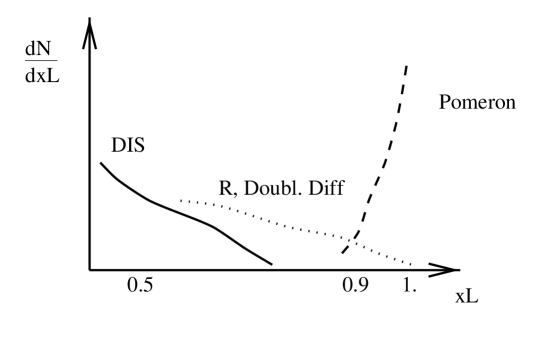
In diffractive events, the incoming beam particles, when they do not dissociate, conserve a large fraction of their initial momentum. At HERA the diffractively scattered proton carries on average more than 99% of its initial momentum. The cross sections for non diffractive processes to produce so energetic protons is very small compared with the diffractive cross section making the detection of a high energy proton a clean tag for diffractive physics. Fig. 7 schematically shows the spectra of leading protons generated from different mechanisms: at single diffraction is almost the sole component, while moving away from = 1 double diffraction and reggeon exchange become important. Traditionally, =0.9 has been used to indicate the value at which the diffractive and not diffractive part of the spectrum are equal. Leading protons can also be produced in ‘standard’ DIS events as part of the proton remnant jet, but they have on average a much lower value. A recent release of the LEPTO MonteCarlo [16] , on the other hand, includes leading protons production in the fragmentation of the proton remnant with a cross section comparable to reggeon exchange. Note that the distinction between the different mechanisms for leading protons production is somehow arbitrary and there might be a lot of overlap.
In the transverse plane, leading protons have rather small momentum, with a typical distribution of the form:
with b = 5-15
This feature makes their detection quite difficult since they tend to stay very close to the beam line. Because of this, movable sections of the beam pipe, called ‘Roman pots’, are used by both the H1 and ZEUS collaborations to allow the insertion of high precision detectors down to few centimeters from the beam line.
6 Models for diffractive scattering
Several models have been proposed to explain diffractive interactions in ep scattering. In some instances, a connection is made between Regge concepts (like Pomeron) with QCD concepts (like gluons). Here we present a brief description of some of the ideas on which the models are based.
- Factorization of vertices and pomeron structure function: Factorization considers the vertex as independent of the interaction. A universal pomeron flux factor characterises the vertex and parametrizations obtained from fits to pp and pp̄ diffractive data can be used in ep collisions. Several different expressions for have been proposed[17, 18, 19] which all include an exponential dependence on t of the type with b 5-8 Ge and a dependence on the pomeron longitudinal momentum of the type . These models express the diffractive p cross section as
| (9) |
and describe deep inelastic p and interactions in the same way: the incoming interacts with one component of the target leaving behind a remnant. For interaction the scaling variable that plays the same role of is:
| (10) |
The cross section can then be written as:
| (11) |
where F is the pomeron structure function; ie, the probability for finding a quark of fractional momentum in the pomeron.
- Factorization breaking and effective pomeron structure function: The diffractive ep interaction is viewed as photon diffractive dissociation on the proton (some examples are given in [20, 21, 22, 23, 24]). Consider ep scattering in the proton rest frame. Upstream of the proton, Fig. 8, the incoming (or ) fluctuates into different hadronic states and its wave function can be expressed as:
The pomeron, viewed as two gluon-exchange, couples to these hadronic states in an s-channel interaction and, technically, there is no IP remnant since both gluons interact with the photon. In this approach the virtual photon couples with more than one pomeron constituent and the meanings of and F are not well defined in terms of partons; in particular, factorization is not a natural consequence. To compare the predictions from this approach to those of the previous type of model, an effective IP structure function, F, is introduced. In this picture, the interaction of the state generates a different value of than the interaction of the state [25] with an effective increasing at small (). Therefore the and fluctuations have different pomeron fluxes breaking the factorization mechanism. According to [26] , factorization is also broken by the exchange of longitudinal photons. The states are characterised by the transverse and longitudinal momentum () of the pair (taken as an example) and by the quark mass (). The radius of the state depends on the inverse of and :

If the state has large , both and are small. In this case, the gluon-quark coupling is large, and pQCD cannot be applied since the photon acts like an extended object providing no information on the microscopic nature of the interaction. Large size fluctuations are thought to be responsible for the rise of the total hadronic cross section with energy and represent the bulk of diffractive events. Large configuration have small and the final state particles tend to be aligned along the photon-pomeron axis. This phenomenology is know as the Aligned Jet Model [27] .
Conversely, if is small either because (high DIS events) or (production of charm or bottom pair) is large, then the gluon-quark coupling is small and pQCD can be applied.
- Soft color interaction: in this model [28] , diffractive scattering is viewed as dominated by the exchange of one ‘hard’ gluon plus non-perturbative color interactions to allow a color singlet final state.
7 Vector meson production: Vp
In the range of centre of mass energy up to 20 GeV covered by pre-HERA experiments, this process has been described very successfully within the framework of Vector Dominance Model (VDM)[29] . In this model, the photon is assumed to fluctuate into a virtual vector meson which then interacts elastically with the proton via the exchange of a pomeron, Fig. 9(a). From VDM one expects:
| (12) |
where is the photon-vector meson coupling constant, which expresses the fact that the cross section should behave as an hadronic cross section.
Since vector meson production represents the elastic part of , we can use the optical theorem to relate the two cross sections at t = 0 Ge :
| (13) |
with A=constant. Then we can express the elastic cross section at any t value as:
| (14) |
where is the functional dependence of the cross section on t. For vector meson production, according to Regge theory, f(t) can be written as:
| (15) |
where are parameters. Using eq.15 into eq.14, integrating over t and writing explicitly the dependence from the centre of mass energy , we obtain:
| (16) |
It is very important to note that this reasoning is based on the assumption, supported by pre-HERA data, that the same underlying exchange governs both the total and vector meson cross section.
Recent papers [30, 31, 32] have shown that the situation at HERA, given the large value of , might be qualitatively different if a hard scale is present in the interaction. Under these circumstances, the process is calculable in QCD. The approach outlined in Section (6) is used: the photon fluctuates into a pair which first interacts with the target and then the meson is formed Fig. 9(b).

The scale of the interaction is given by the reciprocal of the fluctuation radius and therefore, if either , t or is large, the process is hard. Since the transverse momentum generated at the photon-quark vertex is different for longitudinally and transversely polarised photons, with dominated by large and dominated by small , early papers dealt only with the former photon polarisation. Lately [33] also predictions for have been made.
The pQCD approach has been used to calculate the magnitude and energy dependence of the cross section for photoproduction of mesons [30] , where the charm mass ensures a hard scale, and production of mesons at high [31] . In both cases, the pair resolves the gluonic contents of the proton giving a cross section proportional to the proton gluon distribution squared‡‡‡‡‡‡The square comes trivially from the fact that the pomeron in made of two gluons:
| (17) |
The energy dependence is therefore no longer determined by the pomeron intercept but by the rise of the gluon distribution at low .
7.1 Experimental signature and selection methods for
Vector meson production is characterised by very little activity in the detector since only the vector meson decay products and, for the DIS case, a scattered electron, are present. The processes studied so far by the two collaborations are§§§§§§References from [44] to [51] are contribution to ICHEP 1996, Warsaw listed in Tab.2 .
| VM decay mode | 0 Ge | ref. | 0 Ge | ref. |
|---|---|---|---|---|
| X | [34, 35, 36, 44] | X | [37, 38, 45, 46] | |
| X | [39] | X | [40, 46, 47] | |
| X | [41, 42, 43] | X | [38, 46] | |
| X | [49] | |||
| X | [50] | |||
| X | [51] |
General requirements common to the analyses dealing with vector meson production are:
-
-
Predictable number of tracks for a given reaction,
-
-
Energy clusters in the calorimeter matching the tracks momenta, with a maximum unmatched energy of GeV (determined by resolution),
-
-
range restricted to 40-140 GeV. For small (large) values, the tracks are too forward (backward) to be measured in the tracking chamber. For some analyses, higher values of have been achieved using events with the vertex displaced in the forward direction and/or using the calorimeter.
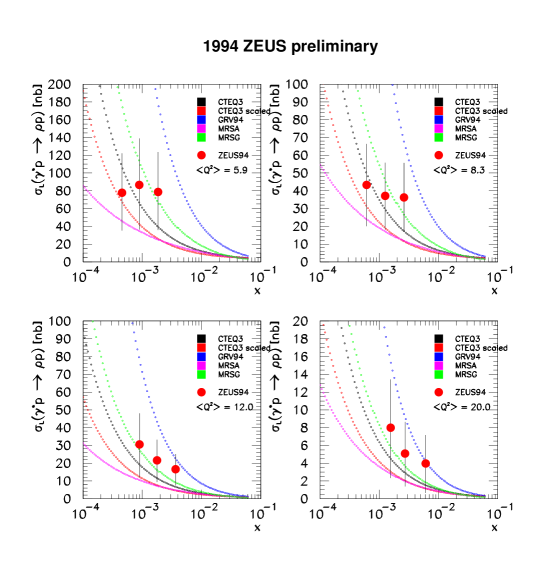
The main sources of systematic errors come from uncertainty on the trigger thresholds, input MonteCarlo distributions, track reconstruction, uncertainties in the mass fit (in particular for the analysis), non resonant background subtraction, and magnitude of the double dissociation contribution. This last contribution is of particular interest since very little is known about double diffractive production of vector mesons. Fig. 10 shows the contamination mechanism: if the mass of the excited proton system is small (1.6 GeV for H1, 2 GeV for ZEUS depending on each detector forward coverage), the event looks elastic and is included in the sample. On the contrary, if is large, energy deposition in the calorimeter can be used as a veto. The CDF Collaboration [52] measured the mass spectrum of the system Y in diffraction to be with n = 2.2 . This result, however, has not been obtained in the very low mass region and therefore should be used only as an indication. A more direct method used by both the H1 and ZEUS collaborations is to model the visible energy deposition due to high states as a function of n to determine which value fits the data best and use it to perform the background subtraction.
7.2 Light vector meson production at = 0
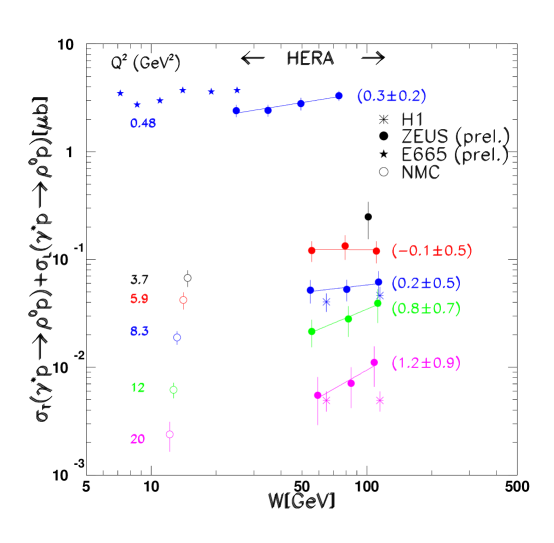
The energy dependence of the total cross sections for light mesons (, , ) and J/ photoproduction, as measured by ZEUS and H1 are shown in Fig. 11. The Regge theory prediction is clearly supported by the data. A summary of experimental results on the measurements of in photoproduction is given in Tab. 3. The b values are consistent with parametrizations of low energy data and with the ‘shrinkage mechanism’ expected in Regge theory. This mechanism predicts that the value of the slope parameter b increases as a function of the centre of mass energy like where both and , the slope parameter at = 1 Ge, need to be determined experimentally. This mechanism is called ‘shrinkage’ since as b grows, the area underneath the curve decreases considering a fixed intercept.
As the experimental results become more precise, it is possible to look for deviations from the pure exponential behaviour of the t distribution. An exponential with a quadratic term [53] seems to give a good representation of the t dependence for the elastic cross section of many hadronic reactions:
| (18) |
where c is called ‘curvature’. The local slope parameter, defined as:
| (19) |
is a decreasing function of t. An example is given in Fig. 12 for the case of the meson. Fits to hadronic scattering data yield to very similar results: b = 11.7 Ge and c = 3.16 for pp scattering and b = 9.9 Ge and c = 3.47 for scattering measured at s = 400 Ge in the interval Ge. The common behaviour of the cross section as a function of t is due to the very similar hadronic form factors for pion, proton and photon.
| Reaction | Collabor. | b) | b(GeV-2) | |
|---|---|---|---|---|
| ZEUS | 14.7 0.4 2.4 | 10.4 0.6 1.1 | 0.055 0.028 | |
| ZEUSLPS | 5.8 0.3 0.7 | 9.9 0.8 1.1 | ||
| H1 | 9.1 0.9 2.5 | 10.9 2.4 1.1 | -0.11 0.12 | |
| ZEUSLPS | 5.3 0.8 1.1 | |||
| ZEUS | 1.2 0.1 0.2 | 10.0 1.2 1.4 | 0.11 0.08 | |
| ZEUS | 0.96 0.19 0.2 | 7.3 1.0 0.8 | -0.01 0.04 |

The parameter b has been recently measured by the ZEUS collaboration in photoproduction using data from the Leading Proton Spectrometer [54] . This is the first diffractive cross section measurement at HERA in which the forward scattered proton is detected and its momentum measured. This makes possible a direct determination of the squared four-momentum t exchanged at the proton vertex. The LPS consists of silicon -strip detectors placed close to the proton beam by means of rentrant Roman pots and detects forward going protons scattered at angles 1 mrad. The momentum of the proton is measured using the elements (quadrupoles and dipoles) of the proton beam line, and it is reconstructed with a resolution of 0.3% at GeV/c. The total systematic error on the measurement of b in this analysis is 11%, the main source being the uncertainty on the acceptance (%), and the uncertainty coming from the unfolding of the beam transverse momentum spread (%). It should be noted that the uncertainty coming from the proton dissociation background is negligible, when compared to analyses which do not make use of the LPS: for LPS tagged events the contamination has been estimated to be % while a previous ZEUS result estimated the contamination to be %.
Tagging with the LPS a leading proton with a value of 0.97 has also allowed to select a clean sample of photoproduction double diffractive events, . Using the transverse momentum from the decay pions, the slope parameter b has been determined to be Ge. Fig. 13 and Table 3 show the results for both single and double diffraction.
Fixed target experiments showed, at much lower , that vector mesons retained the helicity of the photon (s-channel helicity conservation, SCHC). This effect was also investigated at HERA. The results can be expressed in terms of the spin-density matrix element which gives the probability for the meson to have zero helicity. As shown in the Tab. 3, all the measurements are consistent with a zero value for , as required by SCHC.


7.3 Vector meson production with a hard scale
In contrast to the previous results, the cross sections for photoproduction and light vector meson production at high show a significant rise with . In particular, for the case the rise is clearly visible within the range of HERA data while for the light vector mesons the rise is observed in comparison with lower energy data. Fig. 11 and Fig. 14 show the effect for the and case. The rise is inconsistent with the dependence used in the parametrizations of low energy hadronic data. The measured behaviour can be described instead by perturbative QCD models if a rise at small of the gluon momentum density in the proton is assumed. Both the shape of the rise and the normalisation could in principle be used to discriminate between models of the gluon distributions but since the latter suffers from large theoretical uncertainty, only the shape is used. Fig. 15 shows the experimental results and the expectation based on different gluon parametrizations for the cross section as a function of in four different bins. The comparison is still dominated by experimental errors but since the parametrizations are quite different, potentially this approach can be an invaluable tool to rule out many of the current options.
These results show that the cross section for vector meson production in the presence of a hard scale has a steeper energy dependence than the total hadronic cross section.
7.3.1 Slope parameter b and vs and
The slope parameter b is related to the effective radius of the interaction R by:
| (20) |
with and the proton and vector meson radius. Given a value of fm, the effective vector meson radius in photoproduction, according to Tab. 3, changes from fm for the meson to fm for the meson.
The value of b varies with the meson mass, the photon virtuality and the square of the 4-momentum transfer t. Fig. 16 shows a compilation of the measurements done by both H1 and ZEUS as a function of . The data show a clear trend toward small b values as increases. Note that some authors [55] use an ‘effective ’ instead of the measured to set the scale. The drop of b from b 10 to b 4-5 implies that the size of the system (the Pomeron vertex) decreases with and that for large we do have a short distance interaction to justify the use of pQCD. The value b 4-5 is approximately equal to what is expected from the size of the proton.

Both the H1 and ZEUS collaborations have studied the ratio between the longitudinal and transverse cross section for production, , as a function of . A compilation of the results is shown in Fig. 17. The photon polarisation, completely transverse at =0 Ge, becomes more longitudinal as increases. Different QCD calculations have been done (for a review[33]). In particular, the convolution of the diffractive production with the meson wave function gives:
| (21) |
which has a much too steep dependence with . A new approach[33] , based on the parton-hadron duality, couples the rise with to the gluon distribution anomalous dimension :
| (22) |
Since decreases with , a less steep dependence is obtained that seems to fit the data quite well.

Within the current experimental accuracy, R does not seem to depend on .
7.3.2 Determination of at large
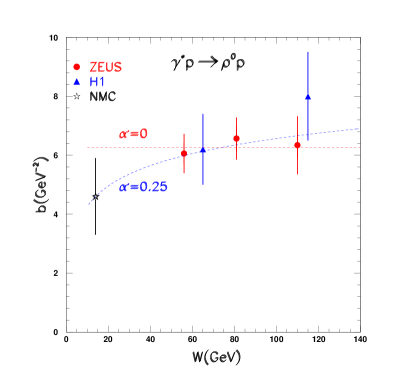
As we have seen, where Regge theory holds, the value of b should increase with energy according to the ‘shrinkage’ mechanism. The HERA data on photoproduction of are consistent with this prediction. At high there are no pre-HERA measurements of the ‘shrinkage’ mechanism. According to [56] , = 0.2 Ge . Therefore the value of the slope parameter b should increase by 1.5 Ge going from low energy, 10 GeV, to the HERA regime, 100 GeV, for all exclusive reactions of the kind . On the other hand, according to [57] , the value of is expected to be for reactions where the hard QCD regime dominates, leading to a flat behaviour of b as a function of W.
Fig. 18 shows the b values for the measurements as a function of at high . The experimental data are still dominated by statistical errors and therefore no meaningful conclusion can be drawn. On the plot, the expected trend of b vs is plotted if a value of = 0 or 0.25 is assumed.
7.3.3 Restoration of SU(4) symmetry at high
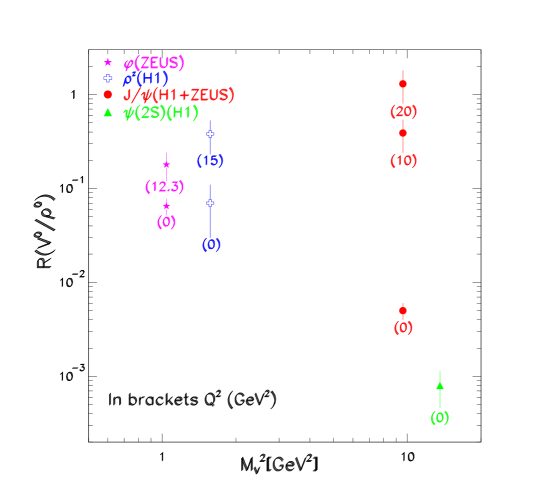
According to the SU(4) flavour symmetry, when , the ratio among cross sections for diffractive vector meson production should depend only on the mesons wavefunction and quark charges [55]:
| (23) |
Besides, QCD dynamics predicts a slow increase of the relative yield of heavy flavour production at small which modifies the pure SU(4) prediction:
| (24) |
The HERA results are shown in Fig. 19: at Ge, SU(4) symmetry is badly broken, with a suppression factor 4 for -mesons and 25 for -mesons while at large there is a dramatic increase of both the cross section compared to meson production. This increase is therefore another indication that the SU(4) symmetry, and therefore perturbative QCD, can be used in these processes at large .
Cross section ratios between excited and ground states for a meson are also very important quantities because they depend on the internal dynamics of the wavefunction and can help to determine it. First preliminary results from the H1 collaboration[50, 51] , in agreement with the expectation of [55] , are:
8 Photon diffraction: X Y
Single and double photon diffraction include all pomeron mediated reactions of the kind:
where X is not a vector meson and Y is either a proton or an excited state. These reactions can be divided into two large groups depending on whether a hard scale is present in the scattering process.
8.1 Experimental signature and selection methods for
As it was shown in Section (5), diffractive events generally have a rapidity gap and a leading barion in the final state. Several selection methods have been used by both the H1 and ZEUS collaborations exploiting their own detectors. In the following the four most significant methods are presented.
8.1.1 Maximum pseudorapidity (ZEUS,H1)
At HERA, following the first papers on the subject [58, 68] , a cut on the pseudorapidity of the most forward¶¶¶¶¶¶As it was said before, in the HERA convention the proton travels along the z-axis in the positive direction energy deposit in an event has been used to separate diffractive from non diffractive events. This cut selects as diffractive events all those events whose most forward energy deposit has a rapidity less than 1.5, equivalent to require a visible rapidity gap of at least 2.9 unit in the forward direction (ZEUS case). This cut, however, puts strong limitations on the type of events that are selected since it reduces the pseudorapidity interval available for the fragmentation of the system to 4.5 - 5.5. Since a system with mass covers a pseudorapidity interval with the proton mass, only masses up to 10-15 GeV are therefore selected.
8.1.2 Largest rapidity gap (H1)
For each event, the largest rapidity gap is identified, Fig. 20. This gap defines two systems, X and Y with masses and . If:
-
a)
-
b)
the event is accepted in the diffractive sample. This selection is based on the H1 detector ability of measuring hadronic activity up to and vetoing activity in the region GeV.
The requirement a) ensures that only a small fraction of the initial proton longitudinal momentum is present in the detector while b) forces the existence of a rapidity gap in the final state. It is important to notice that this selection criterium does not make any assumption on the nature of the interaction but defines a cross section for all events that are selected by a) and b).

8.1.3 Leading proton measurement (ZEUS_LPS)
The cleanest way to identify diffractive events is to tag a scattered proton with a very high fraction of the initial proton momentum. From the leading proton momentum, both t and the hadronic mass can be computed:
| (25) |
| (26) |
Fig. 21 shows the fraction of DIS events with a leading proton as a function of for Ge, GeV and Ge. Comparing this figure with Fig. 7, two different components can be easily identified: the diffractive peak due to IP exchange at 1 and the continuum due to double dissociation, reggeon exchange and non-diffractive DIS scattering rising below 0.9.

Just below 1, the distinction between diffractive and non diffractive events becomes unclear. From a fit to the spectrum in pp scattering [60] , the value 0.9 has been used to identify the point where the pomeron and non pomeron contributions are roughly of the same magnitude. The ZEUS collaboration, in order to select a very pure diffractive sample, decided to use only protons with 0.97, well within the diffractive peak. Unfortunately, due to the limited LPS acceptance, the number of events with a tagged leading proton is small. Note that the LPS acceptance, at 0.95, starts at .
8.1.4 Ln() distribution (ZEUS_MX)
This method [59] of separating the diffractive and non diffractive contributions is based on their very different distributions.
Non-diffractive events, assuming uncorrelated particle emission, have an exponential fall-off of the ln distribution:
| (27) |
while diffractive events have a constant value in the distribution:
| (28) |
The diffractive sample is therefore defined as the excess contribution in the ln distribution above the exponential fall-off of the non-diffractive peak. In bins of , and , a fit in the form:
| (29) |
is performed allowing the evaluation of the diffractive component. An example of the ln distribution is given in Fig. 22.

8.2 Determination of and test of factorization
The assumption of factorization implies that the pomeron structure is independent of the process of emission and that the pomeron flux is the same in all diffractive processes. Its dependence on is given by:
| (30) |
with . If factorization holds, the same value of measured in many hadronic reactions should also control the pomeron flux at HERA.

8.2.1 Determination of at 0 Ge
The value of , as shown in Section 2, can be measured directly from the behaviour of as a function of the centre of mass energy . Results from both the H1 and ZEUS collaborations are consistent with a value of 1.08 (see Section (2)).
A second method to determine is based on the behaviour of the differential cross section as calculated in the Regge formalism for the triple pomeron diagram:
| (31) |
| Collaboration | interval GeV | |
|---|---|---|
| ZEUS | ||
| H1 |
In Tab.4, the results from the H1 [61] and ZEUS [62] collaborations are presented. Both results suggest a value for consistent with Regge phenomenology as already indicated by and support the hypothesis that the same ‘soft Pomeron’ used to describe the high energy behaviour of hadron-hadron scattering is also responsible for diffractive photoproduction at HERA.
8.2.2 Determination of at large
At large , by analogy with standard deep inelastic scattering, the differential cross section for deep inelastic diffractive scattering can be written as:
| (32) |
Using now the assumption that factorization is valid, the t and dependence can be separated from the dependence on and :
Integrating the pomeron flux over t and writing the dependence on explicitly, becomes:
| (33) |
Following eq. 32,33, the determination of the DIS diffractive cross section in bins provides a method to measure as a function of and and to test whether factorization holds.
H1 determination of

Fig. 25 shows the quantity for different and bins as a function of . The data [64] were fitted with the function:
in each interval. The points clearly show a change in slope going from low to high values of while no dependence is seen with , Fig. 24. This analysis, therefore, shows that there is a change in the value of n as a function of and . This experimental factorization breaking, however, does not uniquely indicate a change in the pomeron flux but it might also be explained in terms of a presence in the data of a ‘non-pomeron’ component. If a fit using a meson and a pomeron component is performed, Fig.25,
then a single value for ‘a’ gives a good description of the data (preliminary results):
with . The value obtained for is consistent with what is expected from meson exchange. From a, a value for averaged over the unmeasured t distribution, , can be obtained, :
To check consistency between results obtained with this method and a previous H1 analysis [68] , the measurement of using a single component has been performed also over the same kinematical range used in [68] , obtaining a result that is compatible within statistical errors with the old one.
![[Uncaptioned image]](/html/hep-ph/9703245/assets/x25.png)
ZEUS_LPS determination of
The diffractive structure function was determined using LPS tagged events [65] in the range 430 Ge, 0.006 0.5, 12 GeV2, and 0.07 0.36 GeV2, extending the range to lower and higher compared to previous ZEUS measurements (Fig. 26) . The results are consistent with factorizable dependence in all bins. Fitting the highest 3 bins with the same exponent gives a= 1.28 0.07 (stat.) 0.15 (syst.) and therefore:

ZEUS_Mx determination of
The determination of can also be achieved by fitting the energy dependence of the cross section in bins of [59] . In a Regge - type description [66, 67] , the dependence of the diffractive cross section is of the form
| (34) |
where is the pomeron trajectory and and are parameters. The cross sections in each () interval is fitted to the form
| (35) |
allowing a determination of . Howewer, the result obtained with this method is currently under further investigation and is shown only for completeness ∥∥∥∥∥∥ In the preliminary analysis of the ZEUS 94 data on the diffractive DIS cross-sections a technical mistake has been found in the generation of the Monte Carlo data used for the acceptance correction and resolution unfolding. This mistake led to the mishandling of QED radiative corrections. Its effect is to change the cross sections by typically one systematic error. The ZEUS collaboration thus has retracted their 1994 preliminary results until further analysis is completed and the effect on the above value of is currently under study. :
8.2.3 Comparison of the results
In order to compare results obtained at GeV with results obtained al large , the influence on the result of the unknown value of in photon diffraction at large needs to be evaluated. Note that the value of in photon diffraction at large does not have to be the same one measured in vector meson production in the presence of a hard scale. Let’s consider, as an example, the lnanalysis. Integrating over t eq.34, the expression for the cross section is:
| (36) |
On the other hand, if Ge, then two effects change the slope of the dependence:
-
1)
The denominator of eq.36 is a slowly rising function of and therefore causes to be smaller than . This effect has been extimated, for = 0.25 Ge, to be 0.025-0.03 .
-
2)
If the t range is limited, the last term of eq.36 is a decreasing function of , causing to be smaller than . For the ZEUS_LPS analysis, where , a value of = 0.25 Ge reduces the measured value by 0.02 .
In Fig. 27, the compilation of values obtained at HERA is shown assuming, for the measurement at large , (a) = 0 Ge ; or (b) = 0.25 Ge (b). The solid line is the statistical error while the dotted line is the systematic error. The values indicated as H1 93 () [68] and ZEUS 93 () [69] are the first measurement obtained by each experiment and they were obtained using the selection cut for H1 and for ZEUS.

It is possible that the difference in value between and is a signal for the presence of a small ‘hard’ pomeron component in the diffractive sample at high . How to measure it, its magnitude and how to enhance it choosing particular final states (for example see [70, 71]) is currently under intense theoretical investigation. Note also that the above comparison is done among measurements performed on different t and ranges.
8.3 Measurement of the slope parameter b in diffractive DIS
Using the ZEUS leading proton spectrometer, the t distribution of diffractive DIS was measured directly for the first time at HERA [65] . The measurement of t has been performed in the kinematic range: , 70 210 GeV, 0.07 0.36 GeV2. Assuming an exponential behaviour , b is measured to be:
The measured t distribution is shown in Fig. 28. The value of b is similar to the values obtained in single diffraction in pp interactions.

8.4 Partonic structure of diffractive exchange
8.4.1 QCD fit to the diffractive structure function
The H1 collaboration [64] performed a QCD analysis of the diffractive structure function . The analysis is performed integrating over the measured range and the result interpreted as the deep inelastic structure of the exchanged object averaged over t and :
The QCD analysis is performed fitting the data using a flavour singlet quark and gluon distribution () at a starting scale and then evolving the system according to the DGLAP [72] evolution equation. The results are shown in Fig. 29. The most striking feature in the data is that a rise with lnpersists to values of far in excess of the point ( 0.15) at which the structure of the proton is dominated by quarks rather than by gluons suggesting a strong gluonic component in the structure of the diffractive exchange. The QCD fit supports this interpretation: the analysis has been also done considering only quarks at the starting scale and a much worst value ha been obtained. The parton distributions obtained from the fit are shown in Fig. 30. At = 5 Ge a ‘leading’ gluon behaviour is observed, in which the exchange is dominated by gluons carrying a very large fraction of the longitudinal momentum.

8.4.2 Jet structure
The question of the constituent content of the pomeron can also be addressed via measurements of diffractively produced jets, both in photoproduction [73, 74] and DIS [75] . The ZEUS collaboration studied the diffractive dijet cross section:
and compared its magnitude and shape with different model predictions based on a factorizable model of pomeron. To ensure diffractive production, a gap in the most forward part of the detector of at least 2.9 unit was required.
The following Pomeron fractional momentum densities were used in the MC:
Super-hard gluon:
Hard gluon:
Hard-quark (2 flavours): .
The measured distribution, Fig. 31, is compatible with a Pomeron containing a hard-gluon density.
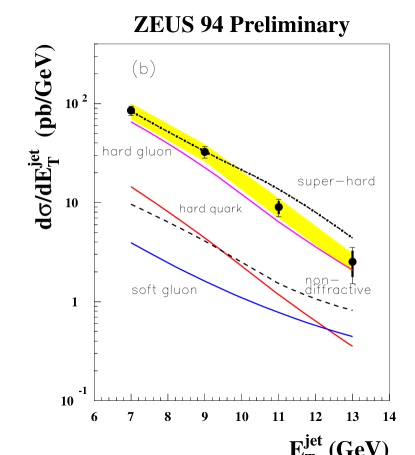
The thick error bars represent the statistical errors of the data and the thin error bars show the statistical error added in quadrature with the systematic non associated with the jet energy scale. Comparison with POMPYT [76] MC calculations for a gluonic (quarkonic) Pomeron are shown, including both direct and resolved contributions and different choices of the parton density. From top to the bottom the curves correspond to super-hard gluon (dashed-dotted), hard gluon, hard quark and soft gluon. The non-diffractive contribution modelled by PYTHIA [77] is shown as a dashed line.
8.5 as a function of
Fig. 32 shows the ratio between the diffractive and total cross section as a function of . At 0 Ge, the diffractive part of the cross section is () according to the ZEUS (H1) collaboration of which % ( % ) is photon diffraction and 135 % (103 %) is vector meson production. This last component has been measured to fall at least like and therefore becomes negligible as increases. Photon diffraction seems to decrease going from = 0 to 10 Ge while it stays flat as a function of at large indicating that diffraction is a leading twist mechanism. It will be very interesting to have more accurate data to see if this decrease, assuming that it is actually confirmed, happens at the same values where pQCD starts to be applicable, indicating a change in the nature of the diffractive interaction.

9 Central rapidity gaps
In high energy hadronic collisions, the dominant mechanism for jet production is a hard scatter between partons in the incoming hadrons via a quark or gluon propagator. Such jets are said to be ‘colour connected’ and this leads to the production of particles throughout the rapidity region between the jets. However, if the hard scattering were mediated by the exchange of a colour singlet propagator in the t-channel, each jet would be colour connected only to the beam remnant closest in rapidity and the rapidity region between the jets would contain few final-state particles [78] , Fig. 33(a,b)
D0 [79] and CDF [80] have reported the results of searches at TeV for dijet events in collisions containing a rapidity gap between the two highest transverse energy () jets. Both collaborations see an excess of gap events over the expectations from colour exchange processes. D0 reports an excess of , whereas CDF measures the fraction to be .
At HERA an equivalent mechanism is possible, with the hadronic fluctuation of the photon acting as one of the hadrons. In order to quantify the rapidity gap events, a gap-fraction, , is defined as the ratio of the number of dijet events which have a rapidity gap of width between the jets to the total number of dijet events. As explained above, for colour non-singlet exchange, the gap-fraction is expected to fall exponentially with increasing while for colour singlet exchange, the gap-fraction is not expected to depend strongly upon [15, 81]. The situation is illustrated in Fig. 33(d).


The results [82] are shown in Fig. 34. Both the comparison with the default PYTHIA non-singlet prediction and the fit to an exponential form give an excess of about 0.07 in the gap-fraction over the expectation from colour non-singlet exchange. This excess can be interpreted as evidence of hard diffraction: a simple two-gluon model for pomeron exchange gives [15] thus showing that pomeron exchange could account for the data.
The magnitude of the squared four-momentum transfer across the rapidity gap as calculated from the jets is large (). Thus the colour singlet exchange is unambiguously ‘hard’.
10 Conclusions
Diffraction at HERA has provided many measurements in both the soft and perturbative domains.
- The rise of the total cross section has been measured to be weak, consistent with the exchange of the same ‘soft’ pomeron responsible for the rise with energy of hadronic reactions.
- Diffractive photoproduction is also governed by soft pomeron exchange: a value of has been measured from the mass spectrum of the dissociated photon in the triple pomeron regime.
- Elastic vector meson production at HERA shows a clear distinction between two classes of processes. A first group of results, photoproduction of light vector mesons (), exhibits the characteristic features of diffraction, as described by Regge theory: a weak energy dependence of the cross section and a value of the t slope parameter b as observed in hadronic diffractive reactions. They are therefore explained in term of the same pomeron that controls the total cross section. A second group, which includes photoproduction of and light vector meson production at high shows a different pattern: a strong energy dependence of the cross section, a values of b consistent with a point like V vertex and the restoration of the SU(4) flavour symmetry indicate a type of dynamic consistent with pQCD predictions.
- Photon diffraction at large shows a value of only slightly higher than the values obtained in photoproduction, indicating that the same mechanism used to explain photoproduction processes can be used to explain a large fraction of diffractive dissociation at high . The partonic structure of the pomeron has been measured and found to be dominated by hard gluons. Factorization has been found to be valid within the current sensitivity and measurements range.
11 Acknowledgements
It is a pleasure to thank in H. Abramovich, M. Arneodo, J. Dainton, E. Gallo, G. Iacobucci, A. Levi, R. Nania, J. Phillips, F. Sciulli, A. Solano and to Lilian DePorcel for her infinite patience and understanding.
References
- [1] H1 Collaboration, DESY 93-103.
- [2] ZEUS Collaboration, The ZEUS detector, Status Report (1993).
-
[3]
G. Iacobucci, Talk given at the 1996 Zeuthen Workshop on Elementary Particle Theory, Rheinsberg, Germany (1996),
A. Staiano, Talk given at ‘Les Rencontres de la Physique de la Valle d’Aoste’ La Thuile (1996),
G. Barbagli, Talk given at the 1996 IHEP Conference, Warsaw. - [4] P.D.B. Collins, ”An Introduction to Regge Theory and High Energy Physics”, Cambridge University Press, Cambridge (1977).
-
[5]
M. Perl, High Energy Hadron Physics,
Wiley & Son, New York, 1974. - [6] A.Donnachie, P.V.Landshoff, Phys. Lett.B296 (1992) 227.
- [7] H1 Collaboration, S. Aid et al., Z. Phys.C69 (1995) 27.
- [8] ZEUS Collaboration, M. Derrick et al., Z. Phys.C63 (1994) 391.
- [9] CDF Coll., F.Abe et al., Phys. Rev.D50 (1994) 5550.
- [10] H. Abramowicz et al., Phys. Lett.B269 (1991) 465.
- [11] ZEUS Collaboration, M. Derrick et al., DESY 96-076 (June 1996).
- [12] H1 Collaboration, F. Abe et al., Nucl. Phys.B470 (1996).
- [13] M. Ryskin et al.,‘Heavy Photon Dissociation in DIS’, Proceeding of the workshop ‘Physics at HERA’, Hamburg (1991).
- [14] B. Kopeliovich et al, hep-ph/9601291.
- [15] J. D. Bjorken, Phys. Rev.D47 (1992) 101.
- [16] M. Przybycien et al., hep-ph/9606294.
- [17] A. Donnachie, P.V. Landshoff, Nucl. Phys.B244 (1984) 322.
- [18] A. Donnachie, P.V. Landshoff, Phys. Lett.B191 (1987) 309.
- [19] G. Ingelman and P. Schlein, Phys. Lett.B152 (1985) 256.
- [20] N.N. Nikolaev, B.G Zakharov, Phys. Lett.B260 (1991) 414.
- [21] H. Abramowicz et al. , SLAC Summer Inst. (1994) 539.
- [22] N. Nikolaev et al., Z. Phys.C53 (1992) 331.
- [23] E. Gotsman et al., hep-ph/9606280.
- [24] E. Levin et al., Phys. Rev.D50 (1994) 4306.
- [25] M. Genovese et al., Sov. Phys. JEPT81 (1995) 625.
- [26] M. Genovese et al., Phys. Lett.B380 (1996) 213.
-
[27]
J. Bjorken,AIP Conference Proceedings No. 6, Particles and Fields Subseries N0. 2, Ed. M. Bander, G. Shaw and D. Wong (AIP, New York,1972)
J. D. Bjorken and J. Kogut, Phys. Rev.D8 (1973) 1341,
J. D. Bjorken, preprint SLAC-PUB-7096 (1996), hep-ph/9601363. - [28] W. Buchmuller et al., Phys. Lett.B355 (1995) 573.
- [29] R. Feynman, Photon-Hadron Interactions, Addison-Wesley, 1989.
- [30] M.G. Ryskin, Z. Phys.C57 (1993) 89.
- [31] S.J. Brodsky et al., Phys. Rev.D50 (1994) 3134.
- [32] J. Nemchik et al., Phys. Lett.B341 (1994) 228.
- [33] A.D. Martin et al. hep-ph/9609448
- [34] ZEUS Collaboration, M. Derrick et al., Phys. Lett.B356 (1995) 601.
- [35] H1 Collaboration, F. Abe et al., Nucl. Phys.B463 (1996) 3.
- [36] ZEUS Collaboration, M. Derrick et al., DESY 96-183 , accepted by Zeitschrift f. Physik - MS 418
- [37] ZEUS Collaboration, M. Derrick et al., Z. Phys.C69 (1995) 39.
- [38] H1 Collaboration, F. Abe et al., Nucl. Phys.B468 (1996) 3.
- [39] ZEUS Collaboration, M. Derrick et al., Phys. Lett.B377 (1996) 259.
- [40] ZEUS Collaboration, M. Derrick et al.,Phys. Lett.B380 (1996) 220.
- [41] H1 Collaboration, F. Abe et al., Phys. Lett.B338 (1994) 507.
- [42] ZEUS Collaboration, M. Derrick et al., Phys. Lett.B350 (1995) 120.
- [43] H1 Collaboration, F. Abe et al., Nucl. Phys.B472 (1996) 3.
- [44] ZEUS Collaboration, M. Derrick et al., ICHEP 1996, pa 02-051.
- [45] ZEUS Collaboration, M. Derrick et al., ICHEP 1996, pa 02-053.
- [46] ZEUS Collaboration, M. Derrick et al., ICHEP 1996, pa 02-028.
- [47] H1 Collaboration, F. Abe et al., ICHEP 1996, pa 02-064.
- [48] H1 Collaboration, F. Abe et al., ICHEP 1996, pa 02-085.
- [49] ZEUS Collaboration, M. Derrick et al., ICHEP 1996, pa 02-049.
- [50] H1 Collaboration, F. Abe et al., ICHEP 1996, pa 02-086.
- [51] H1 Collaboration, F. Abe et al., ICHEP 1996, pa 01-088.
- [52] CDF Collaboration, F. Abe, et al., Phys. Rev.D50, (1994) 5535 (1995) 855.
- [53] A. Schiz et al., Phys. Rev.D24 (1981) 26.
-
[54]
A.Staiano, Silicon Detectors for the Leading Proton Spectrometer of ZEUS,
proceedings of the Third International Workshop on Vertex Detectors , IUHEE-95-1;
K. O’Shaughnessy et al., Nucl. Instrum. Methods A342, (1994) 260-263. - [55] L. Frankfurt et al., Phys. Rev.D54 (1996) 3194.
- [56] N. N. Nikolaev et al., Phys. Lett.B366 (1996) 337.
- [57] H. Abramowicz et al, Proceeding of ‘Future Physics at HERA’, Hamburg, 1996.
- [58] ZEUS Collaboration, M. Derrick et al., Phys. Lett.B315 (1993) 481.
- [59] ZEUS Collaboration, M. Derrick et al., Z. Phys.C70 (1996) 391.
- [60] K.Goulianos, Phys. Rep.101 (1983) 169.
- [61] H1 Collaboration, F. Abe et al., ICHEP 1996, pa 02-067.
- [62] ZEUS Collaboration, M. Derrick et al., ICHEP 1996, pa 02-048.
- [63] ZEUS Collaboration, M. Derrick et al., Z. Phys.C67 (1995) 227.
- [64] H1 Collaboration, F. Abe et al., ICHEP 1996, pa 02-061.
- [65] ZEUS Collaboration, M. Derrick et al., ICHEP 1996, pa02-026.
- [66] A.H. Mueller, Phys. Rev.D2 (1970) 2963; ibid. D4 (1971) 150.
- [67] R.D. Field and G. Fox, Nucl. Phys.B80 (1974) 367.
- [68] H1 Collaboration, F. Abe et al., Phys. Lett.B348 (1995) 681.
- [69] ZEUS Collaboration, M. Derrick et al., Z. Phys.C68 (1995) 569.
- [70] P.V. Landshoff, Talk given at International Workshop on Deep Inelastic Scattering and Related Phenomena (DIS 96), Rome, Italy, 15-19 Apr 1996, hep-ph/9605331
- [71] J. Bartels et al., Phys. Lett.B379 (1996) 239, ERRATUM-ibid. B382 (1996) 449.
-
[72]
Yu. L. Dokshitzer, JETP 46 (1977) 641
V. N. Gribov and L. N. Lipatov, Sov. J. Nucl Phys. 15 (1972) 78.
G. Altarelli and G. Parisi, Nucl. Phys.B126 (1977) 298. - [73] ZEUS Collaboration, M. Derrick et al., Phys. Lett.B356 (1995) 129.
- [74] ZEUS Collaboration, M. Derrick et al., ICHEP 1996, pa 02-039.
- [75] H1 Collaboration, F. Abe et al., ICHEP 1996, pa 02-068.
- [76] P. Bruni and G. Ingelman, DESY 93-187.
- [77] PYTHIA 5.6: H.-U. Bengtsson and T. Sjöstrand, Comp. Ph ys. Comm. 46 (1987) 43.
- [78] Y. Dokshitzer, V. Khoze and S. Troyan, in Proceedings of the 6th International Conference on Physics in Collisions, Chicago, Illinois, ed. M. Derrick (World Scientific, Singapore, 1987) 417.
-
[79]
D0 Collaboration, S. Abachi et al., Phys. Rev. Lett.72 (1994) 2332;
D0 Collaboration, S. Abachi et al., FERMILAB-PUB-95-302-E (1995). - [80] CDF Collaboration, F. Abe, et al., Phys. Rev. Lett.74 (1995) 855.
- [81] V. Del Duca and W.-K. Tang, Phys. Lett.B312 (1993) 225.
- [82] ZEUS Collaboration, M. Derrick et al., Phys. Lett.B369 (1996) 55.