Single top quarks at the Fermilab Tevatron
Abstract
We present a calculation of the single top quark cross section for proton-antiproton interactions with at the Fermilab Tevatron collider. We examine the effects of top mass, parton distribution functions, QCD scale, and collision energy, on each of the component production mechanisms, and study the kinematic distributions for standard model electroweak production. At the upgraded Tevatron with and high luminosity, it will be possible to test the nature of the coupling using single top production. We estimate the sensitivity to measure the single top cross section, and thus to directly measure and the top quark partial width. We show what happens to the measurement when an anomalous (+) component is added to the coupling, and how the top quark polarization affects the kinematic distributions.
pacs:
14.70.Fm, 13.40.Em, 13.40.GpIntroduction
Top quarks can be created via two independent production mechanisms in collisions. The primary mode, strong pair production from a vertex, was used by the DØ and CDF collaborations to establish the existence of the top quark in March 1995 [1, 2]. The second mode is electroweak production of a single top quark or antiquark from a vertex. This mechanism provides a sensitive probe for several standard model parameters.
The experimental value of the top quark mass is [3], which is in good agreement with the value of derived from electroweak measurements at LEP, SLC, SPS, Tevatron, and neutrino scattering experiments [4]. Since the mass is of the order of the electroweak symmetry breaking scale (vacuum expectation value = 246 GeV), it is a very promising place to look for deviations from the standard model [5].
The coupling between a boson and top and bottom quarks has not yet been studied directly. Top quark pair production is not the best process for probing this coupling or the Cabibbo-Kobayashi-Maskawa (CKM) matrix element [6] since the top quarks are produced from a vertex. Information about coupling from top quark decay is relatively inaccessible in pair production because the width of the decay into is proportional to the branching fraction of , which is close to unity in the standard model (the top quark partial width , where at the 90% confidence level [7]). Single top quarks are produced at hadron colliders mainly from a vertex, and thereby provide a direct probe of the nature of the coupling and of .
In hadron collisions, there are several partonic processes which produce single top quarks in the final state. The -gluon fusion mechanism has been studied in Refs. [8, 9, 10, 11, 12, 13, 14, 15, 16, 17, 18, 19, 20]. The s-channel process has been examined in Refs. [21, 22, 23, 24, 25, 26, 27] for the Tevatron. Use of single top quark production as a tool for studying the coupling has been discussed in a number of papers for hadron colliders, including the Tevatron [11, 13, 20, 28, 29, 30, 31, 32]. Single top production has also been studied for colliders [28, 29, 30, 33, 34, 35, 36, 37, 38, 39, 40, 41, 42, 43], and for interactions [44, 45, 46].
In this paper, we first present new results of consistent tree level cross section calculations for two and three vertex subprocesses of single top quark production in collisions at . We have chosen to use this energy since it is where the Tevatron collider operated between 1992 and 1996, and this work is in support of a search of the data for single top production. We then prepare the ground for single top physics at future high luminosity Tevatron runs with , by making new estimates of the sensitivity to measure the top quark partial width, coupling, and , including an anomalous (+) coupling. These studies are the first to be performed using complete tree level matrix element calculations for all possible processes, and do not use the effective approximation method [8].
In section 1, we provide a comprehensive overview of the three separate single top processes at the Tevatron, and their subprocesses. We describe our computation techniques, and present and discuss the results of the calculations. We have studied the cross section as a function of top quark mass, parton distribution parametrization, choice of scale , and collider energy, and we have evaluated lower and upper bounds on the single top cross section. In section 2 of this paper, we investigate the kinematic distributions of single top events, showing the separate contributions from the principal production modes. In section 3, we look at the effects of a nonstandard coupling at the vertex, specifically the addition of an anomalous right-handed (+) contribution to the coupling. We estimate the sensitivity to determine by measuring the single top cross section at future Tevatron runs as a function of this possible right-handed coupling strength, and show how the polarization of the system may be used to help distinguish different scenarios. We also use our estimate of the cross section precision to predict the error on the top quark partial width at the upgraded Tevatron. Finally, in section 4, we summarize our results and draw conclusions.
I Single Top Quark Cross Section
A Single top processes
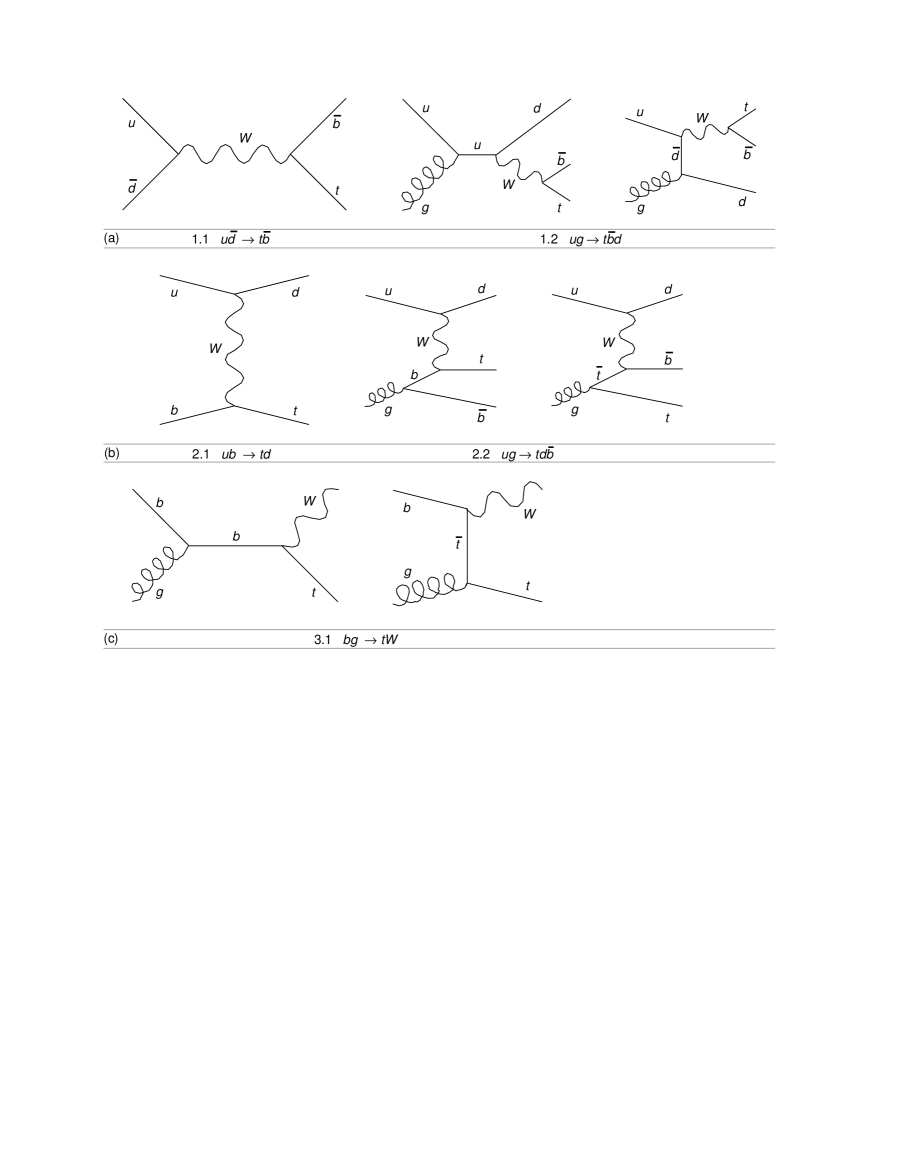
Within the standard model, there are three separate processes at a proton-antiproton collider which result in a single top quark in the final state. The list below shows that these processes in turn consist of several subprocesses with two or three tree level vertices. The number of Feynman diagrams for each subprocess is shown. Some diagrams have been omitted from the total: (a) those with pair production from a vertex and no electroweak vertex (not single top); (b) those containing a photon, boson or Higgs (their contribution to the total cross section is extremely small); and (c) diagrams with vertices containing off-diagonal CKM matrix elements. The notation used is that is a light quark, and represents any additional final state particles from the interaction.
| 1. | s-channe | l boson | |
| 1.1 | 1 | ||
| 1.2 | 2 | ||
| 1.3 | 4 | ||
| 2. t- or u-channel boson | |||
| 2.1 | 1 | ||
| 2.2 | 2 | ||
| 2.3 | 2 | ||
| 2.4 | 4 | ||
| 3. | |||
| 3.1 | 2 | ||
| 3.2 | 2 | ||
| 3.3 | 5 | ||
| 3.4 | 5 | ||
| 3.5 | 3 | ||
| 3.6 | 8 |
It should be noted that there is some variation in the literature over the use of the term “-gluon fusion”. In some papers it refers only to subprocess 2.2 , in others to subprocesses 2.1 and 2.2 combined. Only one reference [17] includes all four subprocesses 2.1–2.4 in the calculations, and the authors use the term “-gluon fusion” to refer only to subprocess 2.2. In this paper, we will also use the term to mean only subprocess 2.2.
The two subprocesses 1.2 and 2.2 (both ), although superficially similar, each contain two different Feynman diagrams which are gauge invariant in separate pairs and do not need to be calculated together as a group of four diagrams. One might be tempted to consider the four diagrams as an independent set instead of as separate higher order corrections to the two main processes, since an experimental search will be able to distinguish between two-body and three-body final states. However, this is not acceptable mathematically when calculating the cross sections, due to the definition of the sea quarks in the parton distributions for the proton and antiproton. This definition requires the subprocesses to be grouped as shown in the list above.
We will now discuss the subprocesses we have included in our calculations. In the following list, the first initial state particle is a parton from the proton and the second one is a parton from the antiproton. Processes with an initial state or quark, or with off-diagonal CKM matrix elements are omitted from the list (and from plots) for simplicity, but have been included in our calculation of the overall cross section and other numerical results.
| 1. | ||
| 1.1 | ||
| 1.2 | ||
| 2. | ||
| 2.1 | ||
| 2.2 | ||
| 3. | ||
| 3.1 | ||
| 3.2 | ||
| 3.3 |
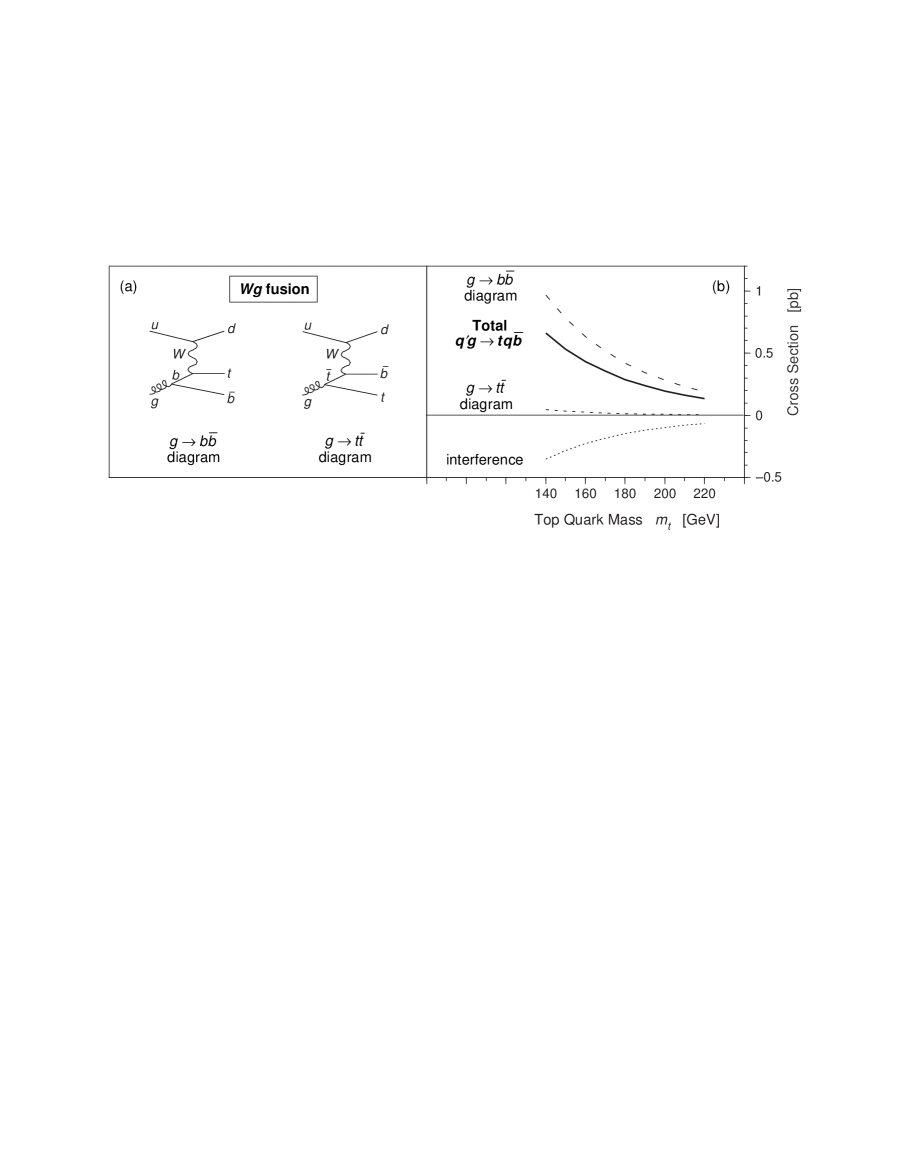
If the initial state parton is a quark from the proton, then contributions from both valence and sea quarks are included in the calculations. This also applies to quarks in the proton and to antiquarks in the antiproton. Typical Feynman diagrams for these processes are shown in Fig. 1.
We have included in our calculations all the significant single top subprocesses with two or three vertices, except those with a gluon in the final state, which are significant, but which require a full next-to-leading order calculation to be included properly. Subprocesses with an extra quark in the final state, for instance and , although they have several Feynman diagrams, only contribute 1.5% to the total cross section and 1% to the rate, and have therefore been ignored. This also applies to the subprocess , despite its having multiple Feynman diagrams, including ones with electroweak production.
B Calculation details
We have calculated the production cross section for each of the single top subprocesses mentioned in the previous section. We used the software package comphep [47] to do the tree level symbolic calculations and to generate optimized fortran code for the squared matrix elements. Version 2.0 of comphep used the bases package [48] to integrate over all phase space using parton distributions, and a comphep–bases interface program to generate the correct event kinematics, with smoothing of singular variables [49]. The Monte Carlo event generator spring [48] was used for each process in comphep 2.0. comphep 3.0 has since replaced bases and spring with vegas [50], and we used this version as well. Events generated were processed using pythia [51] via a custom interface, in order to decay the boson for use in kinematic studies of the final state particles.
For these calculations, we have utilized the cteq3m [52] and mrs(a′) [53] parton distributions. These two sets of next-to-leading order structure functions both use the modified minimal subtraction () renormalization scheme [54]. The newly available parton distributions cteq4m [55] and mrs(r) [56] are very similar to the distributions we have used, in the kinematic region for single top quark production at the Tevatron.
We used the following standard model parameters in our calculations: boson mass , , where is the weak mixing angle, (giving the boson mass ), quark mass , , and CKM matrix elements and . All results have been obtained in two gauges, the unitarity gauge and the ’t Hooft-Feynman gauge, as a check of calculations. Differences between calculations in the two gauges are less than 0.1%.
We have chosen to use as the QCD evolution parameter or scale value, since a large scale is a natural choice for top quark production. A high value such as is also a conservative choice that leads to lower cross sections. As shown in Refs. [14] and [18], the leading order single top cross section depends rather strongly on the choice of QCD scale for values below , and if a very small value for such as were to have been chosen, then the calculated cross sections would have been about four times larger than those obtained using .
A typical value for single top quark processes is , where is the fraction of the proton or antiproton momentum carried by each initial state parton. At a scale , the value of is 0.102 from cteq3m and 0.104 from mrs(a′). for five quark flavors is 158.0 MeV in both cteq3m and mrs(a′).
C Combining cross sections
Care must be taken when combining some single top subprocesses in order to avoid double counting. One cannot simply add up the separate cross sections to get the total when there is a sea quark in the initial state. The cteq3m and mrs(a′) sea distributions are not measured experimentally, but are obtained from the gluon distributions using the Dokshitzer-Gribov-Lipatov-Altarelli-Parisi (DGLAP) evolution equations [57]. The sea distributions in the structure functions therefore contain a mass singularity from the collinear divergence which occurs when the gluon splits to an onshell pair. The subprocesses we are considering which pertain to this situation are 2.1 , and 2.2 (-gluon fusion), where the initial state quark in subprocess 2.1 is derived from the gluon sea in the antiproton. The correct way to avoid this singularity would be to calculate the rate for subprocess 2.2 with complete loop corrections, and then subprocess 2.1 with its sea contribution would be automatically included without the need for extracting it from the parton distribution sets. However, since we are making leading order calculations, we need another method. One technique [58, 59] for obtaining the cross section is to calculate the rates for subprocesses 2.1 and 2.2 and add them together, and then subtract the rate from the splitting process convoluted with subprocess . We have chosen to employ this method here. For instance, at with and cteq3m parton distributions, the naive cross section for is 0.75 pb, for it is 0.29 pb, and the splitting term is 0.54 pb, giving a total cross section from these two subprocesses of 0.50 pb. The rate for is thus over 70% higher than the rate from the -gluon fusion subprocess alone.
A second subtlety [60] comes into play with this method for avoiding double counting, when working with the two parton distributions being considered: cteq3m and mrs(a′). The CTEQ collaboration has chosen to evolve the sea distribution from , whereas the MRS group starts the evolution of its sea distribution at . The logarithmic terms in the gluon splitting must be evaluated as with CTEQ distributions, but as for MRS distributions, to be consistent with the respective definitions of the quark sea.
D Cross section versus top quark mass
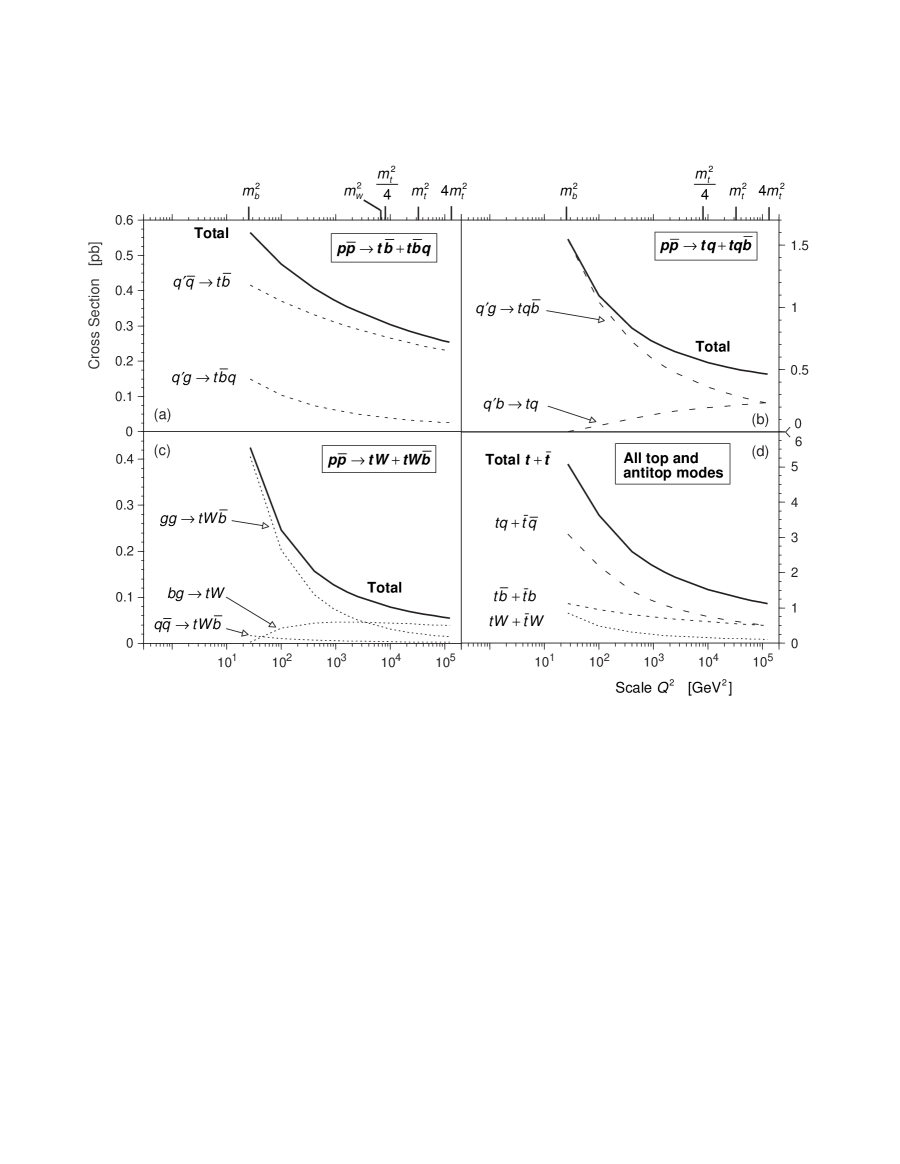
We show results for the cross sections of the three electroweak single top processes and the totals in Fig. 2 as a function of the top quark mass, with . Figure 2(a) shows , (b) portrays the process , (c) is for the less important mode, and (d) shows the totals for each of these three processes for and combined. Figure 2(d) also shows pair production for comparison (upper line), and it can be seen that when only one top quark is produced in the final state, the cross sections decrease more slowly with increasing top quark mass than when two heavy tops have to be created at once. The strong cross section illustrated is from the resummed next-to-leading order calculation of Berger and Contopanagos [61], who used the cteq3m parton distributions. The tree level single top cross sections are the average of our calculations using cteq3m and mrs(a′).
The main contribution to electroweak single top production comes from , the boson t- and u-channel mode, including -gluon fusion. The rate from this process (61%, at ) is nearly twice as large as that from with a in the s-channel (32%). The contribution to the total cross section of the third process is small (7%). Of the dominant t- and u-channel process, 41% of the rate comes from (after subtraction of the splitting term), and 59% from -gluon fusion . Therefore, -gluon fusion forms 36% of the total single top rate from all processes.
Because there are contributions from several single top processes, the total cross section forms a significant fraction of the pair production rate. The single top and antitop cross section from production at is pb for a top quark of mass 180 GeV and the cteq3m parton distributions, and pb using mrs(a′). Therefore, although the rate of single top production is smaller than that from pair production (e.g. pb at 180 GeV [61]) for all top quark masses considered here, it is large enough to be extremely interesting for study at the Tevatron.
Recent calculations show that higher order corrections to the leading order single top cross sections presented here are large. For instance, Ref. [17] shows that the factor for is 1.45 for at with cteq2d parton distributions [62] and . Reference [24] contains a similar higher order calculation for , and finds that for and , the factor is also 1.45, using the cteq3m parton distributions and .
E Contributions to the single top cross section
Table I presents values of various partonic subprocess cross sections for a top quark of mass 180 GeV, and for the two parton distributions discussed previously. Subprocesses with an initial state strange or charm sea quark contribute 1.9% to the total cross section, and 6.1% to the total rate. Off-diagonal CKM matrix element subprocesses (not including initial state and sea quark subprocesses) contribute 0.3% to and 5.0% to . All these other modes contribute to production. Off-diagonal CKM subprocesses and initial state and sea quark subprocesses are included in our calculation of the total single top cross section, but are not included in our plots for simplicity, because of the calculation technique used.
For single top modes like s-channel production with only light partons in the initial state, including both valence and sea quarks, the cross sections calculated with mrs(a′) are 2.4% lower than those calculated with cteq3m. When there is a gluon in the initial state, for instance -gluon fusion, then the mrs(a′) cross sections are 5.7% lower than the cteq3m ones. For reactions with a sea quark in the initial state, the cross sections calculated with mrs(a′) are 17% smaller.
Table II shows the resulting single top cross sections as a function of top quark mass. The central value numbers are the mean of the values calculated using cteq3m and mrs(a′). The upper and lower bounds come from combining half the difference between the calculations using the two parton distributions with the errors from the choice of QCD scale, as discussed in the next section. The correlation of the errors is correctly accounted for by adding the errors to each subprocess separately, before adding them in quadrature with the uncertainty due to the choice of structure function. For a top quark of mass 180 GeV, the total single top plus antitop cross section is pb.
F Cross section versus scale
We have examined the effect of the choice of QCD evolution parameter on the various single top subprocesses. The results are shown in Fig. 3 for a top quark of mass 180 GeV and the cteq3m parton distributions at . Figure 3(a) shows the scale dependence for the s-channel process , which is the least dependent of the various single top processes on the choice of scale. Figure 3(b) is for the t- and u-channel processes (-gluon fusion) and . The -gluon fusion cross section falls rapidly as the calculation scale increases, whereas the subprocess goes up as is raised. When these subprocesses are combined, the two effects partially cancel. The subprocess is shown with the splitting term already subtracted. The minor single top process is shown in Fig. 3(c) with its various contributing subprocesses, which again have differing dependences on that partially cancel in the sum. Finally, Fig. 3(d) shows each single top process summed for and , and the total single top production on the same axis for comparison.
Leading order cross sections show more sensitivity to the choice of scale than higher order calculations. However, one still needs to choose a scale at which to perform the calculations. From an intuitive perspective, it does not make sense to consider top quark production as occuring at the almost zero mass quark scale, although it would be mathematically consistent. Therefore, for our calculations, we have chosen the central value of the scale to be , and when estimating the uncertainty due to the choice of scale, we have restricted the region of interest to lie between and , as shown on the upper axes of Fig. 3. The resulting errors on the main contributions to the cross section at are: for ; for and for , which combine to give for ; and for . The and errors largely cancel because the contributions to the errors from choice of are 100% anticorrelated. The scale error dominates the total errors on the cross sections given in Table II.
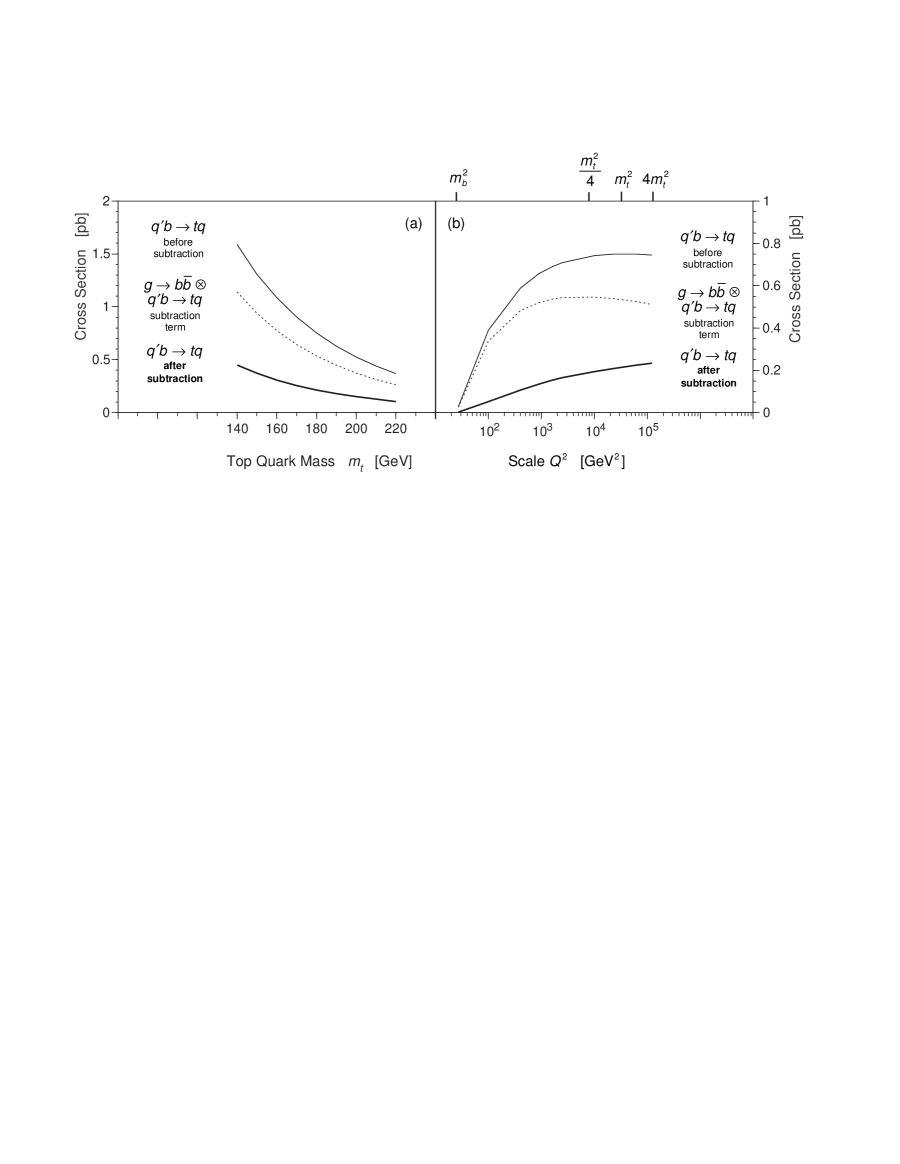
Combining the subprocesses and by subtracting the gluon splitting term to avoid double counting, as discussed earlier, is a procedure that is sensitive to the choice of evolution parameter . Figure 4 shows the subprocess before and after subtraction, as a function of (a) the top quark mass, and (b) the scale . It can be seen however, that provided the scale remains in the region around , then the sensitivity is less than that seen for the -gluon fusion subprocess in Fig. 3(b).
G Cross section versus collider energy
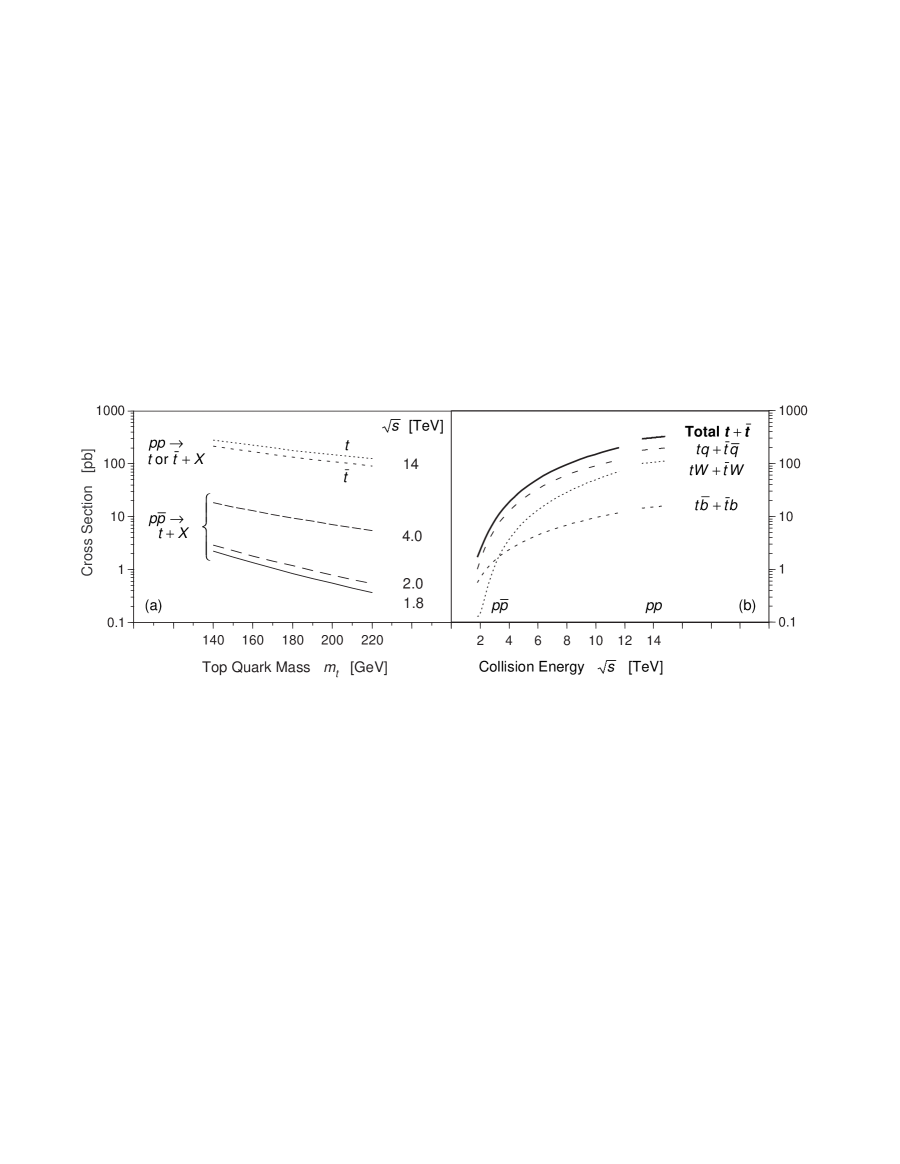
We have calculated the single top quark cross section as a function of production energy . Figure 5(a) shows the cross section versus top quark mass for four collision energies: (i) the current Tevatron energy 1.8 TeV; (ii) the Tevatron energy for the next run in 1999, 2.0 TeV; (iii) the energy of a possible Tevatron upgrade, 4.0 TeV; and (iv) the energy of the Large Hadron Collider (LHC) at CERN in 2005, 14 TeV. The three Tevatron cross sections are for collisions, whereas the LHC cross sections are calculated for collisions. Despite the 150 increase in cross sections at the LHC, it will still be rather difficult to study single top quark production there, since the backgrounds will be much larger, and the signal will be harder to identify, because the jet produced at the same time as the top quark in -gluon fusion for instance, will be further forward in pseudorapidity , where and is the polar angle between the jet and the proton beamline. Peaks in the accompanying jet distribution at the LHC will occur at (c.f. peaks at 1.5 when ).
At , the cross section for single top quark production is 0.85 pb at 1.8 TeV, 1.4 pb at 2.0 TeV, 9.4 pb at 4.0 TeV and for collisions at 14 TeV, 179 pb. For 180 GeV antiquarks, the cross sections are the same as for quarks at the Tevatron, but only 133 pb at the LHC (26% lower), because there are no valence antiquarks in the initial state. These calculations were done using the cteq3m parton distributions with , and no contributions from initial state or quarks or off-diagonal CKM matrix element terms are included.
The relative contributions to the total single top cross section from each of the significant processes is not the same at all production energies. For a top quark of mass 180 GeV, Fig. 5(b) shows the single top plus antitop cross section versus production energy at the Tevatron for each component of the signal separately. It can be seen that the s-channel process is much less sensitive to the change in available energy than the other processes, which increase rapidly in rate as the initial state energy goes up. At , the process forms 32% of the total single top signal, at 2.0 TeV it provides 29% of the cross section, and by 4.0 TeV it contributes only 13%. The process behaves in this manner because it is an s-channel process and its contribution to the total cross section comes from the threshold phase space region, which is independent of energy. The reason why the total cross section increases with energy is that at higher energies, regions of smaller in the proton structure functions are probed, and this is where the parton distributions are larger.
The contribution from to the total single top cross section increases from 7% at through 9% at 2.0 TeV, to 20% at 4.0 TeV. At the LHC, will contribute 30% of the single top rate and 40% of the antitop rate, and could therefore be an important production mode in the future. On the other hand, at the LHC, the s-channel process will fall to only 5% of the total single top rate, and will become experimentally inaccessible.
H A closer look at -gluon fusion
We have analyzed the contributions to the production rate from the two Feynman diagrams which form -gluon fusion, , shown in Fig. 6(a). There is no interference between the -gluon fusion diagrams and the two nonfusion diagrams of subprocess (shown in Fig. 1(a) as subprocess 1.2), because the final state quark and antiquark have a different color structure. For the nonfusion diagrams, the and are from a decay and so are in a color singlet state, whereas for the fusion diagrams the and come from a gluon and so are in a color octet state.
The contribution to the total production rate of -gluon fusion from the Feynman diagram where the gluon produces a pair is very small, at about 5%. However, this diagram interferes destructively with the main -gluon fusion diagram where . The destructive interference reduces the total rate for -gluon fusion by 34%. We present the cross section versus top quark mass for the two diagrams of -gluon fusion separately, and show the interference and net result, in Fig. 6(b).
I More on
We have considered two related body processes in addition to the process . These are and . We looked at these processes because in and colliders, single top quark processes with in the final state are important. However, we found that at the Tevatron these processes are not very significant. The interactions , , , and all include diagrams with pair production and subsequent decay of the into , as well as many additional diagrams with just single top quark production. One needs to remove the contribution to the cross section from the invariant mass region around the top quark pole in order to study the vertex in single top production. The remaining contributions in and collisions are large enough (at 10 fb which is 17% of the total cross section for collisions at for example) to be sensitive to the coupling structure, but in and collisions almost the entire cross section comes from the diagrams, and the remaining single top quark contribution at 29 fb, is only 0.8% of the total rate of 3.5 pb.
II Kinematic Distributions
In order to understand in more detail the properties of single top quark production, we present in this section several experimentally interesting kinematic distributions. These are shown for top production only (not ) to make the presentation clear. Distributions for antitop are the same as those for top in transverse momentum, but are mirror images in pseudorapidity. If the sign of the boson charge can be measured using its leptonic decay mode, then it will be possible to study the properties of top quarks and antiquarks separately. All plots are for a top quark of mass 180 GeV and have been calculated using the cteq3m parton distributions at .
The top quark decays to a boson and a quark, and we consider here only subsequent leptonic decays of the to a positron and neutrino, as this signal should be easier to find experimentally than channels with hadronic decay of the boson. The branching fraction for this decay mode is . The signature for a single top quark event is therefore a central, isolated, high lepton), large missing transverse momentum from the neutrino, and at least two jets, where one of the jets comes from the hadronization of the quark from the decay of the top quark. All single top events therefore have one potentially identifiable jet, and of the experimentally accessible production modes at the Tevatron (, ), 71% of them have a jet as well.
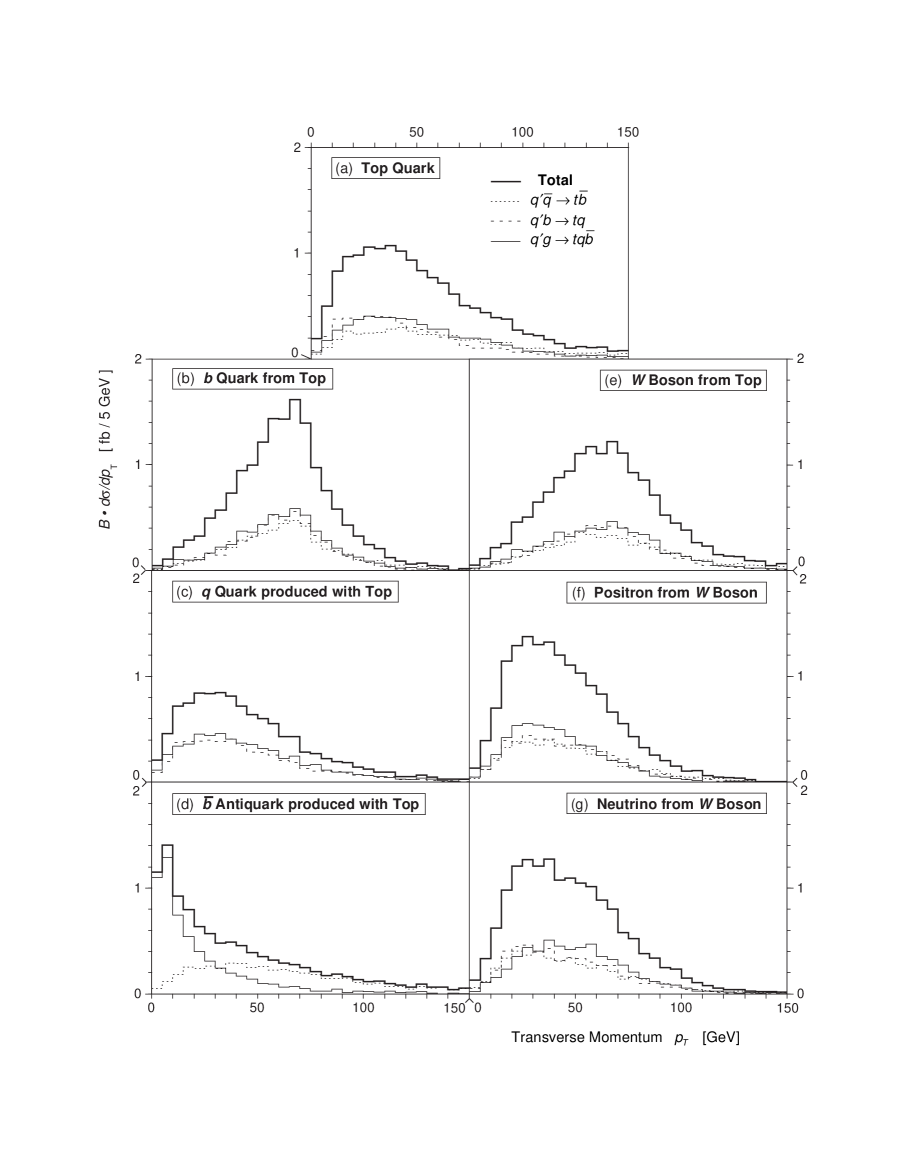
A Transverse momentum
Figure 7 shows the branching fraction times differential cross section versus transverse momentum of the final state partons in single top production, and their decay products. In each plot, the short-dashed line is for production , the longer-dashed line for the two-body t-channel process , and the narrow solid line for -gluon fusion . The wide solid line is the sum of these three processes. Plot (a) shows the transverse momentum distributions of the top quark from each single top process. The mean of these distributions is 51 GeV. Despite its very high mass, the top quark is not produced at rest, but carries considerable transverse momentum in all three production modes. When the top decays, it produces a quark, whose distribution is shown in plot (b). The mean here is 62 GeV. Plot (c) is for the light quark produced with top in the t-channel processes (), and (d) is for the antiquark often produced with top. Here the from single top production has , whereas the in -gluon fusion is much softer, with . The low will make this jet much more difficult to reconstruct. When the top quark decays, it produces a boson, whose is shown in Fig. 7(e) (). The decays to a positron, (shown in (f)) with mean of 45 GeV and a neutrino (in (g), 48 GeV).
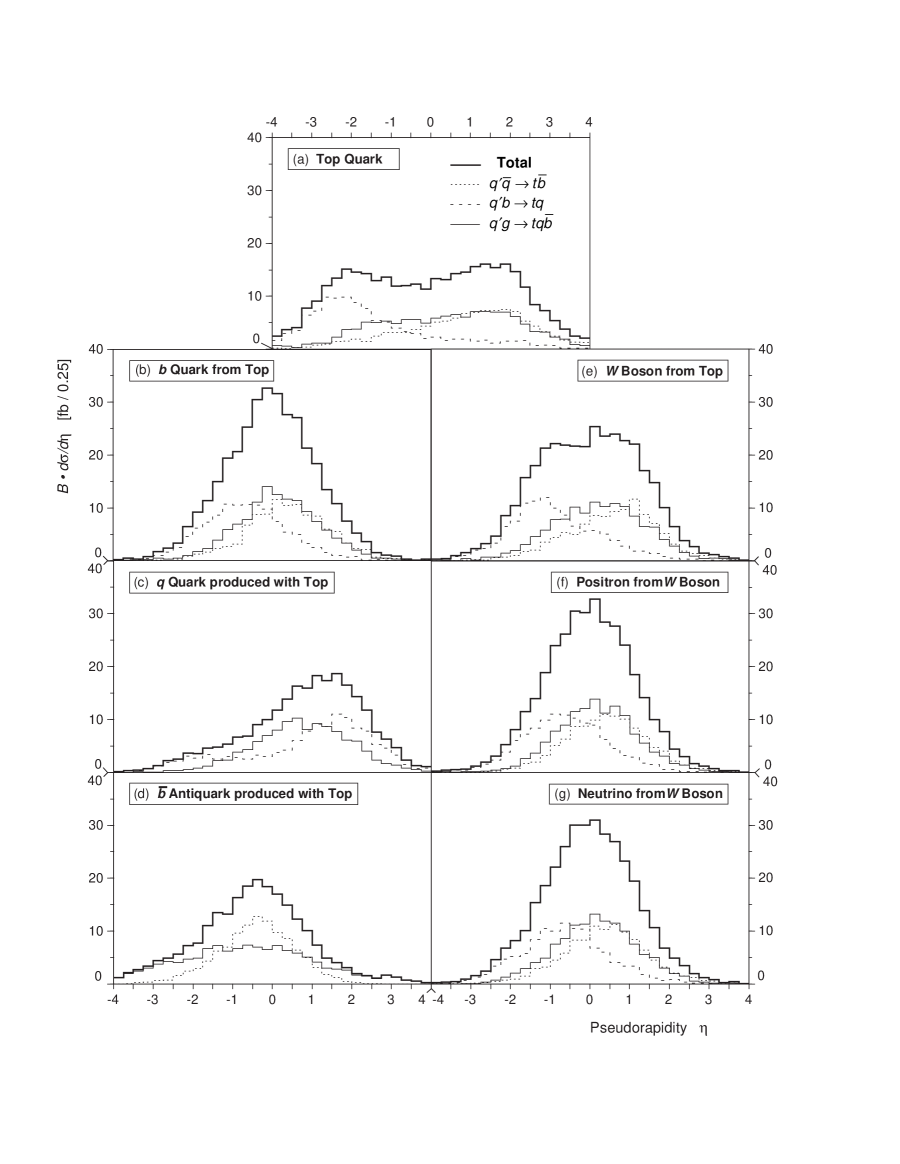
B Pseudorapidity
Figure 8 shows the branching fraction times differential cross section versus pseudorapidity of the final state partons from single top production and their decay products. Plot (a) is for the top quark itself, where one can see that the pseudorapidity distributions are rather broad, and that the contributing production modes have very different kinematics from each other. Both the -gluon fusion and modes produce top quarks more in the forward or direction than backwards (with the distributions peaked at ) whereas the two body t-channel process produces mainly backwards traveling top quarks, with the peak at . This distribution is also narrower than the other two. We see next that the decay products from the top are produced much more centrally. Plot (b) shows the quark pseudorapidities. The distribution for the from top decay in -gluon fusion is peaked at , and the from top in production at . The from top in is still produced somewhat backwards, with a peak at 0.8 reflecting the direction of its parent. We would like to note that the distribution of the quark from the top decay in -gluon fusion is in agreement with that seen by C.-P. Yuan using the onetop generator [11], but is rather different from the distribution for -gluon fusion shown in the TeV-2000 study of , [63] (with single top as a background), where the herwig generator [64] was used for this type of single top. Herwig seems to produce ’s in a symmetric peak in the region . This difference is not understood.
One of the striking features of -gluon fusion is the forward direction in which the light quark is produced [11]. This can be seen in plot (c), where the light quark from has a broad distribution, peaked at . The effect is seen more emphatically in the two body t-channel mode where the peak occurs around 1.7, resulting in the summed distribution peaking at . The pseudorapidity distributions of the antiquark produced together with top in 71% of single top events are shown in plot (d). Both distributions peak at ; the soft from -gluon fusion has a rather broad spread in pseudorapidity, whereas the much harder from production is produced in a narrower pseudorapidity peak. The distributions of the boson from the decay of the top quark, shown in plot (e), are peaked at for -gluon fusion, at for production, and at 1.2 for the mode, echoing the directions of their respective parent top quarks. The positron (f) and neutrino (g) distributions are more central versions of their parent bosons.
III Coupling and
Since the top quark is rather heavy, we expect that new physics might be revealed at the scale of its mass. Many variants of nonstandard physics relating to this subject have been considered in the literature. Possible anomalous gluon–top quark couplings are discussed in Refs. [65, 66, 67, 68, 69, 70, 71]. Contact terms and new strong dynamics involving the top quark have been studied in [72, 73, 74, 75, 76, 77]. The coupling will be inaccessible until a high energy or collider is in operation. Studies of the coupling however, will be possible before then using single top production at the Tevatron.
In this section we examine the effects on single top quark production and on its decay kinematics of a deviation in the coupling from the standard model structure, and we consider how this will affect a measurement of the CKM matrix element . In the standard model, the coupling is proportional to and has (–) structure. As explained in the introduction, the cross section for single top quarks includes the coupling directly, in contrast to pair production. Therefore, single top production provides a unique opportunity to study the structure and to measure . Experimental studies of this type are among the main goals of single top physics. Because high statistics will be required to make sensitive measurements, all the results given in the remaining subsections of this paper are for single top events produced in Runs 2 or 3 of the Tevatron; that is, from 1999 onwards, with a collision energy of .
A Anomalous (+) coupling
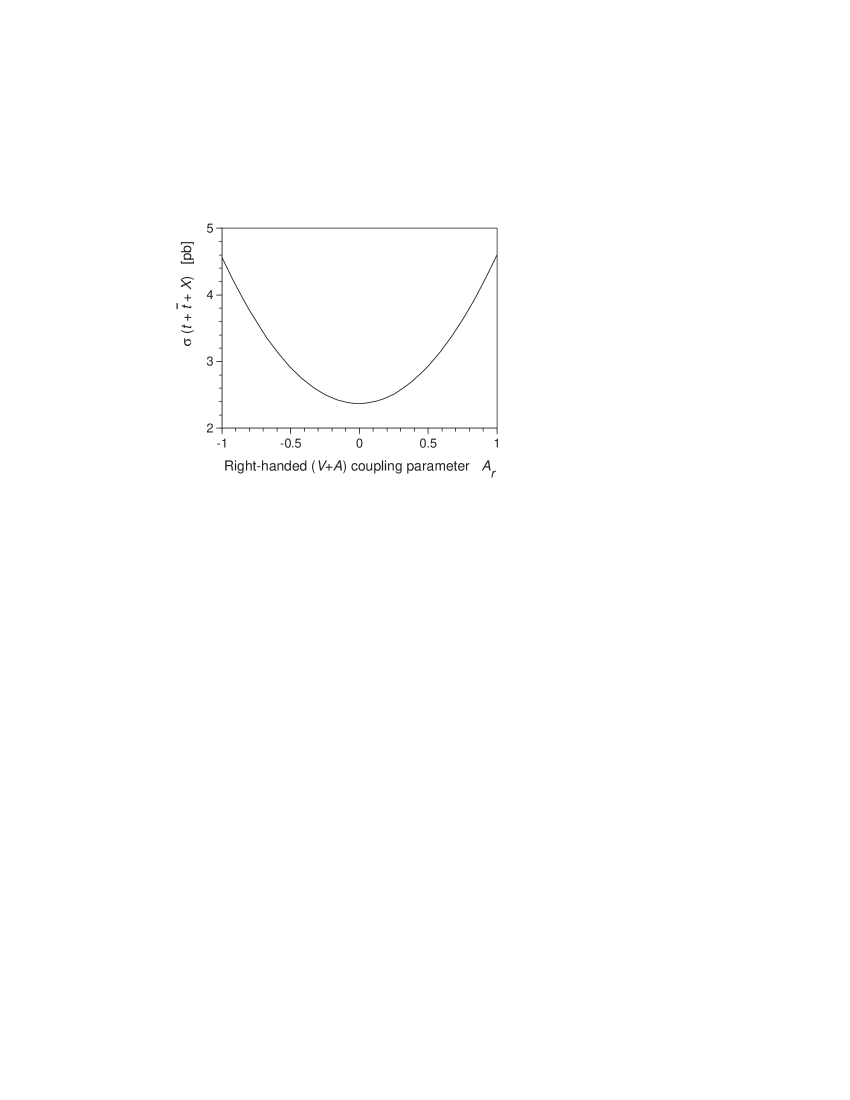
As an example of a deviation from the standard model coupling, we introduce an additional contribution from a nonstandard (+) structure with an arbitrary parameter , where the subscript refers to the right-handed current it represents. In the unitarity gauge, the coupling is given by:
where is the positron electric charge, , and and are Dirac matrices.
The dependence of the total single top quark cross section on the parameter is shown in Fig. 9, for , , and . Here, . The standard model value of is zero. The production rate varies almost quadratically with , and is nearly symmetric about the point . The cross section rises from 2.44 pb when to 4.68 pb when and to 4.73 pb when .
B Sensitivity in the (,) plane
We have calculated the region in the (,) plane for which there will be experimental sensitivity using future single top measurements. If one finds a number of single top events consistent with the standard model prediction, then it may be that the coupling is purely left-handed, and that is close to unity. Alternatively, the cross section could be boosted by an anomalous contribution to the coupling, as shown for example in Fig. 9, with correspondingly lower.
The error on the measurement of is dependent on the error on the single top cross section, including both experimental and theoretical contributions. First we estimate the experimental error for a top quark of mass 180 GeV at as follows: we take the integrated luminosity for Tevatron Run 2 as 2 fb-1, with an error of 5%; the signal acceptance including at least one tag as 0.20, from the TeV-2000 study of single top production [78], with an error of 7%; and a signal to background ratio of 1:2, with a systematic error on the background of 7%. The available branching fraction includes both the electron and muon decay channels, giving . In Run 2, all accessible modes of single top production will have to be used together in order not to make a statistics-limited measurement. We use here the value 2.44 pb for the single top cross section (= 0.72 pb (s-channel) + 1.72 pb (t- and u-channels)) from cteq3m. These assumptions lead to a prediction that approximately 650 events will be found in a search, with one third coming from single top production and two thirds from various backgrounds (e.g. , light jets with a mistag, ). Therefore, the experimental error on the total single top cross section will be 10% (statistical) 16% (systematic) = 19%, where the symbol means “add in quadrature”.
The error on the theoretical calculation of the cross section includes contributions from the choice of parton distribution function and from the scale, as discussed earlier in this paper, where they were found to be 12%. However, there is another contribution, not well quantified, from the lack of knowledge of the gluon distribution in the proton and antiproton for t- and u-channel single top processes. This error has been variously reported to the authors as 30% [79] and 10% [80], and so we use these values here to estimate the error on the theoretical total single top cross section at 32% or 16%.
The error on a measurement of will be half the error on the single top cross section, since the cross sections for all single top processes are proportional to . This results in an error on of or from the Tevatron Run 2, depending on one’s view of the knowledge of the gluon momentum distributions in the proton sea.
There may be a Run 3 at the Tevatron from 2002 onwards, producing 30 fb-1 of data. This high luminosity mode of collider running is known as “TeV33” after the planned instantaneous luminosity of cm-2s-1. With such high statistics available, it has been shown by Stelzer and Willenbrock [22] that using just s-channel production with double tagging instead of all single top modes with only one tag will eliminate most of the uncertainty on the theoretical cross section, because there will no longer be any contributions from processes with initial state gluons. They also showed that the measurement should be possible using 3 fb-1 of data. We update their calculation here for Run 3, including estimates of the systematic errors. The cross section for is 0.716 pb, with , and . To estimate the error on using Run 3 data, we make the following assumptions: the error on the luminosity remains at 5%; the signal acceptance for single top is 0.08 when requiring a double tag, as shown in Ref. [22], with a 1.8% error; and the signal to background ratio is 1:2 (again from [22]), with a systematic error on the background of 1.8%. Therefore, an experiment at the Tevatron in Run 3 will see approximately 1,146 events when searching for single top production, with one third signal events and two thirds coming from various backgrounds (e.g. , light jets with two mistags, with , -gluon fusion, ). This observation will lead to a measurement of the single top production cross section with an error of 7% (statistical) 6% (systematic) = 10%. Smith and Willenbrock [24] show that the error on the theoretical cross section for single top production is only 3%, leading to an error on of 5%.
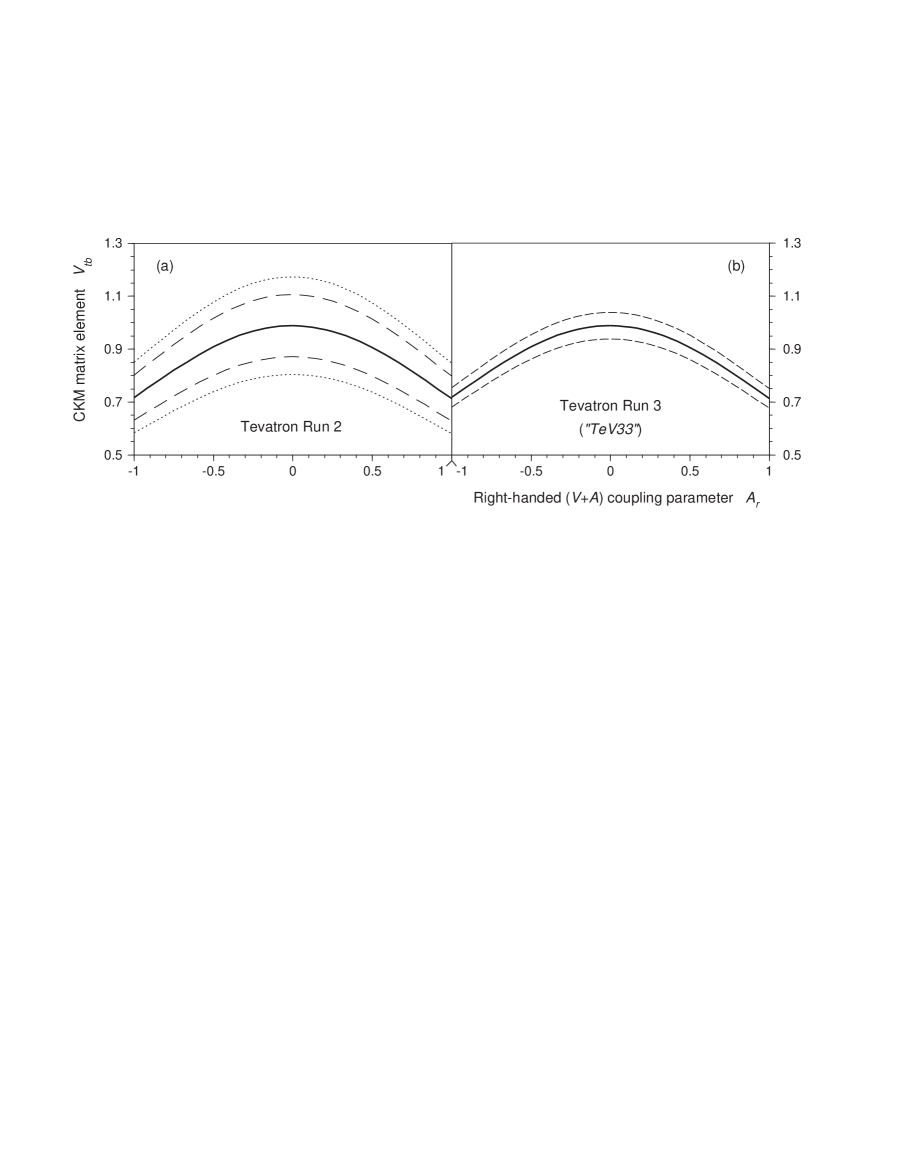
In Fig. 10 we show the results of these calculations, extended into the (,) plane. In plot (a) for Tevatron Run 2 (2 fb-1), the outer short-dashed contours show the result when the error on the theory cross section includes a 30% contribution from lack of knowledge of the gluon distribution. The inner long-dashed contours result from when this error contributes only 10% to the overall measurement. Plot (b) presents our estimates for Tevatron Run 3, “TeV33” (30 fb-1), with the dashed contours showing the precision obtainable using a theory error of only 3% and an experimental search to isolate the s-channel mode of single top. We discuss in the next section how one might distinguish standard model production from the (+) scenario discussed above where the effects of an elevated cross section caused by the anomalous coupling cancel with a reduced value of from a possible mixing of the top quark with a new fourth generation quark to give an observed number of events consistent with the standard model.
C Polarization of the top quark
Top quark polarization depends strongly on the structure of the coupling, and one might expect an asymmetry in angular distributions of the final state partons for different values of . For example, standard model single top is produced almost 100% left-handedly polarized because of the left-handed current structure of the coupling, whereas if , the top quark is not polarized at all. To calculate polarization effects using Monte Carlo generators, it is necessary either to keep the polarization of all particles in the final states of the and processes being studied (i.e. , , ), with subsequent decays of the polarized top quark and boson (, ), or else one needs to calculate the higher order and processes (i.e. , , ), with the top quark and boson treated as resonances in the intermediate states. The second method automatically includes the polarizations of the intermediate state and . To study the differences between kinematic distributions when the polarizations of the top quark and boson have been taken into account with those where they are assumed to be unpolarized (as in most Monte Carlo generators, e.g. pythia), we have calculated the and processes for the three significant single top production modes using comphep alone, and compared the results with calculations where we used comphep for the and single top processes, and pythia for the subsequent and decays.
Our direct calculations show that the and distributions are not sensitive to the polarization of the top quark.
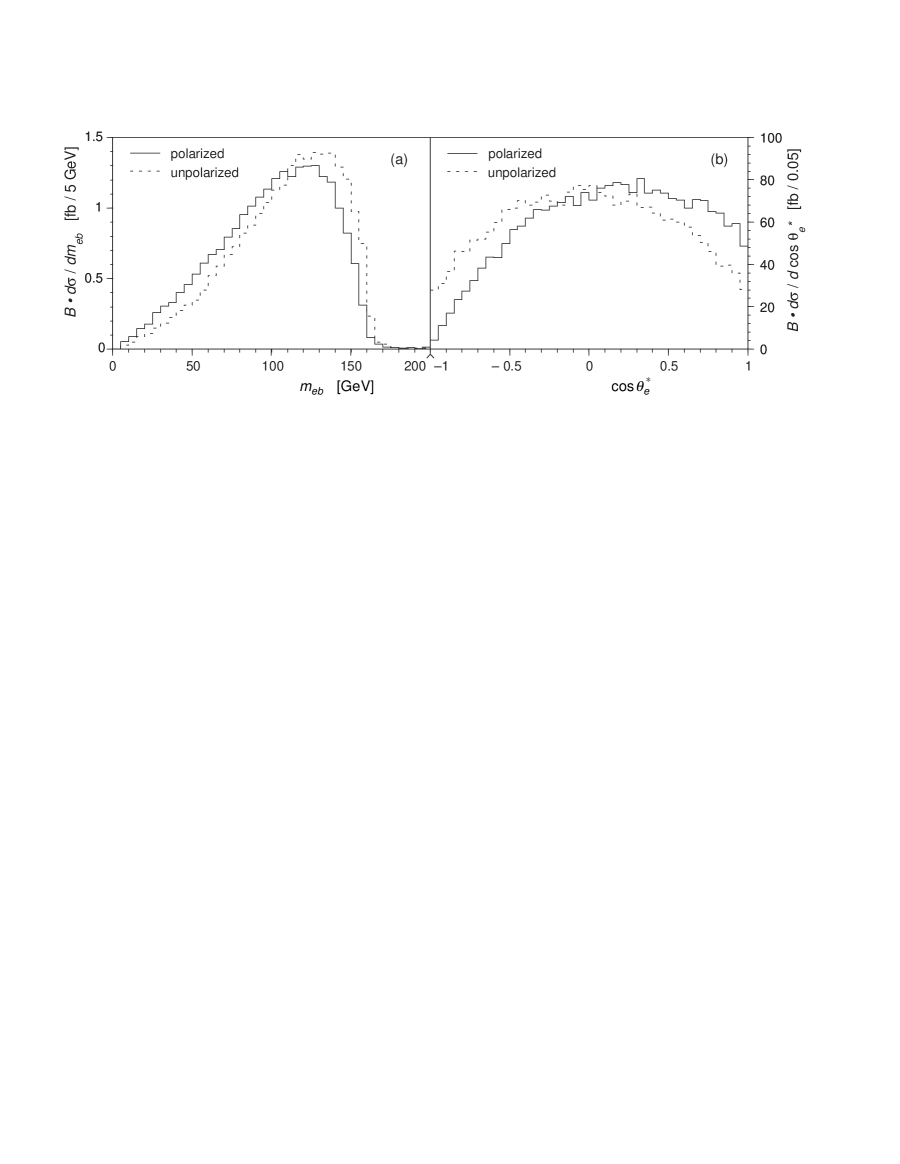
Two representative examples of distributions expected to reflect the top quark polarization effects are the invariant mass of the positron and the quark, , and the cosine of the polar angle, . The invariant mass is given by:
where is the momentum of the positron or quark along the beam direction.
The polar angle is defined as the angle between the positron direction and the axis within the rest frame of the boson, where the axis is defined to be in the direction of motion of the boson in the rest frame of the top quark [16]. The cosine of this angle is given approximately by:
Figure 11 shows the distributions of (a) and (b) , for the case when polarizations of the top quark and boson have been properly taken into account (solid histogram), and for when summation over the polarization of the top quark decay products has been done using the subsequent decays of an unpolarized top quark and boson (dashed histogram). One can see that there are indeed differences in these distributions for the polarized and unpolarized cases. In particular, an asymmetry (or lack of it) in when the positron is emitted aligned or antialigned with the direction of motion of the boson in the top rest frame should be observable with high statistics. All three modes of single top production exhibit this same behavior. The two variables and can also be used in combination with the total single top production rate, which is sensitive to the coupling structure as shown previously, to further our understanding of the coupling.
D Top quark partial width
From our previous estimates of the sensitivity for measuring the single top cross section at future Tevatron runs, we can obtain the expected precision on the top quark partial width . In the standard model, the top quark partial width is very nearly the same as its full width, since is so close to 1. The top partial width is directly proportional to the single top cross section, and so the error on the width is just the experimental measurement error on the cross section added in quadrature with the theoretical calculation error. Thus in Run 2 the top quark width should be measured with an error of or , depending on whether the uncertainty on the gluon distribution function is 30% or 10%. In Run 3, this precision can be improved to , which is comparable to what can be achieved at a linear collider [81] using a threshold scan.
IV Conclusions
In this paper we have reported the results of new studies of single top quark physics at the Fermilab Tevatron collider. We have made consistent calculations of the tree level cross sections for each mode of single top production as a function of top quark mass, parton distribution function, QCD scale, and collision energy. We discussed details of the calculations for several of the subprocesses involved, and gave breakdowns of the various contributions to the overall cross sections. For a top quark of mass 180 GeV, at , with , and taking the mean result from cteq3m and mrs(a′), we find that the leading order total single top plus antitop cross section is pb.
We have shown for each subprocess separately the transverse momentum and pseudorapidity distributions of the top quark, the other quarks produced with it, and its decay products. These kinematic distributions need to be understood in order to be able to separate signal from background in an experimental search.
We then considered the possibility for measuring the CKM matrix element and the coupling directly using single top events from the next Tevatron run. We estimated the sensitivity such measurements might have, and how an anomalous (+) term in the coupling would affect the measurement of . If there is no anomalous component to the coupling, then can be measured to a precision of 19% or 12% in Run 2 (1999–2001), with the two values coming from different estimates of the uncertainty in the gluon distribution function. In Run 3 (2002–2006), the precision on will be improved to 5%. The top quark polarization affects the angular distributions of its decay products, and we investigated how this could be used together with a measurement of the single top cross section to distinguish between various processes affecting the top quark beyond the standard model. Finally our estimates of the single top cross section error show that the top quark partial width will be measured to within 37%–25% in Run 2, and to a precision of 10% in Run 3.
We find the prospects for single top physics at the Tevatron exciting and that a rich program of studies will be possible in the future.
Acknowledgements
We would like to thank Dan Amidei, Phil Baringer, Pavel Ermolov, Paul Grannis, Asher Klatchko, Wu-Ki Tung, Harry Weerts, Scott Willenbrock, and C.-P. Yuan for useful discussions during this work. We would also like to thank the Moscow State University CompHEP group, especially Slava Ilyin and Alexander Pukhov for their help with the latest version of comphep. E.B. and A.B. thank the DØ Collaboration for their kind hospitality during our stay at Fermilab. We acknowledge the financial support of the U.S. Department of Energy under grant number DE–FG03–94ER40837, and the Ministry of Science and Technology Policy in Russia. This work has also been supported in part by grant number M9B000 from the International Science Foundation, in part by RFBR grants 96-02-19773a and 96-02-18635a, and by grant 95-0-6.4-38 of the Center for Natural Sciences of the State Committee for Higher Education in Russia.
REFERENCES
- [1] S. Abachi et al., (DØ Collaboration), Phys. Rev. Lett. 74, 2632 (1995).
- [2] F. Abe et al., (CDF Collaboration), Phys. Rev. Lett. 74, 2626 (1995).
- [3] P. Grannis, plenary talk at the International Conference on High Energy Physics, Warsaw, 1996, reporting the analysis of the DØ and CDF collaborations.
- [4] A. Blondel, plenary talk at the International Conference on High Energy Physics, Warsaw, 1996, reporting the analysis of the LEP Electroweak Working Group and the SLD Heavy Flavor Group, CERN Internal Report No. LEPEWWG/96-02, available at http://www.cern.ch/LEPEWWG.
- [5] R.D. Peccei, S. Peris and X. Zhang, Nucl. Phys. B349, 305 (1991).
- [6] N. Cabibbo, Phys. Rev. Lett. 10, 531 (1963); M. Kobayashi and T. Maskawa, Prog. Theor. Phys. 49, 652 (1973).
- [7] R.M. Barnett et al., (Particle Data Group), Phys. Rev. D 54, 1 (1996).
- [8] S. Dawson, Nucl. Phys. B249, 42 (1985).
- [9] S.S.D. Willenbrock and D.A. Dicus, Phys. Rev. D 34, 155 (1986).
- [10] S. Dawson and S.S.D. Willenbrock, Nucl. Phys. B284, 449 (1987).
- [11] C.-P. Yuan, Phys. Rev. D 41, 42 (1990).
- [12] T. Moers, R. Priem, D. Rein and H. Reitler, in Proceedings of the ECFA Large Hadron Collider (LHC) Workshop: Physics and Instrumentation, Aachen, Germany, 1990, edited by G. Jarlskog and D. Rein (CERN, 1990) vol. 2, p. 418.
- [13] G.V. Jikia and S.R. Slabospitsky, Phys. Lett B295, 136 (1992).
- [14] R.K. Ellis and S. Parke, Phys. Rev. D 46, 3785 (1992).
- [15] G. Bordes and B. van Eijk, Z. Phys. C57, 81 (1993).
- [16] D.O. Carlson and C.-P. Yuan, Phys. Lett. B306, 386 (1993).
- [17] G. Bordes and B. van Eijk, Nucl. Phys. B435, 23 (1995).
- [18] D.O. Carlson and C.-P. Yuan, MSUHEP–40903 (March 1995).
- [19] D.O. Carlson and C.-P. Yuan, to appear in Proceedings of the Workshop on Physics of the Top Quark, Ames, Iowa, (May 1995), hep-ph/9509208.
- [20] A.P. Heinson, A.S. Belyaev and E.E. Boos, to appear in Proceedings of the Workshop on Physics of the Top Quark, Ames, Iowa, (May 1995), hep-ph/9509274.
- [21] S. Cortese and R. Petronzio, Phys. Lett. B253, 494 (1991).
- [22] T. Stelzer and S. Willenbrock, Phys. Lett. B357, 125 (1995).
- [23] R. Pittau, Phys. Lett. B386, 397 (1996).
- [24] M. Smith and S. Willenbrock, Phys. Rev. D 54, 6696 (1996).
- [25] D. Atwood, S. Bar-Shalom, G. Eilam and A. Soni, Phys. Rev. D 54, 5412 (1996).
- [26] C.S. Li, R.J. Oakes and J.M. Yang, to appear in Phys. Rev. D, hep-ph/9608460.
- [27] C.S. Li, R.J. Oakes and J.M. Yang, hep-ph/9611455.
- [28] D.O. Carlson, E. Malkawi and C.-P. Yuan, Phys. Lett. B337, 145 (1994).
- [29] E. Malkawi and C.-P. Yuan, Phys. Rev. D 50, 4462 (1994).
- [30] C.-P. Yuan, Mod. Phys. Lett. A10, 627 (1995).
- [31] T.G. Rizzo, Phys. Rev. D 53, 6218 (1996).
- [32] G. Mahlon and S. Parke, hep-ph/9611367.
- [33] M. Katuya, J. Morishita, T. Munehisa and Y. Shimizu, Prog. Theor. Phys. 75, 92 (1986).
- [34] V. Barger and K. Hagiwara, Phys. Rev. D 37, 3320 (1988).
- [35] M. Raidal and R. Vuopionperä, Phys. Lett. B318, 237 (1993).
- [36] O. Panella, G. Pancheri and Y.N. Srivastara, Phys. Lett. B318, 214 (1993).
- [37] K. Hagiwara, M. Tanaka and T. Stelzer, Phys. Lett. B325, 521 (1994).
- [38] S. Ambrosanio and B. Mele, Z. Phys. C63, 63 (1994).
- [39] E. Boos et al., Phys. Lett. B326, 190 (1994).
- [40] N.V. Dokholian and G.V. Jikia, Phys. Lett. B336, 251 (1994).
- [41] E. Boos, Y. Kurihara, Y. Shimizu, M. Sachwitz, H.J. Schreiber and S. Shichanin, Z. Phys. C70, 255 (1996).
- [42] M.-L. Qian, W.-G. Ma, L.-Z. Sun and Y.-Y. Liu, J. Phys. G20, 895 (1994).
- [43] A. Ballestrero, V.A. Khoze, E. Maina, S. Moretti and W.J. Stirling, Z. Phys. C72, 71 (1996).
- [44] G.V. Jikia, Nucl. Phys. B374, 83 (1992).
- [45] E. Yehudai, S. Godfrey and K.A. Peterson, in Proceedings of the Second International Workshop on Physics and Experiments with Linear Colliders, Waikoloa, Hawaii, 1993, edited by F.A. Harris, S.L. Olsen, S. Pakvasa and X. Tata, (World Scientific, 1993) vol. 2, p. 568.
- [46] E. Boos, A. Pukhov, M. Sachwitz and H.J. Shreiber, to appear in Z. Phys. C, hep-ph/9610424.
- [47] E.E. Boos et al., in Proceedings of the XXVIth Rencontres de Moriond, High Energy Hadronic Interactions, Les Arcs, France, 1991, edited by J. Tran Than Van, (Editions Frontieres, 1991) p. 501; E.E. Boos et al., in Proceedings of the Second International Workshop on Software Engineering, Artificial Intelligence and Expert Systems for High Energy and Nuclear Physics, La Londe Les Maures, France, 1992, edited by D. Perret-Gallix, (World Scientific, 1992), p. 665. comphep is available at http://theory.npi.msu.su/pukhov/comphep.html
- [48] S. Kawabata, Comp. Phys. Commun. 41, 127 (1986).
- [49] V.A. Ilyin, D.N. Kovalenko and A.E. Pukhov, INP MSU Preprint-95-2/366, Moscow State University, (1995).
- [50] G.P. Lepage, J. Comput. Phys. 27, 192 (1978).
- [51] T. Sjöstrand, Comput. Phys. Commun. 82, 74 (1994). Pythia version 5.7 was used.
- [52] H.L. Lai et al., (CTEQ Collaboration), Phys. Rev. D 51, 4763 (1995).
- [53] A.D. Martin, R.G. Roberts, W.J. Stirling, Phys. Lett. B354, 155 (1995).
- [54] W.A. Bardeen, A.J. Buras, D.W. Duke and T. Muta, Phys. Rev. D 18, 3998 (1978).
- [55] H.L. Lai et al., (CTEQ Collaboration), hep-ph/9606399.
- [56] A.D. Martin, R.G. Roberts and W.J. Stirling, Phys. Lett. B387, 419 (1996).
- [57] V.N. Gribov and L.N. Lipatov, Sov. J. Nucl. Phys. 15, 438 (1972); 15, 675 (1972); Yu.L. Dokshitzer, Sov. Phys. JETP 46, 641 (1977); G. Altarelli and G. Parisi, Nucl. Phys. B126, 298 (1977).
- [58] R.M. Barnett, H.E. Haber and D.E. Soper, Nucl. Phys. B306, 697 (1988).
- [59] F.I. Olness and W.-K. Tung, Nucl. Phys. B308, 813 (1988).
- [60] W.-K. Tung, private communication.
- [61] E.L. Berger and H. Contopanagos, Phys. Lett. B361, 115 (1995); Phys. Rev. D 54, 3085 (1996).
- [62] J. Botts et al., (CTEQ Collaboration), Phys. Lett. B304, 159 (1993).
- [63] U. Heintz et al., “Light Higgs Physics at the Tevatron”, in Future Electroweak Physics at the Fermilab Tevatron – Report of the tev_2000 Study Group, Fermilab, 1996, edited by D. Amidei and R. Brock, (FERMILAB–PUB–96/082), p. 136.
- [64] G. Marchesini et al., Comp. Phys. Commun. 67, 465 (1992).
- [65] N.G. Deshpande, B. Margolis and H.D. Trottier, Phys. Rev. D 45, 178 (1992).
- [66] D. Atwood, A. Aeppli and A. Soni, Phys. Rev. Lett. 69, 2754 (1992).
- [67] D. Atwood, A. Kagan and T.G. Rizzo, Phys. Rev. D 52, 6264 (1995).
- [68] C.-S. Huang and T.-J. Li, Z. Phys. C68, 319 (1995).
- [69] K. Cheung, Phys. Rev. D 53, 3604 (1996).
- [70] J. Berger, A. Blotz, H.-C. Kim and K. Goeke, Phys. Rev. D 54, 3598 (1996).
- [71] T. Tait and C.-P. Yuan, hep-ph/9611244.
- [72] C.T. Hill, Phys. Lett. B266, 419 (1991).
- [73] C.T. Hill and S.J. Parke, Phys. Rev. D 49, 4454 (1994).
- [74] E. Eichten and K. Lane, Phys. Lett. B327, 129 (1994).
- [75] L.L. Smith, P. Jain and D.W. McKay, to appear in Proceedings of the 9th Annual American Physical Society Division of Particles and Fields Meeting, Minneapolis, MN, (August 1996), hep-ph/9608328.
- [76] A. Datta and X. Xhang, hep-ph/9611247.
- [77] E.H. Simmons, hep-ph/9612402.
- [78] D. Amidei et al., “Top Physics”, in Future Electroweak Physics at the Fermilab Tevatron – Report of the tev_2000 Study Group, Fermilab, 1996, edited by D. Amidei and R. Brock, (FERMILAB–PUB–96/082), p. 13.
- [79] C.-P. Yuan, private communication.
- [80] H. Weerts, private communication.
- [81] R. Frey, to appear in Proceedings of the 3rd Workshop on Physics and Experiments with Linear Colliders, Iwate, Japan, 1995, hep-ph/9606201.
| Single Top Process | Cross Section [pb] | |
|---|---|---|
| cteq3m | mrs(a′) | |
| 1. | 0.2847 | 0.2772 |
| 1.1 | 0.2510 | 0.2452 |
| 0.2423 | 0.2370 | |
| 0.0044 | 0.0040 | |
| Other modes | 0.0043 | 0.0042 |
| 1.2 | 0.0337 | 0.0320 |
| 0.0213 | 0.0200 | |
| 0.0009 | 0.0009 | |
| 0.0016 | 0.0015 | |
| 0.0080 | 0.0077 | |
| Other modes | 0.0019 | 0.0019
|
| 2. | 0.5697 | 0.5059 |
| 2.1 | 0.2448 | 0.2013 |
| 0.1607 | 0.1333 | |
| 0.0063 | 0.0048 | |
| 0.0075 | 0.0056 | |
| 0.0403 | 0.0338 | |
| Other modes | 0.0300 | 0.0238 |
| 2.2 | 0.3249 | 0.3046 |
| 0.2162 | 0.2034 | |
| 0.0080 | 0.0073 | |
| 0.0100 | 0.0089 | |
| 0.0559 | 0.0540 | |
| Other modes | 0.0348 | 0.0310
|
| 3. | 0.0658 | 0.0573 |
| 3.1 | 0.0418 | 0.0346 |
| 0.0209 | 0.0173 | |
| 0.0209 | 0.0173 | |
| 3.2 | 0.0027 | 0.0026 |
| 0.0024 | 0.0023 | |
| 0.0000 | 0.0000 | |
| 0.0003 | 0.0003 | |
| 0.0000 | 0.0000 | |
| 3.3 | 0.0213 | 0.0201
|
| 0.9202 | 0.8404 | |
| Total Single Top Cross Section [pb] | |||||||||
|---|---|---|---|---|---|---|---|---|---|
| Lower | Central | Upper | Lower | Central | Upper | Lower | Central | Upper | |
| [GeV] | bound | value | bound | bound | value | bound | bound | value | bound |
| 140 | 4.15 | 4.61 | 5.19 | 1.70 | 1.83 | 2.02 | 0.32 | 0.39 | 0.48 |
| 150 | 3.20 | 3.56 | 4.03 | 1.21 | 1.33 | 1.45 | 0.24 | 0.29 | 0.36 |
| 160 | 2.51 | 2.79 | 3.17 | 0.88 | 0.98 | 1.07 | 0.18 | 0.22 | 0.28 |
| 170 | 1.98 | 2.21 | 2.52 | 0.66 | 0.74 | 0.80 | 0.14 | 0.16 | 0.21 |
| 180 | 1.58 | 1.76 | 2.02 | 0.50 | 0.56 | 0.61 | 0.10 | 0.12 | 0.16 |
| 190 | 1.26 | 1.42 | 1.63 | 0.39 | 0.43 | 0.47 | 0.08 | 0.09 | 0.12 |
| 200 | 1.02 | 1.15 | 1.32 | 0.30 | 0.34 | 0.37 | 0.06 | 0.07 | 0.09 |
| 210 | 0.83 | 0.93 | 1.07 | 0.24 | 0.27 | 0.30 | 0.04 | 0.06 | 0.07 |
| 220 | 0.67 | 0.76 | 0.88 | 0.19 | 0.21 | 0.24 | 0.03 | 0.04 | 0.05 |
| Lower | Central | Upper | Lower | Central | Upper | Lower | Central | Upper | |
| [GeV] | bound | value | bound | bound | value | bound | bound | value | bound |
| 140 | 0.85 | 0.95 | 1.07 | 1.13 | 1.43 | 1.81 | 2.13 | 2.38 | 2.69 |
| 150 | 0.69 | 0.78 | 0.88 | 0.92 | 1.16 | 1.49 | 1.75 | 1.94 | 2.22 |
| 160 | 0.57 | 0.65 | 0.73 | 0.75 | 0.94 | 1.23 | 1.44 | 1.59 | 1.83 |
| 170 | 0.47 | 0.54 | 0.60 | 0.62 | 0.77 | 1.01 | 1.18 | 1.31 | 1.51 |
| 180 | 0.39 | 0.45 | 0.50 | 0.50 | 0.63 | 0.83 | 0.97 | 1.08 | 1.25 |
| 190 | 0.32 | 0.37 | 0.42 | 0.41 | 0.52 | 0.68 | 0.80 | 0.89 | 1.03 |
| 200 | 0.27 | 0.31 | 0.35 | 0.34 | 0.43 | 0.56 | 0.66 | 0.74 | 0.86 |
| 210 | 0.23 | 0.26 | 0.29 | 0.28 | 0.35 | 0.46 | 0.54 | 0.61 | 0.71 |
| 220 | 0.19 | 0.22 | 0.25 | 0.22 | 0.29 | 0.38 | 0.44 | 0.51 | 0.58 |