Future Diffractive Structure Function
Measurements at HERA111To appear
in the proceedings of the workshop “Future Physics at HERA”,
DESY, Hamburg, 1996.
A. Mehtaa, J. Phillipsb, B. Waughc
a Rutherford-Appleton Laboratory
b University of Liverpool
c University of Manchester
Abstract: The purposes and possibilities of future diffractive structure function measurements at HERA are presented. A review of the current range and accuracy of the measurement of is presented and an estimate of the precision of future measurements is given. A feasibility study is performed on the measurement of the structure functions , , , and . Included in this study are estimates of the integrated luminosity required, the analysis techniques to be employed and values of systematic error that could be expected.
1 Introduction
The first pioneering measurements of the deep inelastic diffractive cross section at HERA have yielded great insight into the mechanism of diffractive exchange and the partonic structure of the pomeron [1, 2, 3, 4]. The precision of present measurements is, however, inadequate for the study of many quantitative aspects of this picture. The origin of the gluonic structure of the pomeron and the interface between soft and hard physics are unresolved questions that would benefit from the higher luminosity offered by HERA in the years to come. In addition, the substantially different partonic structure of the pomeron in comparison to usual hadrons makes diffraction a challenging test for perturbative QCD [5]. Furthermore, it has been suggested that the emerging data from HERA may provide fundamental insight into the non-perturbative aspects of QCD, leading to a complete understanding of hadronic interactions in terms of a Reggeon Field Theory [6].
In this paper we study the measurements that can be made of inclusive diffractive cross sections with the luminosities which may be achieved in the future running of HERA. We evaluate what precision is possible for these measurements, and attempt to highlight those measurements which will be of particular relevance to achieving significant progress in our understanding of QCD .
2 Experimental Signatures of Diffractive Dynamics
A prerequisite for any precision measurement of a hadronic cross section is that it must be defined purely in terms of physically observable properties of the outgoing particles. Since there is, as yet, only the beginnings of a microscopic understanding of the mechanism responsible for diffractive dynamics, and since there are a plethora of wildly different predictions for how the diffractive cross section should depend on all of the kinematic variables, it is the experimentalist’s job to provide a well defined measurement unfettered by any ad hoc assumptions about how the cross section should behave.
For the interaction (Anything) the cross section is usually measured differentially as a function of the two kinematic variable and defined as follows:
| (1) |
where and are the 4-momenta of the exchanged virtual boson and incident proton respectively, and is the fractional energy loss of the electron in the rest frame of the proton. The differential cross section may then be related to the proton structure functions and by:
| (2) |
Such an interaction may be further characterised by dividing the total hadronic final state (i.e. the final state system excluding the scattered lepton) into two systems, and , separated by the largest gap in true rapidity distribution of particles in the - centre of mass system, as shown in figure 1.

When the masses of these two systems, and , are both much smaller than the centre of mass energy then a large rapidity gap between the two systems is kinematically inevitable, and the interactions are likely to be dominantly diffractive.
The two additional kinematic degrees of freedom may be specified by introducing the variables , and :
| (3) |
| (4) |
| (5) |
The hadronic cross section to be measured is therefore . The presence of a rapidity gap may then be identified experimentally by use of the calorimeters and forward detectors of the experiments. For sufficiently small values of , the system will be completely contained in the central calorimeters, allowing an accurate determination of and . Tagging of energy in the very forward direction allows both the mass of system and the magnitude of to be constrained, but does not allow a direct measurement of .
A leading proton spectrometer (LPS) “tags” particles which follow closely the path of the outgoing proton beam separated by only a very small angle. By tagging the particle at several points along it’s trajectory and with detailed knowledge of the magnetic field optics between the interaction point and the tagging devices, it is possible to reconstruct the original vector momentum of the particle. Thus it is possible to select a sample of events containing a “leading” proton with . An LPS permits an accurate measurement of , and provides an independent method of selecting interactions sensitive to diffractive dynamics. Since there is no need for all the hadrons of system to be contained within the main calorimeter it is possible to make measurements at higher values of , so that subleading contributions to the cross section may be confirmed and further investigated.
Regge phenomenology has been highly successful in correlating many features of the data for both elastic and inelastic hadron–hadron cross sections [7]. At high energies (low ) the data are dominated by the contribution from the leading trajectory of intercept . The most simple prediction of Regge phenomenology is that at fixed the cross section should vary where is related to the intercept of the leading trajectory by .222 It is worth pointing out that at then is the basic Regge variable, not as is sometimes assumed. The size of the rapidity gap is kinematically related to the value of by [8]. It is easy to show that at fixed the rapidity gap distribution is then related to by:
| (6) |
Hence for the production of large rapidity gaps is exponentially suppressed, whilst for it is exponentially enhanced [9]. With fixed, then extensions of the simple Regge model are necessary to predict the dependence. For sufficiently large masses, it is perhaps possible to use Müller’s extension of the optical theorem [10] (“Triple Regge”) to achieve this aim, and for small masses the vector meson dominance model [11] may be appropriate.
There is much evidence from hadron–hadron data [7], and some from data [4] that additional (“sub–leading”) trajectories are necessary to reproduce the measured hadronic cross sections. The Regge formalism permits dependent interference between some of the different contributions rendering problematic any theoretical predictions for the dependence of the measured hadronic cross sections on , , or .
Estimates of the diffractive contribution to both deep–inelastic and photoproduction cross sections have been made using the dependence at fixed [2].
3 Future Measurements of
The 1994 H1 data [3, 4], corresponding to , have allowed a measurement of to be made in the kinematic region GeV2, and . For this was achieved by taking data with the nominal interaction point shifted by allowing lower angles to be covered by the backward electromagnetic calorimeter.
The dependence of on was found not to depend on but to depend on , demonstrating that the factorisation of the cross section into a universal diffractive flux (depending only on ) and a structure function (depending only on and ) is not tenable. These deviations from factorisation were demonstrated to be consistent with an interpretation in which two individually factorisable components contribute to . These two components could be identified with pomeron () and meson contributions , where and . Scaling violations, positive with increasing for all , were observed and could be interpreted in terms of a large gluon component in the diffractive exchange, concentrated near at [12, 13, 3, 4].
Given the significant progress in the understanding of diffractive dynamics that has been achieved with the existing data, the goal of future measurements is twofold: to extend the kinematic regime of existing measurement, and to achieve highest possible precision, particularly where existing measurements have uncovered interesting physics. In the 1994 measurement, with bins per decade in both and , and bins in between and , then in the interval there were an average of events per bin, corresponding to a statistical accuracy of 333The variation of the cross section with of approximately was partially offset by an increasing bin size with increasing .. The different sources of systematic error for the 1994 measurement are shown in table 1, along with an estimate of the level to which they may be reduced in the future.
| H1 1994 Preliminary | H1 Future | |
|---|---|---|
| Error Source | ||
| Main Calo’ Hadronic E Scale: | ||
| Backward Calo’ Hadronic E Scale: | ||
| Backward Calo’ Elec. E Scale: | ||
| Tracking Momentum Scale | ||
| Scattered Lepton Angle: | ||
| dependence: | ||
| dependence: | ||
| dependence | ||
| / resolution | ||
| Background (photoproduction and non-) | ||
| MC Statistics/Model Dependence | ||
The largest single error arises from the combination of limited Monte Carlo statistics () and different possible final state topologies leading to varying corrections for finite efficiency and resolution (). The latter contribution was estimated from the difference in the correction factors calculated for two possible interaction mechanisms:
-
•
a quark parton model process in which the couples directly to a massless quark in the exchange with zero transverse momentum,
-
•
a boson–gluon fusion process in which the couples to a gluon in the diffractive exchange through a quark box.
Numerous experimental measurements of diffractive final state topologies at HERA are now available [4] which constrain the data to lie between these two possibilities. Therefore, it is reasonable to assume that the error arising from a lack of knowledge of the final state topologies may be reduced by a factor of such that it no longer dominates the total error. Monte Carlo statistics can obviously be increased. Therefore, it is reasonable that in the future a measurement may be made with a total systematic uncertainty of or less. To reduce the statistical error to () would require () of data.
Less luminosity is required to achieve the same statistical precision at lower . However, to reach the lowest possible with the widest possible range in (and hence in ) it is advantageous to run with the interaction vertex shifted forwards along the proton beam direction. We calculate that of such data would give a statistical accuracy of in the region of overlap between nominal and shifted vertex data, allowing a precise cross check of the two analyses. It is important to note that the HERA magnets are not optimised for a shifted vertex configuration, and so such data take twice as long to collect as for the nominal configuration.
Theoretically, and consequently experimentally, the region of high is of particular interest. The evolution of with at high is expected to depend crucially upon which evolution equations are pertinent to diffractive dynamics. In particular, a DGLAP [15] QCD analysis [13, 3, 4] demonstrates that the H1 data are consistent with a large gluon distribution, concentrated near at . In this case then should begin to fall with increasing at for . The presence of a sufficiently large “direct” term in the evolution equations would lead to a indefinite increase with [16]. Thus a measurement of at high to the highest possible is desirable.
At fixed centre of mass energy the range of that may be accessed decreases with increasing such that:
| (7) |
The acceptance for a measurement of at , based upon the interval , therefore extends to a maximum of for , where the cross section is likely to be dominantly diffractive. To achieve statistical precision in a measurement in the interval (bin centre ) would require . However, a measurement of statistical precision, requiring only , would already be significant in light of theoretical calculations which differ by more than a factor of in this region.
4 Measurement of
For particles with (here is the proton beam energy) then the HERA magnets separate them from the proton beam allowing particles to be tagged for . For particles with then only those particles with transverse momentum may be tagged [18]. Consequently, for diffractive measurements then the acceptance in is limited to . For a process with a highly peripheral dependence then this limitation results in the loss of to of the total cross section. The geometrical acceptance of the current ZEUS detectors is [17], giving an overall acceptance in the region of .
Tantalising first measurements of the dependence of deep–inelastic events with a leading proton have been presented by the ZEUS collaboration [18]. The observed dependence on of , , lends strong support to a diffractive interpretation of such interactions. The measurements of differential in , and that will be possible with increased luminosity are eagerly awaited.
A preliminary measurement using an LPS has also been made [19]. In order to use measurements of to estimate it is necessary to extrapolate from the measured region at high into the region of no acceptance to . To make this extrapolation with the minimal assumptions about the dependence, it is necessary to have at least three bins in for each bin in , and . This means that of data are required to make a measurement of similar accuracy to the existing data for . Obviously it would be possible to study the dependence in aggregate volumes of phase space and make a measurements with a factor fewer statistics, relying upon model assumptions about the variation of the dependence with , and . Even with of data, the extrapolation into the region of no acceptance relies on the assumption that the dependence is the same in the measured and unmeasured regions. It is not clear that the resultant theoretical uncertainty will be less than the 5% uncertainty in the overall normalisation resulting from proton dissociation for existing measurements of .
The primary purpose of the LPS is the diffractive “holy grail” of measuring . Measurements of any possible “shrinkage” of the forward diffractive scattering amplitude (increasing peripherality of the dependence with decreasing ) are likely to have unique power for discriminating between different theoretical models of diffractive dynamics [5]. In addition, the ability to select subsamples of events in which there is an additional hard scale at the proton vertex is of great theoretical interest [5]. It is therefore of the utmost importance that the to of data necessary to make an accurate measurement of are collected by both collaborations with the LPS devices fully installed.
The LPS also allows measurements at higher for which the rapidity gap between the photon and proton remnant systems and becomes too small to observe in the main calorimeter. This will allow the contributions to the measured hadronic cross section from subleading trajectories to be further investigated. Combining information from the scattered lepton and proton will allow the invariant mass to be reconstructed in the region , where it would otherwise be impossible.
Tagged particles with will provide information about the way in which protons dissociate into higher mass systems. Particles thus produced are kinematically unlikely to generate a significant background in the region , but for larger then this background will become increasingly important.
5 On the Determination of
A fundamental question in the study of hard diffractive processes is the extent to which perturbative QCD dynamics may be factorised from the proton vertex. Some recent calculations of diffractive cross sections [20, 21] consider the interaction in terms of a hard (perturbative) phase producing a coloured partonic system which subsequently interacts with the colour field of the proton via the exchange of non-perturbative gluons. Such “soft colour interactions” [21] allow colour to be exchanged between the photon and proton remnant systems such that in some fraction of the events both will become colour singlet states separated by a potentially large rapidity gap. In such models the evolution of the effective parton distribution functions (PDFs) will be driven by the evolution of the PDFs of the proton. Alternatively, it is possible that the presence of a large rapidity gap will confine any evolution dynamics to within the photon remnant system . The effective PDFs will then depend only upon and , and not upon as in the former case.
The 1994 H1 data have been demonstrated to be consistent with a factorisable approach in which a large gluon distribution is attributed to the pomeron in the region or over the whole kinematic range for the sum of two individually factorisable components [4]. At next to leading order (NLO) then a large gluon distribution necessitates a large longitudinal structure function, :
| (8) |
A prediction for based upon a NLO QCD analysis of the data could be tested directly since the wide range in accessible at HERA leads to a wide variation in the centre of mass energy . This means that in factorisable models, at fixed and fixed the same partonic structure of the pomeron may be probed at different values of , corresponding to different values of :
| (9) |
If the dependence of the diffractive structure function can be factorised such that
| (10) |
and is non-zero, then a measurement of assuming =0 is lower than the correct value of by the factor :
| (11) |
Thus under the assumption of factorisation, a measurement of is possible by measuring the extent of the deviation from a simple extrapolation from higher . The size of this effect is shown for different values of in figure 2.
Also shown is the range covered by the existing 1994 data and the range that could be covered by future measurements at HERA. It is clear that in order to see this effect it is necessary to make a measurement at values above with a total error of less than . For high values of the extrapolation of into the high region of interest should not be significantly compromised by the possible presence of subleading trajectories, which contribute only at high (low ).
A comparison between the values of determined from such apparent deviations from factorisation and the values expected from a QCD analysis of constitutes a powerful test of both the validity of factorisation and the applicability of NLO QCD to diffraction at high .
6 Measurements of and
Since an evaluation of using the techniques described in the previous section require theoretical assumptions concerning factorisation, such an analysis is clearly no substitute for a direct measurement of the ratio of the longitudinal to transverse diffractive cross sections, . A good measurement of this quantity is vital for a full understanding of the diffractive mechanism and should provide an exciting testing ground for QCD. There is at present no theoretical consensus on what values to expect for , although all models suggest a substantial dependence on with most suggesting an extreme rise as [5]. A measurement of to any precision leads us into unexplored territory.
Measurements of have so far been restricted to DIS exclusive vector mesons production [22] by a direct measurement of the polarisation of the final state resonance. This method could perhaps be used for the bulk data if the directions of the final state partons could be inferred, but is likely to be difficult due to the problems of running jet analyses on low mass final states. Instead we investigate a slightly modified version of the method used to determine for inclusive DIS [23].
The general form relating the structure functions and to the differential diffractive cross section can be written in analogy to the inclusive cross sections [24].
| (12) |
where . Although a measurement of as a function of all 4 variables is the most desirable measurement and must be an experimental goal, statistical limitations are likely to mean that initial measurements must be made without a reliance on a leading proton spectrometer (LPS) and so is not measured. In this case we define and as
| (13) |
In this case is the ratio of the longitudinal to transverse cross section only if has no dependence on .
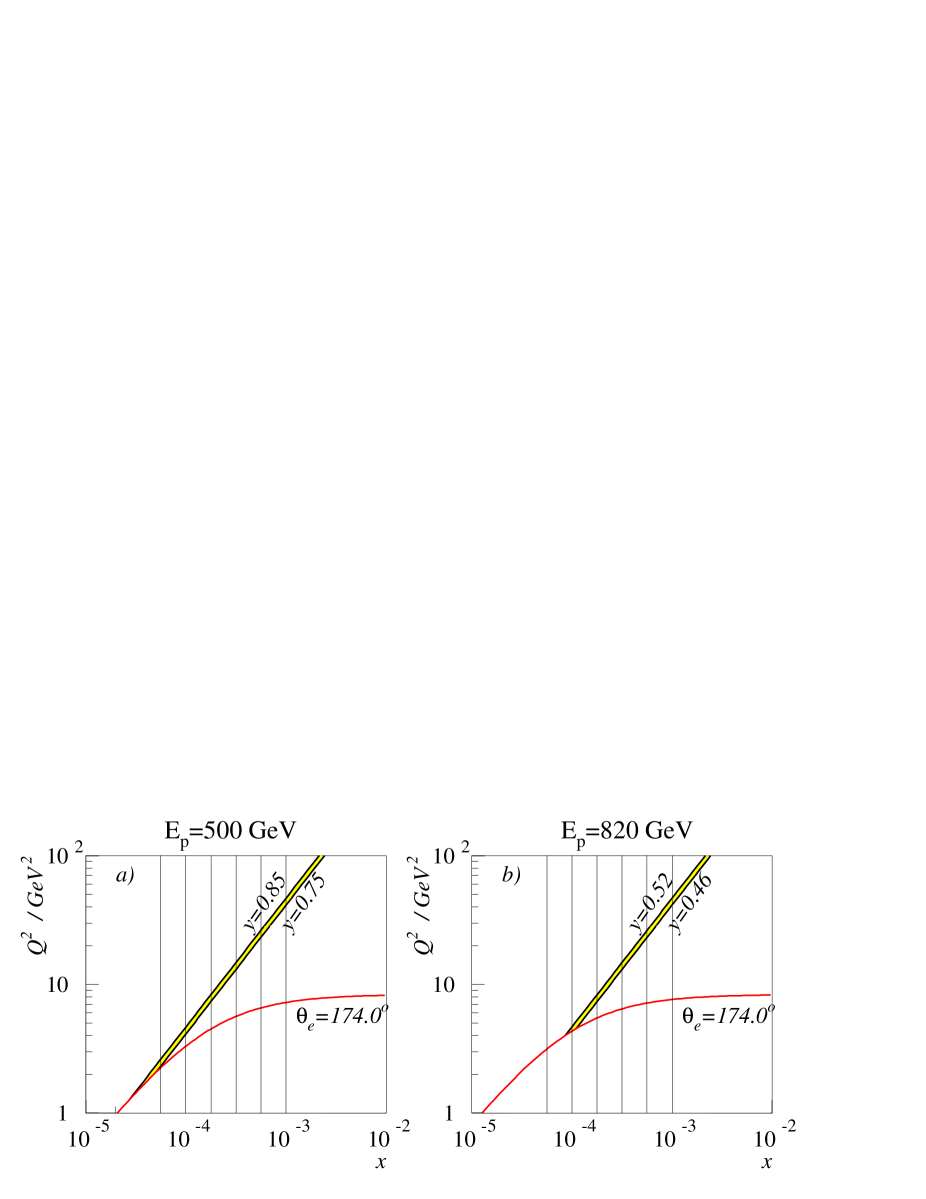
Analysis of equation 13 reveals that in order to make a measurement of independent of at least two cross sections must be compared at the same values of , and but different values of . This is achieved by varying the centre of mass energy, . There are of course many possible running scenarios for which either or both beam energies are changed to a variety of possible values. A full discussion on this point is given in [23]. For the present study we examine the case when the proton beam is roughly halved in energy from 820 GeV to 500 GeV and the electron beam remains at a constant energy of GeV so that data is taken at the 2 values of of and . This setup allows for a reasonable luminosity at the low proton beam energy and enables systematic uncertainties concerned with detection of the scattered electron to be minimised. In this scheme we make a measurement of the ratio of the differential cross sections, , for two values of , and (corresponding to the high and low values of ) for fixed , , and (if measuring ) . Equation 12 or 13 is then used to determine .
It is also apparent from equation 13 that in order to have the greatest sensitivity to measurements must be made at the highest possible (and thus lowest electron energy). This is illustrated in figure 3, where it can be seen that for values of (or lower) there is little change of for different values of . The upper limit in is crucially dependent on the ability of the detectors to discriminate and veto against photoproduction events in which a pion is misidentified as an electron. Experience has shown, however, that for the diffractive events the low mass of the final state reduces the chance of faking electron when compared to the more energetic non-diffractive events. For this study we take a central value of with a lower (upper) bin limit of 0.75 (0.85) so that good electron identification for energies above 4.15 GeV is assumed.

The kinematic range of the measurement projected onto the – plane is shown in figure 4 for both CMS energies. To ensure that the scattered electrons are well contained within the backward detectors we place a maximum cut of . This restricts us to and . In order to ensure good acceptance in the forward region we impose a cut of .
For low electron energies the kinematic variables are well reconstructed and have good resolutions if the electron only method is used [25, 26]. Since the major problem with this measurement will be in reducing the statistical error we select bins as large as possible whilst maintaining enough bins to investigate any variation of with the kinematic quantities. A suitable choice would be 4 bins per decade in , 4 bins in and if the LPS is used 2 bins in . The bins in and are optimised so as to contain approximately equal numbers of events at each value. Identical bins in these variables are used for both CMS energies.
In order to estimate the statistical errors on the measurement we used the RAPGAP generator [27] with a fit to the measured H1 [3] at and used equation 12 to determine the statistics at . We assumed 100% efficiency for measurements made without any LPS and 4% efficiency for those with. The expected number of events per integrated luminosity in each bin is summarised in table 2 for an example .
| Number of Events | Number of Events | |||
| without LPS | with LPS | |||
| GeV | GeV | GeV | GeV | |
| -4.125 | 41 | 28 | 0.82 | 0.56 |
| -3.875 | 36 | 25 | 0.72 | 0.50 |
| -3.625 | 19 | 13 | 0.38 | 0.27 |
| -3.375 | 9 | 6 | 0.18 | 0.12 |
For systematic errors we estimate an error of of 5%. This error is conservatively evaluated by taking the estimated error on (see above) and assuming any improvement that arises from taking a ratio is offset by increased uncertainty in the photoproduction background and radiative corrections.
An example of the sort of precision which may be obtained for a measurement of and is shown in figure 5. For this study we assumed that many more data would be obtained at the high CMS energy. It can be seen that for an integrated luminosity of 10 at the lower value a measurement of is statistically dominated with an error around 60% if for the lowest value of . For an integrated luminosity of 50 at the lower value statistical and systematic errors become comparable and can be measured to 40% accuracy. For measurements of very high integrated luminosities are required – at least a factor of 50 is needed for a similar precision to .

7 Measuring
Since the leading mechanism in QCD for the production of charm quarks is the boson gluon fusion process, the diffractive charm structure function is very sensitive to the gluonic component of the diffractive exchange. It is important to establish whether the measured is consistent with that expected from a QCD analysis of the scaling violations in . In addition, it has already been observed in the photoproduction of mesons that the charm quark mass provides a sufficiently large scale to generate the onset of hard QCD dynamics. The extend to which the charm component of exhibits a different energy () dependence to that of the total will provide insight into the fundamental dynamics of diffraction.
The method used here for tagging charm events uses the decay444Charge conjugate states are henceforth implicitly included. . The tight kinematic constraint imposed by the small difference between the and masses means that the mass difference is better resolved than the individual masses, and the narrow peak in provides a clear signature for production. The chosen decay mode is the easiest to use because it involves only charged tracks and because the low multiplicity means that the combinatorial background is small and that the inefficiency of the tracker does not cause a major problem.
A prediction of the observed number of events is obtained using RAPGAP with a hard gluon dominated pomeron structure function taken from a QCD analysis of [3]. The cross section predicted by this model for production in diffractive DIS is compatible with the value measured in [4]. The acceptance of the detector is simulated by applying cuts on the generated direction () and transverse momentum () of the decay products and on the energy of the scattered lepton (). The cut used is 150 MeV, which is approximately the value at which the H1 central and forward trackers reach full efficiency. This cut has a major influence on the acceptance for mesons, because the momentum of the slow pion is strongly correlated with that of the , so a with much less than 150 MeV GeV cannot be detected. The -dependence of the acceptance is shown in figure 6a. There is no obvious way of extending the tracker acceptance to lower , so this cut is not varied.
Figure 6b shows the average acceptance for a over the region and all values of and for . It can be seen that extending the angular coverage from the present range in the backward direction to in conjunction with lowering the scattered lepton energy cut used in present analyses significantly improves the acceptance, especially at low . Figure 7 shows the number of which one might expect to detect in the low- and high- regions with a total integrated luminosity of 750 pb-1. It can be seen that even with this large integrated luminosity, cross section measurements can only be made with an accuracy of 10% in this binning.
Whilst one waits for , it may be worthwhile attempting to increase the statistics by investigating other decay modes which are experimentally more demanding. The decay to has a branching fraction of nearly 70% [28] and is the only decay mode giving a charged track in addition to the decay products. However, the decay to has a branching fraction of slightly less than 4% [28], so there is clearly room for a large improvement in statistics if other channels can be used. For example the use of a silicon vertex detector close to the interaction point, such as that already partly installed in H1, should enable the secondary vertex from the decay of the , which has a decay length m [28], to be tagged. This could be used to extend the analysis to other channels, including semileptonic decays, which are otherwise difficult to use. The gain in statistics, neglecting the vertex-tagging inefficiency, can be up to a factor of (if all channels are used), with a further factor of available if inclusive production is used rather than relying on the decay.
8 Summary and Conclusions
We have argued that a precise hadron level definition of the cross section to be measured is essential in order that future high precision measurements of diffractive structure functions may be treated in a consistent theoretical manner. Although of integrated luminosity will be enough to achieve precision in the measurement of at moderate , in excess of is necessary to make a comprehensive survey of diffractive structure within the kinematic limits of HERA. An attempt to determine will be an important tool in establishing the validity of both factorisation and NLO QCD in diffractive interactions. A direct measurement of is shown to be feasible with of integrated luminosity taken at lower proton beam energy. A substantial integrated luminosity is demonstrated to be necessary to complete an exhaustive study of the diffractive production of open charm, although statistics can be markedly improved by exploiting the full range of possible charm decays.
References
-
[1]
H1 Collaboration, T. Ahmed et al.,
Phys. Lett. B348(1995) 681-696.
ZEUS Collaboration, M. Derrick et al. , Z. f. Physik C68(1995). - [2] ZEUS Collaboration, M. Derrick et al. , Z. f. Physik C70(1996).
-
[3]
A. Mehta, Proceedings of the Topical Conference on Hard Diffractive
Processes, Eilat, Israel, February 1996.
P. Newman, Proceedings of the International Workshop on Deep–Inelastic Scattering and Related Phenomena, Rome, Italy, April 1996, DESY-96-162. - [4] J. Phillips, Proceedings of the XXVIII International Conference on High Energy Physics, Warsaw, Poland, July 1996. See also contributed papers pa02-061, pa02-060, pa02-063 and pa02-068.
- [5] M. McDermott, G. Briskin, proceedings of the workshop “Future Physics at HERA”, DESY, Hamburg, 1996, and references therein.
- [6] A. R. White, “The Hard Gluon Component of the QCD Pomeron”, hep-ph/9609282.
-
[7]
A. Kaidalov, Phys. Rep. 50(1979) 157.
G. Alberi, G. Goggi, Phys. Rep. 74 (1981) 1.
K. Goulianos, Phys. Rep. 101 (1983) 169.
N. Zotov, V. Tsarev, Sov. Phys. Usp. 31(1988) 119. - [8] E. L. Berger et al. , Nucl. Phys. B286(1987) 704.
- [9] J. D. Bjorken, “Hadronic Final States in Deep–Inelastic Processes”, in “Current Induced Reactions: International Summer Institute in Theoretical Particle Physics in Hamburg 1975”, ed. J. G. Kröner, G. Kramer, and D. Schildknecht, Lecture Notes in Physics, Springer Verlag 1976.
- [10] A. Müller, Phys. Rev. D2 (1970) 2963.
-
[11]
J. J. Sakurai,
Phys. Rev. Lett. 22 (1969) 981
J. J. Sakurai and D. Schildknecht, Phys. Lett. 40B (1972) 121,
T. H. Bauer, R. D. Spital, D. R. Yennie, F. M. Pipkin, Rev. Mod. Phys. 50 (1978) 261. - [12] K. Golec–Biernat and J. Kwiecinski, Phys. Lett. B353.
- [13] J. Dainton and J. Phillips, Proceedings of the Workshop on Deep-Inelastic Scattering and QCD, Paris, France, April 24-28 1995.
- [14] H1 SpaCal Group, T. Nicholls et al., DESY preprint 95-165 (1995) and DESY preprint 96-013 (1996).
-
[15]
Yu. L. Dokshitzer, JETP 46 (1977) 641.
V. N. Gribov and L. N. Lipatov, Sov. Journ. Nucl. Phys. 15 (1972) 78.
G. Altarelli and G. Parisi, Nucl. Phys. B126 1977 298. - [16] T. Gerhmann and W. Stirling, Z. Phys C70, 89 (1996).
- [17] E. Gallo, M. Grothe, C. Peroni, J. Rahn, R. Sacchi, A. Solano, proceedings of the workshop “Future Physics at HERA”, DESY, Hamburg, 1996.
- [18] G. Wolf, Proceedings of the Topical Conference on Hard Diffractive Processes, Eilat, Israel, February 1996.
- [19] E. Barberis, Proceedings of the International Workshop on Deep–Inelastic Scattering and Related Phenomena, Rome, Italy, April 1996.
-
[20]
W. Buchmüller and A. Hebecker, Phys. Lett. B355, 573 (1995),
W. Buchmüller and A. Hebecker, hep-ph/9512329 (1995),
W. Buchmüller, M. F. McDermott, and A. Hebecker, DESY preprint 96-126 (1996). -
[21]
A. Edin, J. Rathsman and G. Ingelman, Phys. Lett. B366, 371 (1996),
A. Edin, J. Rathsman and G. Ingelman, DESY-96-060 (1996). -
[22]
ZEUS Collaboration, M. Derrick et al. , Physics Letters B 356 (1995) 601-616,
H1 Collaboration, S. Aid et al. , Nucl.Phys. B463 (1996) 3. - [23] L. Bauerdick, A. Glazov, M. Klein, proceedings of the workshop “Future Physics at HERA”, DESY, Hamburg, 1996.
-
[24]
G. Ingelman and K. Janson–Prytz,
proceedings of the workshop “Physics at HERA”, p. 233,
October 1991, ed. W. Buchmüller and G. Ingelman,
G. Ingelman and K. Prytz, Zeit. Phys. C58 (1993) 285. - [25] H1 Collaboration, S. Aid et al. , Nucl. Phys. B470 (1996) 3.
- [26] ZEUS Collaboration, M. Derrick et al. , DESY 96-076 (1996).
-
[27]
H. Jung, Comp. Phys. Comm.86 (1995) 147,
H. Jung, RAPGAP 2.2 Program Manual, to appear in Comp. Phys. Comm. - [28] R. M. Barnett et al. (Particle Data Group): Phys. Rev. D54 1 (1996).