Charmonium Suppression in Nuclear Collisions
Measurements of and production from experiment NA50 at the CERN SPS are compared to calculations based on a hadronic model of charmonium suppression developed previously. Data on centrality dependence and total cross sections are in good accord with these predictions. Uncertainties in theoretical quantities such as NA50’s parameter are discussed.
1 Introduction
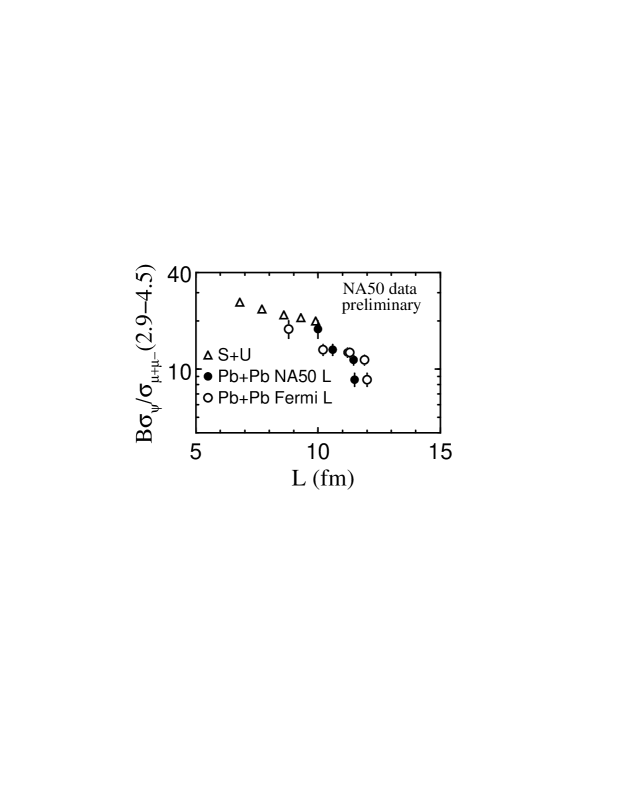
Has the quark gluon plasma been discovered at the CERN SPS? Experiment NA50 has reported an abrupt decrease in production in Pb+Pb collisions at 158 GeV per nucleon [1]. Specifically, the collaboration presented a striking ‘threshold effect’ in the –to–continuum ratio by plotting it as a function of a calculated quantity, the mean path length of the through the nuclear medium, , as shown in fig. 1a. This apparent threshold has sparked considerable excitement as it may signal deconfinement in the heavy Pb+Pb system [2].
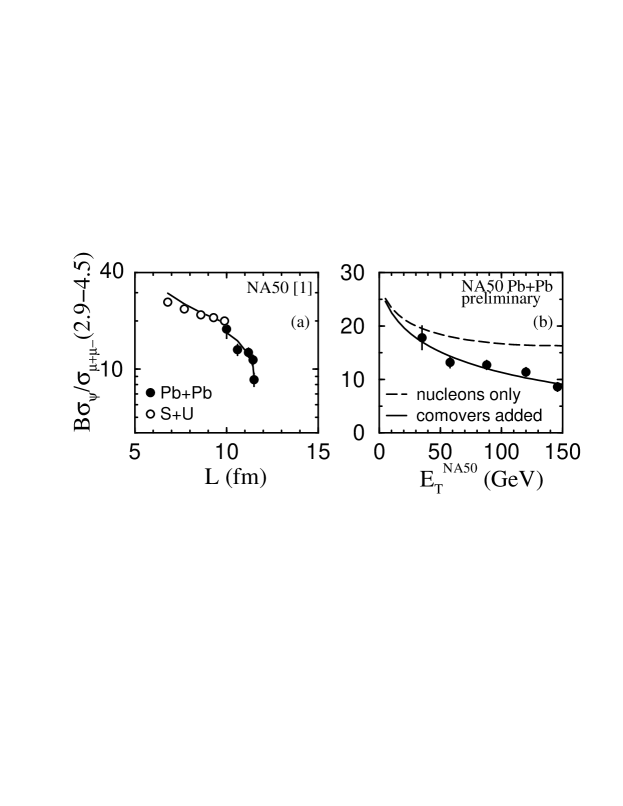
In this talk I report on work with Ramona Vogt in ref. [3] comparing Pb results to predictions [4, 5] using a hadronic model of charmonium suppression. We first demonstrate that the behavior in the NA50 plot, fig. 1a, is not a threshold effect but, rather, reflects the approach to the geometrical limit of as the collisions become increasingly central. When plotted as a function of the measured neutral transverse energy as in fig. 1b, the data varies smoothly as in S+U measurements in fig. 3b below [1, 6, 7, 8, 9]. The difference between S+U and Pb+Pb data lies strictly in the relative magnitude. To assess this magnitude, we compare and data to expectations based on the hadronic comover model [4, 5]. The curves in fig. 1 represent our calculations using parameters fixed earlier in Ref. [5]. Our result is essentially the same as the Pb+Pb prediction in [4].
Our primary intention is to demonstrate that there is no evidence for a strong discontinuity between A, S+U and Pb+Pb data. However, to quote Maurice Goldhaber, “ absence of evidence is not evidence of absence.” Our secondary goal is to show that our model predictions agree with the new Pb+Pb data. The consistency of these predictions is evident from the agreement of our old A and S+U calculations with more recent NA38 and NA51 data. Nevertheless, the significance of this result must be weighted by the fact that all A and AB data are preliminary and at different beam energies.
In this work, we do not attempt to show that our comover interpretation of the data is unambiguous – this is certainly impossible at present.
2 Nucleons and Comovers
The hadronic contribution to charmonium suppression arises from scattering of the nascent with produced particles – the comovers – and nucleons [4, 5]. To determine the suppression from nucleon absorption of the , we calculate the probability that a pair produced at a point in a nucleus survives scattering with nucleons to form a . The standard [5, 10] result is
| (1) |
where is the nuclear density, the impact parameter and the absorption cross section for –nucleon interactions. One can estimate , where is the path length traversed by the pair.
Suppression can also be caused by scattering with mesons that happen to travel along with the pair (see refs. in [4]). The density of such comovers scales roughly as . The corresponding survival probability is
| (2) |
where is the comover density and is the time in the rest frame. We write , where depends on the scattering frequency, the formation time of the comovers and the transverse size of the central region, , cf. eq. (8).
To understand the saturation of the Pb data with in fig. 1a, we apply the schematic approximation of Ref. [10] for the moment to write
| (3) |
where the brackets imply an average over the collision geometry for fixed and . The path length and transverse size depend on the collision geometry. The path length grows with , asymptotically approaching the geometric limit . Explicit calculations show that nucleon absorption begins to saturate for , where is the smaller of the two nuclei, see fig. 4 below. On the other hand, continues to grow for due, e.g., to fluctuations in the number of collisions. Equation (2) falls exponentially in this regime because , like , saturates.
In fig. 1b, we compare the Pb data to calculations of the –to–continuum ratio that incorporate nucleon and comover scattering. The contribution due to nucleon absorption indeed levels off for small values of , as expected from eq. (3). Comover scattering accounts for the remaining suppression.
These results are predictions obtained using the computer code of Ref. [4] with parameters determined in Ref. [5]. However, to confront the present NA50 analysis [1], we account for changes in the experimental coverege as follows:
-
•
Calculate the continuum dimuon yield in the new mass range GeV.
-
•
Adjust the scale to the pseudorapidity acceptance of the NA50 calorimeter, .
The agreement in fig. 1 depends on these updates.
3 Suppression
We now review the details of our calculations, highlighting the adjustments as we go. For collisions at a fixed , the –production cross section is
| (4) |
where is the product of the survival probabilities in the projectile , target and comover matter. The continuum cross section is
| (5) |
The magnitude of (4,5) and their ratio are fixed by the elementary cross sections and . We calculate using the phenomenologically–successful color evaporation model [11]. The continuum in the mass range used by NA50, GeV, is described by the Drell–Yan process. To confront NA50 and NA38 data in the appropriate kinematic regime, we compute these cross sections at leading order following [11, 12] using GRV LO parton distributions with a charm –factor and a color evaporation coefficient and a Drell–Yan –factor . Observe that these choices were fixed by fitting data at all available energies [11]. Computing for GeV corresponds to the first update.
To obtain dependent cross sections from eqs. (4) and (5), we write
| (6) |
The probability that a collision at impact parameter produces transverse energy is related to the minimum–bias distribution by
| (7) |
We parametrize , where , , and is the number of participants (see, e.g., Ref. [4]). We take and to be phenomenological calorimeter–dependent constants.
We compare the minimum bias distributions for total hadronic calculated using eq. (7) for GeV and to NA35 S+S and NA49 Pb+Pb data [13]. The agreement in fig. 2a builds our confidence that eq. (7) applies to the heavy Pb+Pb system.
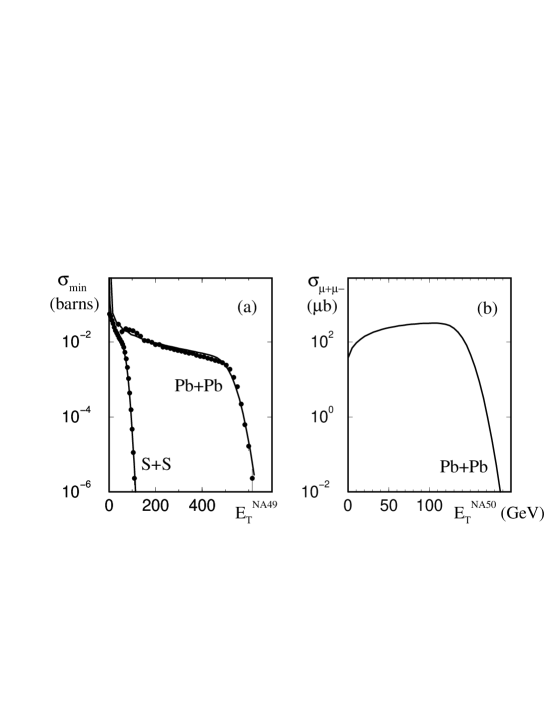
Figure 2b shows the distribution of neutral transverse energy calculated using eqs. (5) and (6) to simulate the NA50 dimuon trigger. We take GeV, , and pb as appropriate for the dimuon–mass range GeV. The distribution for S+U from NA38 was described [5] using GeV and – the change in corresponds roughly to the shift in particle production when the pseudorapidity coverage is changed from (NA38) to (NA50). Taking GeV for the NA50 acceptance is the second update listed earlier. We now apply eqs. (1,2,4) and (5) to charmonium suppression in Pb+Pb collisions. To determine nucleon absorption, we used A data to fix mb in Ref. [5]. This choice is in accord with the latest NA38 and NA51 data, see fig. 3a. To specify comover scattering [5], we assumed that the dominant contribution to dissociation comes from exothermic hadronic reactions such as . We further took the comovers to evolve from a formation time fm to a freezeout time following Bjorken scaling, where is roughly the average relative velocity. The survival probability, eq. (2), is then
| (8) |
where , and is the initial density of sufficiently massive and mesons. To account for the variation of density with , we take [4]. A value fm-3 was chosen to fit the central S+U datum. Since we fix the density in central collisions, this simple ansatz for may be inaccurate for peripheral collisions. [Densities fm-3 typically arise in hadronic models of ion collisions, e.g., refs. [15]. The internal consistency of hadronic models at such densities demands further study.]
We expect the comover contribution to the suppression to increase in Pb+Pb relative to S+U for central collisions because both the initial density and lifetime of the system can increase. To be conservative, we assumed that Pb and S beams achieve the same mean initial density. Even so, the lifetime of the system essentially doubles in Pb+Pb because increases to 6.6 fm from 3.6 fm in S+U. The increase in the comover contribution evident in comparing figs. 1b and 3b is described by the seemingly innocuous logarithm in eq. (8), which increases by in the larger Pb system.
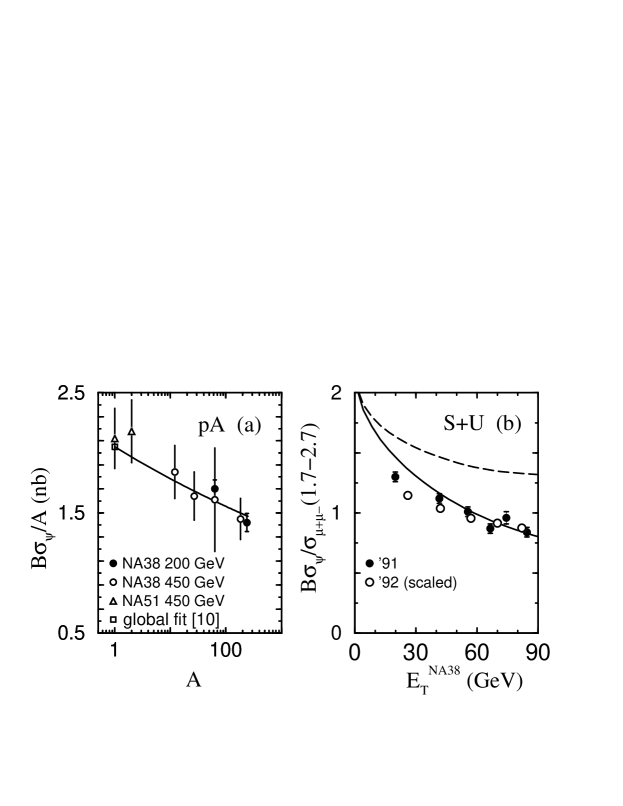
In Ref. [5], we pointed out that comovers were necessary to explain S+U data from the NA38 1991 run [6]. Data just released [1] from their 1992 run support this conclusion. The ’91 data were presented as a ratio to the dimuon continuum in the low mass range GeV, where charm decays are an important source of dileptons. On the other hand, the ’92 data [1, 9] are given as ratios to the Drell–Yan cross section in the range GeV. That cross section is extracted from the continuum by fixing the –factor in the high mass region [14]. To compare our result from Ref. [5] to these data, we scale the ’92 data by an empirical factor. This factor is larger than our calculated factor ; these values agree within the NA38 systematic errors. [NA50 similarly scaled the ’92 data to the high–mass continuum to produce fig. 1a.] Because our fit is driven by the highest datum, we see from fig. 3b that a fit to the ’92 data would not appreciably change our result. Note that a uniform decrease of the ratio would increase the comover contribution needed to explain S+U collisions.
NA50 and NA38 have also measured the total –production cross section in Pb+Pb [1] and S+U reactions [7]. To compare to that data, we integrate eqs. (4, 6) to obtain the total nb in S+U at 200 GeV and 0.54 nb for Pb+Pb at 158 GeV in the NA50 spectrometer acceptance, and (to correct to the full angular range and , multiply these cross sections by ). The experimental results in this range are nb for S+U collisions [6] and nb for Pb+Pb reactions [1]. Interestingly, in the Pb system we find a Drell–Yan cross section pb while NA50 finds pb. Both the and Drell–Yan cross sections in Pb+Pb collisions are somewhat above the data, suggesting that the calculated rates at the level may be too large at 158 GeV. This discrepancy is within ambiguities in current data near that low energy [11]. Moreover, nuclear effects on the parton densities omitted in eqs. (4,5) can affect the total S and Pb cross sections at this level.
We remark that if one were to neglect comovers and take mb, one would find nb in S+U at 200 GeV and 0.62 nb for Pb+Pb at 158 GeV. The agreement with S+U data is possible because comovers only contribute to the total cross section at the level in the light system. This is expected, since the impact–parameter integrated cross section is dominated by large and the distinction between central and peripheral interactions is more striking for the asymmetric S+U system. As in Ref. [5], the need for comovers is evident for the –dependent ratios, where central collisions are singled out.
4 Saturation and the Definition of
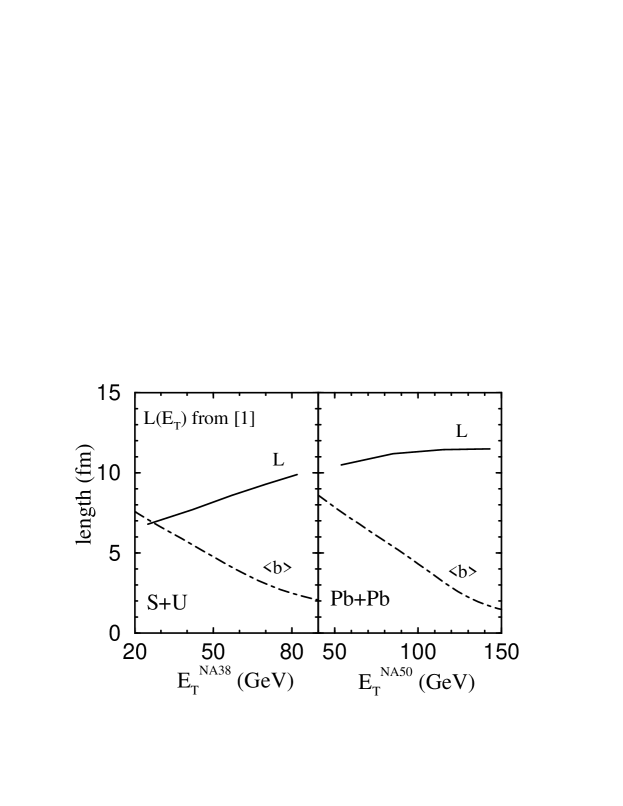
To see why saturation occurs in Pb+Pb collisions but not in S+U, we compare the NA50 [1] to the average impact parameter in fig. 4. To best understand fig. 1a, we show the values of computed by NA50 for this figure. We use our model to compute , where and . [Note that NA50 reports similar values of [1].] In the range covered by the S experiments, we see that is near fm or larger. In this range, increasing dramatically reduces the collision volume and, consequently, . In contrast, in Pb+Pb collisions 6.6 fm for all but the lowest bin, so that does not vary appreciably.
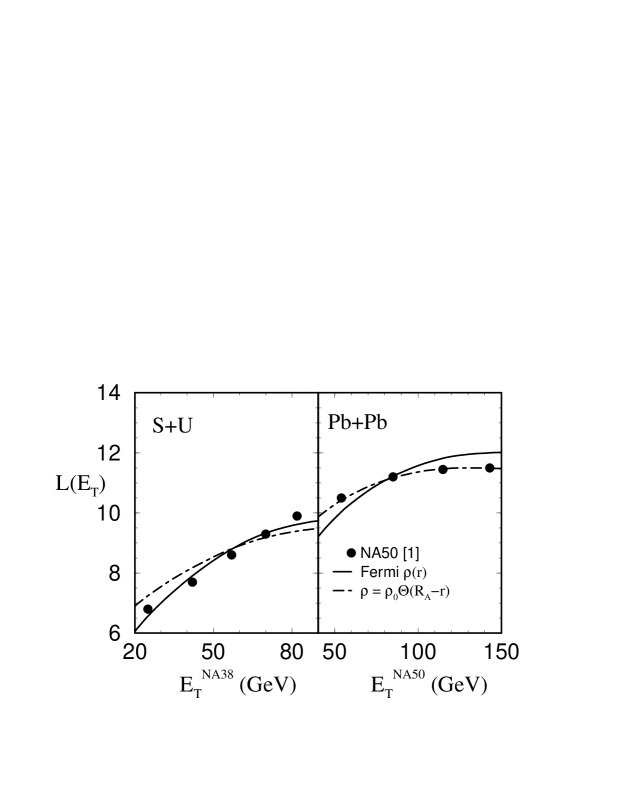
To understand the sensitivity of fig. 1a to the definition of the path length, we now estimate [16]. We identify (3) with the exact expression formed from the ratio of (4) and (5). Expanding in and neglecting comovers, we find:
| (9) |
where . In fig. 5 we compare the NA50 to the path length calculated using two assumptions for the nuclear density profile: our realistic three–parameter Fermi distribution and the sharp–surface approximation . NA38 [17] obtained for S+U using the empirical prescription of ref. [10], while NA50 calculated assuming the sharp-surface approximation [18]. Indeed, we see that the NA50 Pb+Pb values agree with our sharp–surface result, while the NA38 S+U values are nearer to the realistic distribution.
To see how the value of the path length can affect the appearance of fig. 1a, we replot in fig. 6 the NA50 data using from (9) with the realistic density. We learn that the appearance of fig. 1a is very sensitive to the definition of . Furthermore, with a realistic , one no longer gets the impression given by the NA50 figure [1] of Pb+Pb data “departing from a universal curve.” Nevertheless, the saturation phenomena evident in fig. 1a does not vanish. Saturation is a real effect of geometry.
5 Suppression
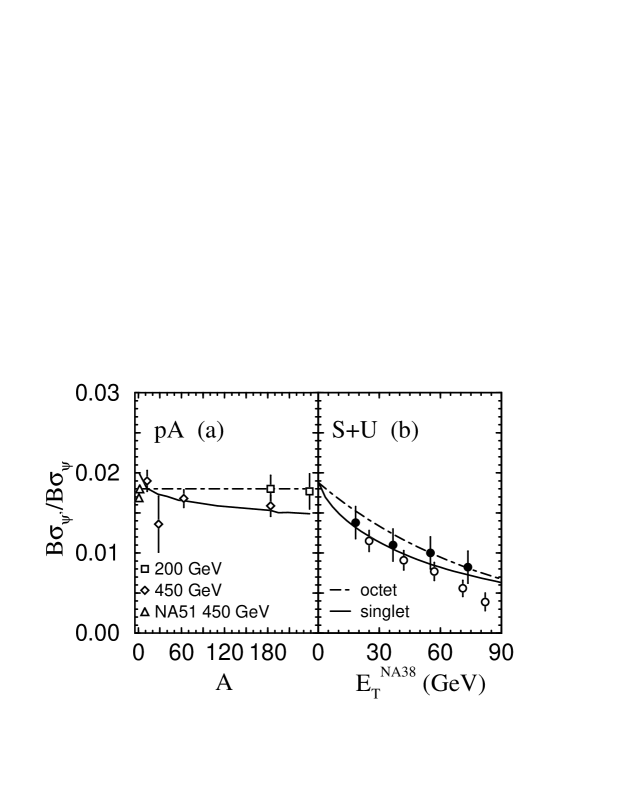

To apply eqs. (4-6) to calculate the –to– ratio as a function of , we must specify , , and . Following Ref. [11], we use data to fix (this determines ). The value of depends on whether the nascent is a color singlet hadron or color octet as it traverses the nucleus. In the singlet case, one expects the absorption cross sections to scale with the square of the charmonium radius. Taking this ansatz and assuming that the forms directly while radiative decays account for 40% of production, one expects for interactions with either nucleons or comovers [5]. For the octet case, we take and fix mb to fit the S+U data. In fig. 7a, we show that the singlet and octet extrapolations describe A data equally well.
Our predictions for Pb+Pb collisions are shown in fig. 8. In the octet model, the entire suppression of the –to– ratio is due to comover interactions. In view of the schematic nature of our approximation to in eq. (8), we regard the agreement with data of singlet and octet extrapolations as equivalent.
6 Summary
In summary, the Pb data [1] cannot be described by nucleon absorption alone. This is seen in the NA50 plot, fig. 1a, and confirmed by our results. The saturation with but not suggests an additional density–dependent suppression mechanism. Earlier studies pointed out that additional suppression was already needed to describe the S+U results [5]; recent data [1] support that conclusion (see, however, [2]). Comover scattering explains the additional suppression. Nevertheless, it is unlikely that this explanation is unique. SPS inverse–kinematics experiments () and AGS A studies near the threshold can help pin down model uncertainties.
After the completion of [3], several cascade calculations [15] have essentially confirmed our conclusions. This confirmation is important, because such calculations do not employ the simplifications (e.g. ) needed to derive (8). In particular, these models calculate and the comover density consistently. Some of these authors took mb (instead of mb) to fit the NA51 data in fig. 3a somewhat better.
I am grateful to Ramona Vogt for her collaboration in this work. I also thank C. Gerschel and M. Gonin for discussions of the NA50 data, and M. Gyulassy, R. Pisarski and M. Tytgat for insightful comments.
References
References
- [1] M. Gonin et al. (NA50), Proc. Quark Matter ’96, Heidelberg, Germany, P. Braun-Munzinger et al., eds. (1996).
- [2] J.-P. Blaizot and J.-Y. Ollitrault, Phys. Rev. Lett. 77 (1996) 1703; D. Kharzeev, hep-ph/9609260 (1996).
- [3] S. Gavin and R. Vogt, LBL-37980 (1996), hep-ph/9606460.
- [4] S. Gavin and R. Vogt, Nucl. Phys. B345 (1990) 104.
- [5] S. Gavin, H. Satz, R. L. Thews, and R. Vogt, Z. Phys. C61 (1994) 351; S. Gavin, Nucl. Phys. A566 (1994) 383c.
- [6] O. Drapier et al. (NA38) Nucl. Phys. A544 (1992) 209c.
- [7] C. Baglin et al. (NA38) Phys. Lett. B270 (1991) 105.
- [8] C. Baglin et al. (NA38) Phys. Lett. B345 (1995) 617; S. Ramos et al. Nucl. Phys. A590 (1995) 117c.
- [9] C. Lourenco (NA38/NA50), Europhysics Conf. on High Energy Physics - EPS-HEP, Brussels (1995).
- [10] C. Gerschel and J. Hüfner, Z. Phys. C56 (1992) 171.
- [11] R. Gavai et al., Int. J. Mod. Phys. A10 (1995) 3043.
- [12] S. Gavin et al., Int. J. Mod. Phys. A10 (1995) 2961.
- [13] S. Margetis et al. (NA49), Phys. Rev. Lett. 75 (1995) 3814.
- [14] M. C. Abreu et al., Nucl. Phys. A566 (1994) 77c.
- [15] W. Cassing and C. M. Ko, nucl-th/9609025 (1996); D. Kahana, S. H. Kahana and Y. Pang, in progress; L. Gerland et al., in progress.
- [16] S. Gavin and R. Vogt, in progress.
- [17] A. Borhani, NA38, Ph. D. Thesis, l’Ecole Polytechnique (1996).
- [18] C. Gerschel, NA50, private communications.