Recent Lattice Results on the Light Quark Masses
Abstract
I discuss old and new determinations of the light quark masses using lattice QCD. Most lattice results using various approximations can be fit together in a simple picture which is consistent with lower values than conventionally supposed: in the quenched approximation for the strange quark mass in the scheme, , and for the average of the and quark masses, An estimate of the effects of light quark loops yields answers lower still: in the range 54 - 92 MeV, and in the range 2.1 - 3.5 MeV.
1 Introduction
Among the most important applications of lattice QCD are the determinations of the fundamental parameters of the standard model in the quark sector. Of these, one of the most important is the overall scale of the light quark masses. It is one of the most poorly known of the parameters of the standard model from prelattice methods. The Particle Data Group estimates a range of a factor of three in allowed values [1]:
| (1) | |||||
| (2) | |||||
| (3) |
(I will use to represent the running quark mass in the scheme.) Global fits to standard model parameters are very sensitive to such large variations. It is also one for which lattice methods provide the only systematically improvable determination. This can be contrasted with the strong coupling constant , for example, for which it is possible to imagine going to higher and higher energy scattering experiments and extracting with perturbation theory. Lattice quark mass extractions are harder to do with solid error analysis than extractions, but they may be more important in the long run.
2 Prelattice Quark Mass Results
2.1 Quark mass ratios
The ratios of light quark masses can be investigated with some degree of reliability using chiral perturbation theory (PT), which becomes asymptotically exact in the zero quark mass, zero energy limit of QCD [2]. One combination of the light quark mass ratios is especially likely to be reliable, since it has been constructed to have vanishing leading order corrections in PT:
| (4) |
The other combination of quark mass ratios may be obtained at leading order in chiral perturbation theory from the canonical prediction of PT, that the meson mass squared is proportional to the quark mass:
| (5) |
The usefulness of this relation has been called into question by the discovery of a symmetry of the chiral Lagrangian which leaves physical predictions invariant under simultaneous transformations of the interactions, and of the quark masses [3]:
| (6) | |||||
| (7) |
and cyclic in u,d,s. The effects on the pseudoscalar spectrum of a nonzero quark mass can be mimicked exactly by higher order interactions in the PT Lagrangian and altered and quark masses.
2.2 Absolute value of the quark masses
Chiral perturbation theory makes no statement about the third combination of light quark masses, the overall scale. A large range of results has been obtained with a variety of methods. See, for example, a compilation of results for from Ref. [1] shown in Table 1. The most reliable of these prelattice results are perhaps those using QCD sum rules, but even here, the systematic errors of the method are hard to pin down. It is here that there is the largest spread in existing results and that lattice methods probably have the most important role to play.
| (MeV) | method |
|---|---|
| 194 (4) | quark model |
| 118 | sum rules |
| 175 (55) | sum rules |
| sum rules | |
| 112 (66) | PT + estimate of |
| 378 (220) | PT + estimate of |
| 150 | strange baryon splittings |
| 135 | SU(6) |
3 Lattice Quark Mass Determinations
Lattice determinations of standard model parameters require: 1) fixing the bare lattice parameters from physics, and 2) obtaining the parameters from these with short-distance matching calculations. Spin averaged splittings in the and systems are convenient quantities to set the lattice spacing [5]. The mesons are small and easy to understand because the quarks are nonrelativistic. Light pseudoscalar meson masses are the most convenient quantities to fix the light quark masses. Chiral symmetry makes them very sensitive to the quark masses, the mesons are small, the correlators have good statistics and are easy to fit over long time separations. The correlators have simple behavior as the quark mass is varied toward zero, in contrast with unstable vector mesons. Other quantities must give the same results as the approximations are removed.
The second piece is the determination of the parameters of the Lagrangian by matching perturbative, dimensionally regularized short distance amplitudes to their lattice counterparts. It is desirable to do the lattice part of such calculations nonperturbatively as much as possible, to test for the presence of nonperturbative short-distance effects and possible poor convergence of perturbation theory. Such nonperturbative short-distance calculations are harder to design for quark masses than for the strong coupling constant. Such nonperturbative short distance analysis of quark mass extractions is currently less advanced than the analogous investigations for the strong coupling constant .
The perturbative expression giving the mass from the lattice bare mass may be written
| (10) |
The mean-field-improved bare mass is given by in perturbation theory, and nonperturbatively, if the expectation value of the plaquette, , is used to define mean field improvement[6]. is the leading quark mass anomalous dimension. This coefficients in this expression are well behaved for the Wilson action and the improved action of Sheikholeslami and Wohlert (SW) [7] (for which [8] and 4.72 [9] respectively). For staggered fermions, is 132.9 [8], leading to renormalization factors of 50–100% which are not explained by large tadpole graphs.
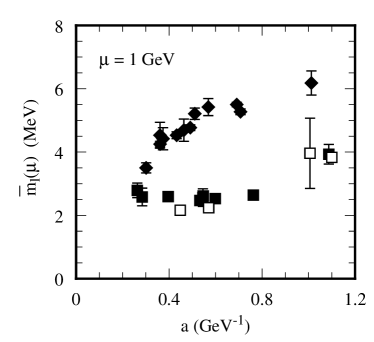
The status of quark mass extractions as of a few years ago was reviewed in Refs. [10, 11]. Some data tabulated in Ref. [10] are shown in Fig. 1. Unimproved perturbation theory was used, and the lattice spacing was determined with the mass. The quenched results for staggered fermions (dark squares) are relatively independent of the lattice spacing, but Eq. 10 is untrustworthy because of the very large quantum correction. The quenched Wilson results (diamonds) have much better controlled perturbation theory, but are much more lattice spacing dependent. If the results are extrapolated in , they approach the staggered results more closely. However, the magnitude and origin of remaining lattice spacing errors is then unknown. Improved actions must be used to investigate this.
4 Recent Quenched Lattice Results
4.1 Unimproved Wilson fermion results.
New unimproved results have been presented in the JLQCD contribution to this volume by T. Yoshié [12]. They include a data point at , corresponding to a smaller lattice spacing () than previous results. Fig. 2 shows their Wilson fermion results superimposed on a subset of the world data. has been used to set the lattice spacing. Improved perturbative theory has been used in the renormalizations, which makes the Wilson results slightly higher than in the older analyses, and the staggered results much higher, about 50%. The new JLQCD Wilson results are statistically consistent with previous results, and so can be combined with them for a consistent extrapolation of the leading error. Taken by themselves, however, they appear to have a somewhat smaller dependence then other results.
Wilson data were also presented by Fermilab (upper points in Fig. 3) [13, 14]. These points also lie slightly below and have a smaller slope than most of the world data in Fig. 2. This is due to the fact that the Fermilab data use the spin averaged 1P–1S splitting in the system to determine the lattice spacing, which is expected to have a small error. Determining with the mass is equivalent to calculating . Since the correction operator is expected to push spin partners like the and the apart, errors in both masses contribute to the dependence. When the 1P–1S splitting is substituted for the , the slope ought to be reduced, as observed. If mass lattice spacings are substituted into the Fermilab data, the results line up with the upper points in Fig. 2.

Gupta and Bhattacharya have performed a linear extrapolation on the world Wilson data and obtain MeV [15]. They use slightly different analysis methods from those of Ref. [12], and obtain a result below that which would be obtained from Fig. 2, which is about 3.8 MeV. However, the authors say that their error estimate is a “guess chosen to reflect the various uncertainties discussed …and is not based on systematic analysis”.
JLQCD also presented new results for staggered fermions which left the existing situation unchanged. The results are almost lattice independent for , but it is difficult to estimate perturbative uncertainties since the perturbative renormalization factor is so large. (At , they use , a 69% correction of which most is unexplained by mean field improvement.)
4.2 Improved quenched Wilson fermion results
To investigate the size of the remaining cut–off errors in the Wilson action (, , , etc.), it is necessary to remove the leading error with an improved action. In the SW action, the leading error is removed with the addition of the operator . There are several gauge links in the operator, so tadpole improvement predicts a rather large correction, of order 50%.
New results with the tadpole improved SW action were presented by Fermilab [13]. The lattice spacing dependence observed in the Wilson points is substantially reduced, but not completely eliminated. If this arises from a residual error, the results extrapolate down to rather near the staggered results. (A recent nonperturbative determination of the coefficient of the SW improvement operator has indicated the possibility of even larger corrections than the sizable ones indicated by perturbation theory and mean field improvement [16].) If it arises from higher order effects in , the answer is close to the existing small lattice spacing points, and the discrepancy with staggered results must be attributed to poorly behaved staggered perturbation theory.

Since a downward trend in is still present in the tadpole improved data, we take the improved result at the finest lattice spacing as an upper bound in the quenched approximation and a linear extrapolation as a lower bound. Adding perturbative uncertainties linearly and other uncertainties in quadrature gives the quenched result:
| (11) | |||||
| (12) |
Another determination of the strange quark mass with an improved action has been reported, in Ref. [17]. This determination used a tree-level, rather than a mean-field improved coefficient for the improvement operator. They obtained MeV. They did not attempt to correct for the effects of the remaining lattice spacing dependence or the effects of the quenched approximation. Much of the discrepancy with the Fermilab results arises from fact that we have used much larger SW improvement coefficients, and make an allowance for the fact that we continue to find significant cut-off dependence even so.
5 Corrections to Quark Mass Ratios
5.1 Nonlinearities in vs.

There is very little lattice evidence for large deviations from linearity in the quark masses in Eq. (5) in either quenched or unquenched calculations. In the most accurate data, the question often seems to be why the predictions of chiral symmetry appear linear at the few % level up to such large values of the quark masses. (See Fig. 4. The largest pion mass is around 850 MeV, and nonlinearity in vs. is only a few %.) However, searching for such deviations is tricky, especially in the quenched approximation where quenched chiral logarithms may add spurious nonlinearities at small [19]. Existing unquenched calculations have not yet examined carefully the case of broken flavor SU(3), , so not all of the higher order operators of the chiral Lagrangian have yet been tested.
5.2 Electromagnetic effects
It is in principle simple to determine the contributions of electromagnetism to hadron masses using numerical simulations with link matrices which are products of SU(3) and U(1) matrices. The U(1) phases of electromagnetism are cheap to generate because to leading order in (all that is required for practical purposes), they can be obtained from Fourier transforms of Gaussian fluctuations in momentum space. To see the effects of electromagnetism clearly above fluctuations in the SU(3) field, one wants to use values of which are larger than the physical value. It then remains only to show that electromagnetic effects are still linear in this region. That this indeed holds has been shown recently by Duncan, Eichten, and Thacker [20]. They have performed a prototype calculation of the splitting at and with it have obtained , in agreement (so far) with Eq. 9.
5.3 Can ?
The most interesting application of these calculations is the settling of the question of whether in the real world. This possibility is fervently desired in spite of all evidence to the contrary because of its neat solution to the strong CP problem. Ref. [3] showed that allowing corrections as large as 30% to PT equations such as 5 made compatible with meson mass data. (See Fig. 4, however.) The possibility of large instanton-induced flavor mixing effects has been proposed as a mechanism to generate such corrections in QCD [21]. Not all the required lattice calculations have been done, but so far, the lattice evidence is against .
6 The Quenched Approximation
As the lattice spacing is reduced, while keeping hadronic physics fixed, the lattice bare couplings evolve according to their anomalous dimensions. In the quenched approximation, these anomalous dimensions are slightly wrong, due to the absence of light quark loops. The strong coupling constant evolves according to the zero-quark function coefficient rather than the correct three-quark coefficient . Asymptotically, in the quenched approximation is expected to be too small by a factor of about 9/11.
Since the short-distance quark mass evolution is given by , where , this implies that the quark mass evolves too slowly in the quenched approximation, and at small lattice spacings is larger than in real life. At high energies, running mass evolution is given by
| (13) |
To leading log accuracy, therefore, the effect of the absence of quark loops due to perturbative effects on the evolution of the running mass from the strong coupling region (where ) to the high energy region can be approximated by [22]
| (14) | |||||
| (15) |
for to 1/8.
There are also quenching effects arising from the nonperturbative region. Unlike the case of quarkonium systems, for pions there is no argument that these should be smaller than the perturbative effects. The above expression can’t be taken as a correction factor, only as an indication of the direction and order of magnitude of effects to be expected. Nonperturbative calculations are required to investigate quenching effects quantitatively.
Unquenched results for Wilson fermions appear complicated and hard to interpret. They differ by as much as a factor of two from quenched results, and do not seem to reproduce the lattice spacing dependence of the quenched results as would have been expected (see Ref. [10]). Since most other unquenched Wilson results, such as those in thermodynamics, are also hard to understand compared to staggered results, I will not attempt to fit unquenched Wilson fermion results into my general picture.
Some unquenched staggered results summarized in Ref. [10] are shown in Fig. 1 (white squares) along with the quenched results. The unquenched results indeed lie below the quenched results by roughly the expected amount, and I will use them to estimate the effects of quenching. The large corrections in staggered fermion mass renormalization cancel out in the ratio of the quenched and unquenched determinations, making this an useful quantity to examine. To minimize effects due to differences in analysis methods, we estimate the ratio from the results of a single group, at similar volumes and lattice spacings (about 0.4 GeV-1) [23, 24], and obtain
| (16) | |||||
| (17) |
Since there are, in fact, three flavors of light quarks in the world and not two, I will this ratio as a lower bound on the actual ratio and use the square (corresponding to four light quarks) as an upper bound.
7 Synthesis
Lattice determinations of light quark masses are more difficult than the analogous determinations of . Pion masses have worse dependence than the quarkonium splittings. Finding nonperturbative ways of eliminating the perturbative relations with the bare lattice quark mass requires more work.
Nevertheless, with a few exceptions, most lattice quark mass extractions are consistent with a reasonably simple picture. I ignore results with very large or very small volume. Unquenched Wilson results, which are also hard to interpret in most other quantities, do not seem to make sense compared with quenched Wilson results. Of the remaining results, the larger magnitude and lattice spacing dependence of Wilson results compared with staggered results is greatly reduced with improved actions. The magnitudes are reduced more with tadpole improved SW correction terms than with tree–level correction terms. If the remaining discrepancy arises mainly from residual effects in the improved action, the true quenched answer lies close to the staggered result, a little over 3 MeV. If it arises mainly from higher order corrections in the staggered fermion lattice– mass conversion (where the leading correction is 50–100%), the true answer lies closer to the improved result, MeV.
Unquenched staggered results lie somewhat below quenched staggered results, but by an amount which is reasonable. Taking the ratio from Sec. 6 and using it to make a correction on our quenched result we obtain
-
•
in the range 54 – 92 MeV,
-
•
in the range 2.1 – 3.5 MeV,
for the masses renormalized at 2 GeV. The uncertainties most in need of further study are those associated with lattice spacing dependence and the quenched approximation.
Acknowledgments
I thank Brian Gough, Aida El-Khadra, George Hockney, Andreas Kronfeld, Bart Mertens, Tetsuya Onogi, and Jim Simone for collaboration on the work of Ref. [13, 14]. I thank the Center for Computational Physics in Tsukuba for hospitality while this paper was written, and I thank the members of the JLQCD collaboration for useful discussions. Fermilab is operated by Universities Research Association, Inc. under contract with the U.S. Department of Energy.
References
- [1] Review of Particle Properties, R.M. Barnett et al., Phys. Rev. D54 (1996) 1.
- [2] H. Leutwyler Nucl. Phys. B337 (1990) 108, and references therein.
- [3] D. B. Kaplan and A. V. Manohar Phys. Rev. Lett. 56 (1986) 2004.
- [4] H. Leutwyler, Phys. Lett. B378 (1996) 313.
- [5] A. X. El-Khadra, G. Hockney, A. S. Kronfeld, and P. B. Mackenzie, Phys. Rev. Lett. 69 (1992) 729.
- [6] G. P. Lepage and P. B. Mackenzie, Phys. Rev. D48 (1993) 2250.
- [7] B. Sheikholeslami and R. Wohlert, Nucl. Phys. B259 (1985) 572.
- [8] R. Groot, J. Hoek, and J. Smit, Nuc. Phys. B237 (1984) 111; and references therein.
- [9] E. Gabrielli, G. Martinelli, C. Pittori, G. Heatlie, C.T. Sachrajda, Nucl. Phys. B362 (1991) 475.
- [10] A. Ukawa, Nucl. Phys. B Proc. Suppl.30 (1993) 3.
- [11] R. Gupta, Nucl. Phys. B Proc. Suppl.42 (1995) 85.
- [12] JLQCD Collaboration (presented by T. Yoshié), these proceedings.
- [13] T. Onogi, in these proceedings.
- [14] B. Gough, A. X. El-Khadra, G. Hockney, A. S. Kronfeld, P. B. Mackenzie, B. Mertens, T. Onogi, and J. Simone, Fermilab preprint Pub-96/283-T.
- [15] R. Gupta and T. Bhattacharya, LA-UR-96-1840 (1996) [HEP-LAT 9605039].
- [16] K. Jansen, C. Liu, M. Lüscher, H. Simma, S. Sint, R. Sommer, P. Weisz, and U. Wolff, Phys. Lett. B372 (1996) 275.
- [17] C.R. Allton et al., Nucl. Phys. B431 (1994) 667.
- [18] The JLQCD collaboration, S. Aoki, private communication.
- [19] See, for example, the review by S. Sharpe in these proceedings.
- [20] A. Duncan, E. Eichten, and H. Thacker, Phys. Rev. Lett. 76 (1996) 3894.
- [21] H. Georgi and I. N. McArthur, Harvard University Report HUTP-81/A011 (1981).
- [22] P. B. Mackenzie, Nuc. Phys. B, Proc. Suppl. 34 (1994) 400.
- [23] N. Ishizuka, M. Fukugita, H. Mino, M. Okawa, A. Ukawa, Nucl. Phys. Proc. Suppl. 26 (1992) 284.
- [24] M Fukugita et al., Phys. Rev. Lett. 68 (1992) 761.