INSTITUT FÜR KERNPHYSIK, UNIVERSITÄT FRANKFURT
D-60486 Frankfurt, August–Euler–Strasse 6, Germany
IKF–HENPG/4–96
Strangeness Enhancement in Sulphur-Nucleus Collisions at 200 GeV/N
Jürgen Eschke
Gesellschaft für Schwerionenforschung, Darmstadt, Germany
E–mail address: J.Eschke@gsi.de
Talk given at STRANGENESS’96, Budapest, Hungary, May 15–17 1996
to be published in the special issue of Heavy Ion Physics
APH N.S., Heavy Ion Physics Vol. n (1996) p1-plast
HEAVY ION
PHYSICS
©Akadémiai
Kiadó
Strangeness Enhancement in
Sulphur-Nucleus
Collisions at 200 GeV/N
J. Eschke1 and the NA35 Collaboration
1 GSI Darmstadt,
Planckstr. 1, 64291 Darmstadt, Germany,
E-mail: J.Eschke@gsi.de
Received nn Month Year (to be given by the editors)
Abstract.
The NA35 experiment used several independent methods to determine the strange
particle production in p+S and S+A collisions.
The different techniques show consistent results.
Strangeness conservation in full phase space is used as an additional check of the consistency
of the data.
On the base of the analysis in full phase space
it could be shown that strangeness conservation is fullfilled.
The NA35 K in S+S and S+Ag are consistent with the NA44 results for K+ and K-.
The results of the NA36 collaboration for S+Pb collisions were extrapolated to full phase space.
The comparison with the NA35 results shows more than two times lower yields.
The ratio of to at midrapidity of NA36 is inconsistent
with the high baryon density determind by NA35.
The strange particle production is compared to the abundance of
non strange particles, especially negatively charged pions which are measured
in full phase space in the same experiment.
A clear enhanced strange hadron production relative to is observed
in S+Ag collisions compared to p+S reactions at the same energy.
The K multiplicity in full phase space per negative hadron (h-)
in S+S, S+Ag and Pb+Pb is enhanced by about a factor 1.6 compared to N+N and p+S collisions.
The NA36 result for the K multiplicity per h- in S+Pb is below the N+N value.
1. Introduction
The enhanced production of strange hadrons in nucleus-nucleus collisions at
ultrarelativistic energies was predicted to be a signal of the formation
of a QGP [1].
The experiment NA35 performed a systematic study of the production of
, , K, K+ and K- in
p+A and S+A reactions at 200 GeV per nucleon [2].
Charged particles over a wide rapidity range are recorded
by a streamer chamber and a time projection chamber.
Different experimental setups and analysis technique for
the measurement of strange hadrons were used to determine
strange particle yields in
various systems and in different phase space regions.
0231-4428/95/ $ 5.00
©1996 Akadémiai Kiadó, Budapest
2. Experimental procedure
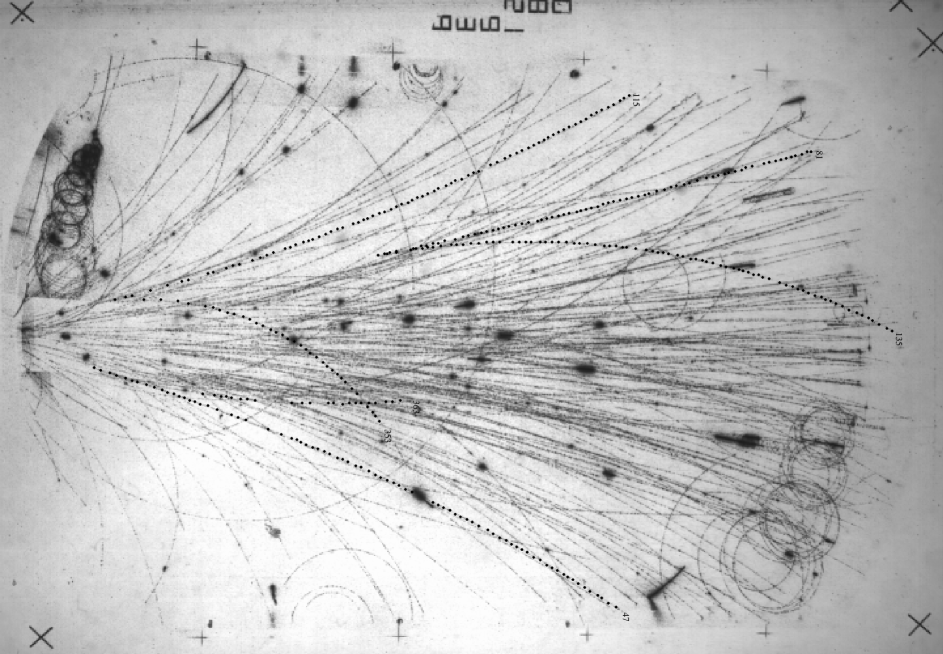
The schematic set–up of the experiment NA35 is shown in Fig. 1. The charged particles are detected in a large volume tracking chamber, the Streamer Chamber placed inside a 1.5 Tesla dipole magnet (VTM). The data were collected in two different target – Streamer Chamber configurations. In the ’standard’ configuration the nuclear targets were placed about 10 cm upstream of the entry window of the Streamer Chamber. fig. 1 also shows a streamer chamber picture of a central S+Ag collision. The rapidity–transverse momentum (–) acceptance of this configuration covers the –region below midrapidity () and GeV/c for and and GeV/c for charged kaons. In the ’sweeper’ configuration an additional 1.8 Tesla sweeper magnet (SM) was installed in front of the VTM magnet, and the target was placed 361 cm upstream of the Streamer Chamber. These modifications lead to track densities low enough for an efficient analysis in the entire volume of the chamber. The acceptance for neutral strange particles in this configuration is limited to the forward rapidity region (y3) [2].
2.1. Analysis techniques
The strange particles were detected by reconstructing their charged decay vertices: , , , and . Two procedures were used leading to different event samples:
-
•
a ’visual’ method in which a human operator detected and measured the tracks associated with a strange particle decay [3] and
-
•
an ’automatic’ method in which digitized Streamer Chamber images were analyzed by a special software tracking chain [4].
In the ’visual’ method of strange particle analysis the visibility of the decay vertex was required. In the ’computerized’ method of the , and analysis the decay point was reconstructed using combinations of all positive and negative tracks measured in the same event. In order to reduce the combinatorial background produced by tracks originating from the interaction vertex it was necessary to apply cuts on the distance of the point of closest approach of the track to the interaction vertex and on the distance between the decay and interaction vertices. The resulting invariant mass distributions of the two decay products for central 32S+Ag collisions are plotted in Fig. 2 for the , and decay hypothesis. The combinatorial background is reduced by these pure geometrical cuts below the 10% level.
For further background reduction the candidates for strange particle decays were fitted using the least–squares method and tested against the , and decay hypotheses using Pearson’s test. The cuts on the of the kinematical fit and on the angle between the momenta of the decay product and the strange particle (measured in the decay c.m. system) lead to a suppression of the background to less than 3%. Corrections evaluated by a Monte Carlo simulation of the real data were used to obtain the final results. The – acceptances obtained for the ’automatic’ method are wider than the acceptances for the ’visual’ procedure.
3. Experimental results
The rapidity distributions of , and from the ’visual’ and ’automatic’ methods are compared in Fig. 3. The figures show the comparison of the ’visual’ and ’automatic’ analysis method for S+Ag collisions in the target hemisphere (y3) and the results of the ’visual’ analysis for S+Au reactions in the projectile hemisphere (y3) obtained in the ’sweeper’ configuration of the experiment. The results of the different methods are consistent within the statistical and systematical errors. The NA35 data for central S+Ag collisions in the target hemisphere (y3) have been evaluated by averaging the results of the ’visual’ and ’automatic’ analysis technique. The distributions for S+Ag in the projectile hemisphere (y3) have been obtained by interpolation between S+S and S+Au data. The measurement of K+ and K- [5] was used to check the consistency between different methods. The K yield has to agree with the average of K+ and K- ( 0.5(K++K-) ) for an isospin zero system. Fig. 4 demonstrates that this is also fullfilled for the S+Ag system, which has a relatively small charge asymmetry. The agreement between K and 0.5(K++K-) is shown in a transverse mass distribution and a rapidity distribution in S+Ag collisions.
The determination of the kaon and hyperon yields in full phase space allows us to test whether strangeness is conserved. It has been shown on the base of the NA35 results in S+S collisions [5] that the excess of kaons over antikaons ( 2(-) ) matches the excess of hyperons over antihyperons ( 1.6(-) ). The factor 2 accounts for K0 and , the scaling factor 1.6 is taken from [6] and accounts for unobserved hyperons.
3.1. Comparison with NA36 and NA44
In Fig. 5 the results of NA35 are compared to NA44 and NA36 data for asymmetric systems. NA44 uses a spectrometer to measures charged particles yields. Its acceptance is very narrow around rapidity y=3 and reaches down to zero transverse momentum. The figure shows the agreement of the average of K+ and K- ( 0.5(K++K-) ) of NA44 in S+Pb collisions [7] with the NA35 K yield in S+Ag at midrapidity. The kaon data of NA35 and NA44 are also consistent for the S+S system [7].
The TPC-experiment NA36 measures , and K in S+Pb collisions in a limited acceptance. In order to compare the NA36 data to NA35 results the NA36 distributions were extrapolated to the full transverse momentum range. This extrapolation was done assuming an exponential behaviour in the transverse mass mT down to pT=0 (mT=m0) as demonstrated in Fig. 4. In Fig. 5 the NA35 result for in central S+Ag reactions is compared to the production determined by NA36 in S+Pb collision at 200 GeV per nucleon as presented at Quark Matter 95 [8].
In this reference the NA35 rapidity distribution was scaled down, in order to compare to the NA36 distribution in the transverse momentum range GeV/c. The scaling factor used by NA36 was 0.76. Also the sligthly softer trigger of NA36 was taken into account. For the comparison in ref.[8] the NA35 yield was scaled down by the ratio of the negative particles ( nn=0.85 ) in the two experiments. The inverse of these two scaling factors determined by NA36 was used to scale up the NA36 to the full transverse momentum range and correct for the different trigger (see Fig. 5).
For the comparison with the and K of NA36 in S+Pb collisions the data from Ref. [9] (Quark Matter 93) were used since these results were not updated in ref.[8]. The NA36 results for between QM93 and QM95 increased only by 16. In order to extrapolate the NA36 and K from the transverse momentum range GeV/c to the full pT range we calcultate the extrapolation factor as:
| (1) |
where T is the inverse slope of the transverse mass spectrum.
The extrapolation factors were calculated for and K using an inverse slope parameter T of 22015 MeV. This T parameter is similar to the values NA35 determined for strange particles in central S+Ag collisions [2]. The extrapolation factor is 1.80.05 for and 2.580.2 for K. The uncertainty for the scaling factors is determined by the error of the T parameter. Also the correction for the different trigger was applied. Fig. 5 shows that the extrapolated NA36 results are more than a factor 2 lower than the NA35 data.
4. Discussion
The rapidity distribution of the ’net protons’ () for S+S, S+Ag and S+Au [10] shown in Fig. 6 demonstrates that a larger fraction of the participating baryons are stopped in nuclear collisions at 200 GeV per nucleon and shifted towards midrapidity. The distribution of the ’net’ of NA35 (-) has a similar shape as seen in the ’net protons’, because a large fraction of the momentum of a produced is determined by the leading diquark of the proton. The - distribution of NA36 approaches zero at midrapidity, which is inconsistent with the measured ’net’ baryon density.
In Fig. 8 the S+Ag data are compared with particle yields in p+S collision at the same energy, which were scaled with the ratio of the negative hadron multiplicity in the two systems. A clear enhancement of about a factor 2 at midrapidity can be seen. The enhancement is also seen in Fig. 7 for the K multiplicity in full phase space per negative hadron (h-) for N+N, p+S, S+S, S+Ag and Pb+Pb. The K and h- multiplicities are listed in ref. [2]. The Pb+Pb data are preliminary results of experiment NA49 [11]. The ratio in Nucleus-Nucleus is enhanced by about a factor 1.6 compared to N+N and p+S collisions. In order to compare to the NA36 result for K a rough extrapolation to full phase space was done. Therefore a similar shape of the NA36 K rapidity distribution as measured by NA35 was assumed. This extrapolation has a relativ large uncertainty of about 20. The evaluated 4 multiplicity for K is 71.5. The negative particle multiplicity of NA36 in S+Pb collisions of 144 was taken from Ref. [8]. The NA36 result for the K multiplicity per negativ hadron in S+Pb is below the N+N value.
5. Conclusions
A clear enhanced strange hadron production relative to is observed
in S+A collisions compared to p+p and p+A reactions at the same energy.
This strong enhancement points at
a fast strangeness production in the dense reaction zone.
The strange particle abundances indicate a fast approach to chemical equilibrium which is
difficult to explain on the base of pure hadronic interactions.
References
- [1] P. Koch, B. Müller: Phys. Rep. 142 (1986) 167
- [2] Th. Alber et al, NA35 Collaboration, Z. Phys.C64 (1994) 195-207
- [3] J. Bartke et al, NA35 Collaboration, Z. Phys.C48 (1990) 191
- [4] J. Eschke (NA35 Collaboration), Univ. of Frankfurt PH. D. Thesis (1993)
- [5] J. Bächler et al, NA35 Collaboration, Z. Phys.C58 (1993) 367-374
- [6] A. Wroblewski, Acta Phys. Pol. B16 (1985) 379
- [7] M. Murray, NA44 Collaboration, Proc. Strangeness ’96 Workshop, Akademiai Kiado, Budapest 1996
- [8] E. Andersen et al, NA36 Collaboration (QM95), Nucl. Phys.A590 (1995) 291-306
- [9] E. Andersen et al, NA36 Collaboration (QM93), Nucl. Phys.A566 (1994) 217-224
- [10] D. Röhrich, NA35 Collaboration, Proc. Strangeness ’96 Workshop, Akademiai Kiado, Budapest 1996
- [11] S. Margetis, NA35 Collaboration, Proc. Strangeness ’96 Workshop, Akademiai Kiado, Budapest 1996