Quantitative Tests of Color Evaporation:
Charmonium Production
Abstract
The color evaporation model simply states that charmonium production is described by the same dynamics as production, i.e., by the formation of a colored pair. Its color happens to be bleached by soft final-state interactions. We show that the model gives a complete picture of charmonium production including low-energy production by proton, photon and antiproton beams, and high-energy production at the Tevatron and HERA. Our analysis includes the first next-to-leading-order calculation in the color evaporation model.
I Introduction
In a recent paper [1] we pointed out that an unorthodox prescription for the production of rapidity gaps in deep inelastic scattering, proposed by Buchmüller and Hebecker [2], suggests a description of the production of heavy quark bound states which is in agreement with the data. The prescription represents a reincarnation of the “duality” or “color evaporation” model. It is very important to study the validity of this approach as it questions the conventional treatment of the color quantum number in perturbative QCD.
The conventional treatment of color, i.e., the color singlet model, has run into serious problems describing the data on the production of charmonium [3]. While attempts to rectify the situation exist [4], the color singlet model has remained the standard by which other approaches are measured. Here we show that the color evaporation approach, which actually predates the color singlet approach, describes the available data well. After a discussion of the model itself, we show how the ratio of production by antiprotons to production by protons forms a quantitative test of the model. The model passes the test extraordinarily well. We then show how further quantitative tests can be performed using the the data on photoproduction and hadroproduction total cross sections. We finally show that the model successfully describes distributions at the Tevatron.
II The Model
Color evaporation represents a fundamental departure from the way color singlet states are treated in perturbation theory. In fact, color is “ignored”. Rather than explicitly imposing that the system is in a color singlet state in the short-distance perturbative diagrams, the appearance of color singlet asymptotic states depends solely on the outcome of large-distance fluctuations of quarks and gluons. These large-distance fluctuations are probably complex enough for the occupation of different color states to respect statistical counting. In other words, color is a nonperturbative phenomenon. In Fig. 1 we show typical diagrams for the production of -particles using the competing treatments of the color quantum number. In the diagram of Fig. 1a, the color singlet approach, the is produced in gluon-gluon interactions in association with a final state gluon which is required by color conservation. This diagram is related by crossing to the hadronic decay gluons.
In the color evaporation approach, the color singlet property of the is initially ignored. For instance, the can be produced to leading order by -annihilation into , which is the color-equivalent of the Drell-Yan process. This diagram is calculated perturbatively; its dynamics are dictated by short-distance interactions of range . It does not seem logical to enforce the color singlet property of the at short distances, given that there is an infinite time for soft gluons to readjust the color of the pair before it appears as an asymptotic or, alternatively, state. It is indeed hard to imagine that a color singlet state formed at a range , automatically survives to form a . This formalism was, in fact, proposed almost twenty years ago [5, 6, 7, 8] and subsequently abandoned for no good reason.
| (a) | (b) |
The color evaporation approach to color leads to a similar description of bound and open charm production. In the color evaporation model
| (1) |
and
| (2) |
where the cross section for producing heavy quarks, , is computed perturbatively. Diagrams are included order-by-order irrespective of the color of the pair. The coefficients and represent the statistical probabilities that the charm pair is asymptotically in a singlet or octet state.
The model also predicts that the sum of the cross sections of all onium states is given by Eq. (1). This relation is, unfortunately, difficult to test experimentally, since it requires measuring cross sections for all of the bound states at a given energy.
Other approaches similar in spirit can be found in Refs. [4] and [9]. The color evaporation approach differs from Ref. [4], the formalism of Bodwin, Braaten and Lepage (BBL), in the way that the pair exchanges color with the underlying event. In the BBL formalism, multiple gluon interactions with the pair are suppressed by powers of , the relative velocity of the heavy quarks within the . The color evaporation model assumes that these low-energy interactions can take place through multiple soft-gluon interactions; this implies a statistical treatment of color.
The color evaporation model assumes a factorization of the production of the pair, which is perturbative and process dependent, and the materialization of this pair into a charmonium state by a mechanism that is nonperturbative and process independent. This assumption is reasonable since the characteristic time scales of the two processes are very different: the time scale for the production of the pair is the inverse of the heavy quark mass, while the formation of the bound state is associated to the time scale . Therefore, comparison with the data requires knowledge of the fraction of produced onium states that materialize as ’s, i.e.,
| (3) |
where is assumed to be a constant. This assumption is in agreement with the low energy data [10, 11]. We demonstrated in Ref. [1] that simple statistical counting estimates of , , etc., accommodate all charmonia data to better than a factor of 2.
III The Tests
We discussed several qualitative tests of the color evaporation picture in Ref. [1]. One such test that we did not mention is the polarization of produced charmonium. In the framework of the color evaporation model the multiple soft gluon exchange destroys the initial polarization of the heavy quark pair [12]. This fact is in agreement with the measurements of the polarization made in fixed-target [13] and [14] reactions. The color singlet model fails to describe this feature of charmonium production [15] since it predicts that ’s are produced transversely polarized. The predictions in the literature for polarization in the BBL formalism have been somewhat controversial[16].
One of the most striking features of color evaporation is that the production of charmonium at low energies is dominated by the conversion of a colored gluon into a , as in Fig. 1b. In the conventional treatment, where color singlet states are formed at the perturbative level, 3 gluons (or 2 gluons and a photon) are required to produce a . The result is that in the color evaporation model ’s are hadroproduced not only by gluon-gluon initial states, but also via quark-antiquark fusion. In the color singlet approach such diagrams only appear at higher orders of perturbation theory and their contribution is small.
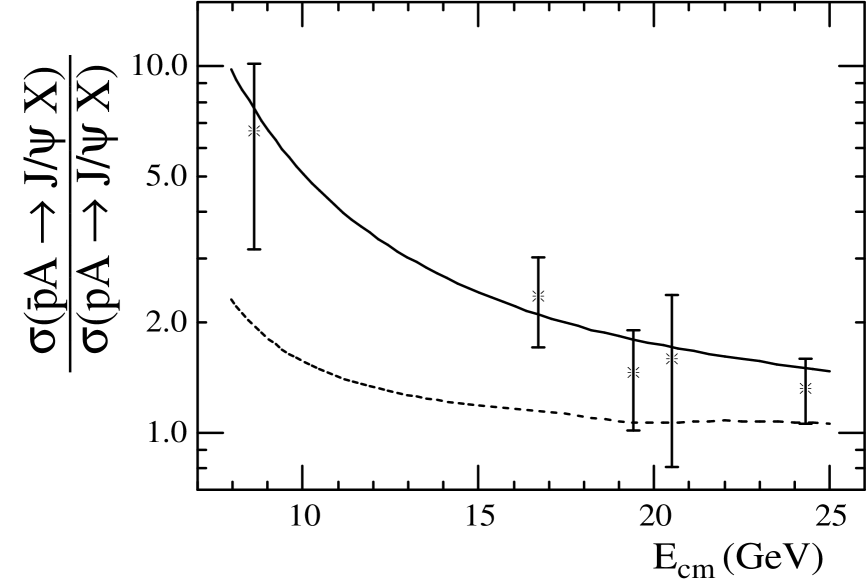
We can distinguish between the two pictures experimentally by comparing the production of charmonium by proton beams with that from antiproton beams. The color evaporation model predicts an enhanced cross section for antiproton beams, while the color singlet model predicts the same cross section for the production of ’s, whether we use proton or antiproton beams. The prediction of an enhanced yield compared to yield at low energies is obviously correct: the ratio of antiproton and proton production of ’s exceeds a factor 5 close to threshold. (See Fig. 2.) In fact, it has been known for some time that ’s are predominantly produced by states [6, 7, 8]. Nonetheless, we should note that for sufficiently high energies, gluon initial states will eventually dominate because they represent the bulk of soft partons. This can be seen in Fig. 2 where the ratio gets close to unity for center-of-mass energies as low as 25 GeV.
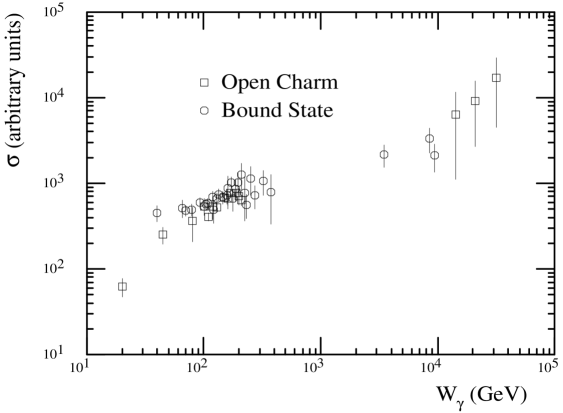
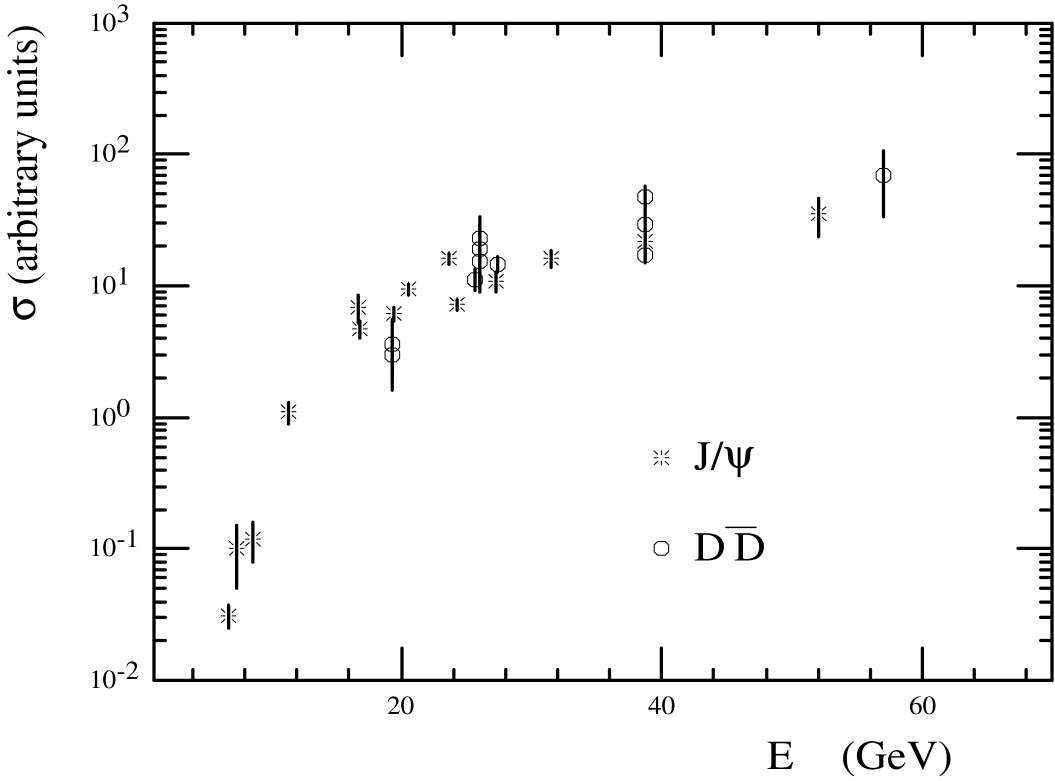
The merits of the color evaporation approach can be first appreciated by studying the data in calculation-independent ways. The factorization of the production of the pairs and the formation of onium states implies that the energy dependence and kinematic distributions of the measured cross section for the different bound states should be equivalent. Moreover, in the approximation this equivalence extends to the production of open pairs. In Fig. 3 we display charm photoproduction data for both open charm and bound state production with common normalization in order to show their identical energy behavior. In Fig. 4 we display charm hadroproduction data in a similar fashion.
Further quantitative tests of color evaporation are made possible by the fact that the factor is the same in hadro- and photoproduction. Once has been empirically determined for one initial state, the cross section is predicted without free parameters for the other. We show next that color evaporation passes this test, quantitatively accommodating all measurements, including the high energy Tevatron and HERA data, which have represented a considerable challenge for the color singlet model.
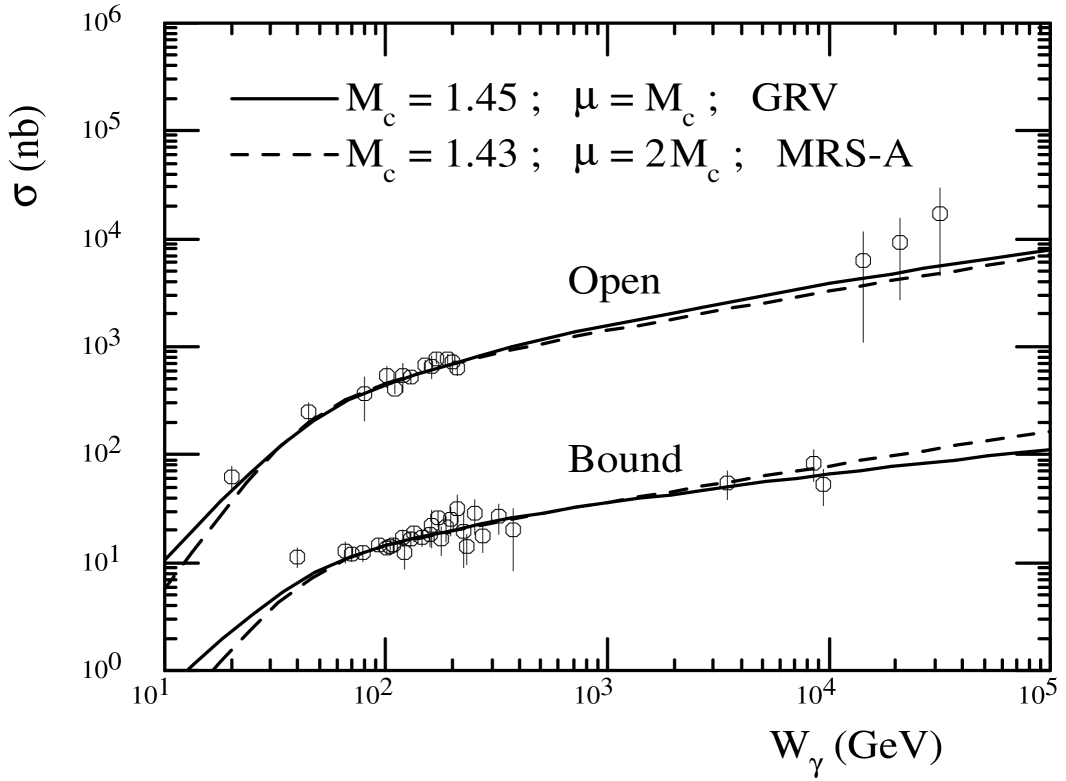
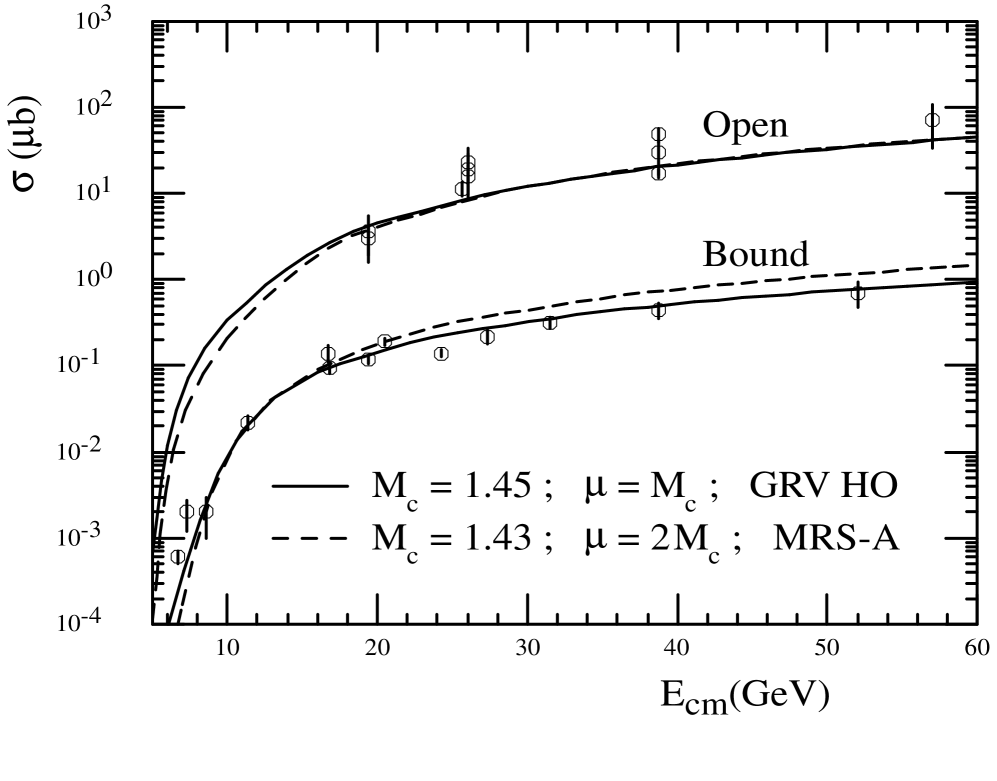
In Fig. 5 we compare the photoproduction data with theory, using the NLO perturbative QCD calculation of charm pair production from Ref. [20]. The solid line is the NLO prediction for open charm production using the GRV HO distribution function and the scale GeV. The dashed line is the prediction using the MRS A distribution function with the scale GeV. We obtained these charm quark masses from the best fit to the data for each structure function. For the production data we employed the parameters used for describing open charm, and determined the fragmentation factor to be 0.50 using GRV HO, or 0.43 using MRS A. Note that the factor possesses a substantial theoretical uncertainty due to the choice of scales and parton distribution functions. We conclude the photoproduction of and is well described by the color evaporation model. This reaction determines the only free parameter, .
At this point the predictions of the color evaporation model for hadroproduction of are completely determined, up to higher order QCD corrections. These can be determined by fitting the hadroproduction cross section of pairs with a global factor. This factor is subsequently used to correct the prediction. In Fig. 6 we compare the color evaporation model predictions with the data. In order to fit the cross section with the NLO result for the production of pairs we introduced a factor (1.71) for the GRV HO (MRS A) distribution function with the same scale and charm quark mass determined by photoproduction. Inserting this factor and the constant obtained from photoproduction into Eq. (1), we predict hadroproduction without any free parameters. We conclude from Fig. 6 that the color evaporation model describes the hadroproduction of very accurately.
As a final test, we turn to distributions at the Tevatron. The CDF collaboration has accumulated large samples of data on the production of prompt , , and [23]. This data set allows a detailed study of the distribution of the produced charmonium states. Since all the charmonium states share the same production dynamics in the color evaporation model, their distributions should be the same, up to a multiplicative constant. This prediction is confirmed by the CDF data, as we can see in Fig. 7.
In order to obtain the theoretical prediction, we computed the processes , , and at tree level using the package MADGRAPH [24]. This calculation should give a reliable estimate of the distribution at large values of . We require that the pair satisfy the invariant mass constraint on Eq. (1). Our results are shown in Fig. 7, which required a factor of in order to fit the total production. As we can see from this figure, the color evaporation model describes the general features of the distribution of the different charmonium states. Furthermore, we should keep in mind that the factor is, in general, dependent and that it is usually larger at low [25]. Higher order corrections such as soft-gluon resummation are expected to tilt our lowest order prediction, bringing it to a closer agreement with the data [26].

IV Conclusions
The color evaporation model died an untimely death. In its current reincarnation its qualitative validity can be proven directly from the available experimental data by taking ratios of production by different beams and production of different particles. Moreover, we have shown that its validity extends to the quantitative regime once we use next-to-leading-order QCD calculations for the photo- and hadroproduction of and pairs.
The color evaporation model explains all available data on distribution and energy-dependence of the cross section for the production of in all the available energy range. Moreover, it sheds some light in the relation between the production of charmonium states and pairs.
Acknowledgements.
We would like to thank P. Nason and R. K. Ellis for providing us the code containing the next-to-leading-order QCD cross sections. We would also like to thank S. Fleming for his insight. This research was supported in part by the University of Wisconsin Research Committee with funds granted by the Wisconsin Alumni Research Foundation, by the U.S. Department of Energy under grant DE-FG02-95ER40896, and by Conselho Nacional de Desenvolvimento Científico e Tecnológico (CNPq).REFERENCES
- [1] J. Amundson, O. Éboli, E. Gregores, and F. Halzen, Phys.Lett. B372, 127 (1996).
- [2] W. Buchmüller, Phys.Lett. B353, 335 (1995); W. Buchmüller and A. Hebecker Phys.Lett. B355, 573 (1995).
- [3] See, e.g., E. Braaten, S. Fleming, and T.C. Yuan, preprint OHSTPY-HEP-T-96-001 (hep-ph/9602374), to appear in Ann.Rev.Nucl.Part.Sci., and references therein.
- [4] G.T. Bodwin, E. Braaten, and G. Lepage, Phys.Rev. D51, 1125 (1995).
- [5] H. Fritzsch, Phys.Lett. B67, 217 (1977).
- [6] F. Halzen, Phys.Lett. B69, 105 (1977).
- [7] F. Halzen and S. Matsuda, Phys.Rev. D17, 1344 (1978).
- [8] M. Gluck, J. Owens, and E. Reya, Phys.Rev. D17, 2324 (1978).
- [9] P. Hoyer and C. Lam, preprint NORDITA-95/53 P (hep-ph/9507367).
- [10] R. Gavai, et al., Int.J.Mod.Phys. A10, 3043 (1995).
- [11] G.A. Schuler, preprint CERN-TH.7170/94 (hep-ph/9403387).
- [12] A. Brandenburg, O. Nachtmann, and E. Mirkes, Z.Phys. C60, 697 (1993).
- [13] C. Biino et al., Phys.Rev.Lett. 58, 2523 (1987); E537 Collaboration, C. Akerlof et al., Phys.Rev. D48, 5067 (1993).
- [14] J. G. Heinrich, et al., Phys.Rev. D44, 1909 (1991).
- [15] W.-K. Tang and M. Vänttinen, hep-ph/9603266.
- [16] E. Braaten and Yu-Qi Chen, preprint OHSTPY-HEP-T-96-010 (hep-ph/9604237).
- [17] WA39 Collaboration, M.J. Corden, et al., Phys.Lett. B98, 220 (1981); NA3 Collaboration, J. Badier, et al., Z.Phys. C20, 101 (1983); K.J. Anderson, et al., Phys.Rev.Lett. 42, 944 (1979); UA6 Collaboration, C. Morel, et al., Phys.Lett. B252, 505 (1990); M.J. Corden, et al., Phys.Lett. B68, 96 (1977).
- [18] P.L. Frabetti, et al., Phys.Lett. B316, 197 (1993); R. Barate, et al., Z.Phys. C33, 505 (1987); M. Binkley, et al., Phys.Rev.Lett.48, 73 (1982); M. Arneodo, et al., Phys.Lett. B332, 195 (1994); B. H. Denby, et al., Phys.Rev.Lett. 52, 795 (1984); M. Derrick, et al., Phys.Lett. B350, 120 (1995).
- [19] M.I. Adamovich et al., Phys.Lett. B187, 437 (1987); M.P. Alvarez et al., Z.Phys. C60, 53 (1993); K. Abe et al., Phys.Rev. D33, 1 (1986); J.J. Aubert et al., Nucl.Phys. B213, 31 (1983); J.C. Anjos et al., Phys.Rev.Lett. 62, 513 (1989); M. Derrick, et al., Phys.Lett. B349, 225 (1995).
- [20] R.K. Ellis and P. Nason, Nucl.Phys. B312, 551 (1989); P. Nason, S. Dawson, and R.K. Ellis, Nucl.Phys. B327, 49 (1989).
- [21] A. Bamberger et al., Nucl.Phys. B134, 1 (1978); J.J. Aubert et al., Phys.Rev.Lett. 33, 1404 (1974); WA39 Collaboration, M.J. Corden et al., Phys.Lett. B98, 220 (1981); Yu.M. Antipov et al., Phys.Lett. B60, 309 (1976); K.J. Anderson et al., Phys.Rev.Lett. 37, 799 (1976); NA3 Collaboration, J. Badier et al., Z.Phys. C20, 101 (1993); K.J. Anderson et al., Phys.Rev.Lett. 42, 944 (1979); E705 Collaboration, L. Antoniazzi et al., Phys.Rev.Lett. 70, 383 (1993); UA6 Collaboration, C. Morel et al., Phys.Lett. B252, 505 (1990); H.D. Snyder et al., Phys.Rev.Lett. 36, 1415 (1976); E672/706 Collaboration, V. Abramov et al., FERMILAB-PUB-91-62-E, March 1991; E789 Collaboration, M.H. Schub et al., Phys.Rev. D52, 1307 (1995); E. Nagy et al., Phys.Lett. B60, 96 (1975).
- [22] H. Cobbaert et al., Z.Phys. C36, 577 (1987); ACCMOR Collaboration, S. Barlag et al., Z.Phys. C39, 451 (1988); J.L. Ritchie et al., Phys.Lett. B126, 499 (1983); LEBC-EHS Collaboration, M. Aguilar-Benitez et al., Phys.Lett. B122, 312 (1983); ibid B123, 103 (1983); LEBC-MPS Collaboration, R. Ammar et al., Phys.Lett. B183, 110 (1987), erratum - ibid. B192, 478 (1987); R. Ammar et al., Phys.Rev.Lett. 61, 2185 (1988); A.G. Clark et al., Phys.Lett. B77, 339 (1978).
- [23] CDF Collaboration, F. Abe, et al., preprint FERMILAB-CONF-95/128-E; ibid preprint FERMILAB-CONF-95/136-E;ibid preprint FERMILAB-CONF-95/263-E.
- [24] W. Long and T. Steltzer, Comput.Phys.Commun. 81, 357 (1994).
- [25] R. Vogt, preprint LBL-37105, hep-ph/9510293.
- [26] S. Fleming, private communication.