Dependence of Nuclear Shadowing
Abstract
We re-examine the predictions of a two-phase model of shadowing in nuclear deep-inelastic scattering in light of new NMC data on the , and dependence of the ratios of structure functions. The model, which combines vector meson dominance at low with diffractive Pomeron exchange for large , agrees with the observed small, but non-zero, slopes in , which indicate the importance of higher twist shadowing effects in the transition region, GeV2. We note also that the latest E665 data on the deuteron to proton ratio suggests the presence of a small amount of shadowing in the deuteron.
pacs:
PACS numbers: 13.60.Hb; 12.40.Vv; 12.40.Gg.To appear in Phys.Rev.C
There has recently been a great deal of progress in the experimental study of the dependence of nuclear structure functions in the small- region where nuclear shadowing occurs. At CERN the New Muon Collaboration (NMC) has been able to extract the slopes in the four-momentum transfer squared, , of the ratios of structure functions of a variety of nuclei for down to 0.001 [1, 2, 3], where is the energy transfer to the target and the nucleon mass. Meanwhile, E665 at Fermilab has extended previous measurements on the deuteron and several heavier nuclei to as low as [4, 5, 6, 7].
These new measurements provide a tremendous challenge to theoretical models of nuclear deep-inelastic scattering. Not only do they cover five orders of magnitude in , but the momentum transfer squared also varies from tens of GeV2 to values as low as 0.05 GeV2. For the latter one is (to say the least) hard pressed to justify a parton model description. Clearly here one is dealing with a transition region between those regimes where hadronic and explicit quark treatments are appropriate. While it is unlikely that any single theoretical approach will be totally reliable over the entire range of and , it is important that all existing models be put to the test with a view to understanding the nature of the transition between high and low .
Our aim is to extend earlier calculations of shadowing in deuterium [8] and heavier nuclei [9] to compare with these new data. The approach taken is a two-phase model, similar to the work of Kwiecinski and Badelek [10, 11, 12]. At high virtuality the interaction of the virtual photon with the nucleus is most efficiently parametrized in terms of diffractive scattering through the double and triple Pomeron. On the other hand, at low virtuality it is most natural to apply a vector meson dominance (VMD) model, in which the virtual photon interacts with the nucleons via its hadronic structure, namely the , and mesons. The latter contribution vanishes at sufficiently high , but in the region of interest here it is in fact responsible for the majority of the variation.
For convenience we shall summarize the key ingredients of the calculation, beginning with the diffractive component. For this we use Pomeron () exchange between the projectile and two or more constituent nucleons to model the interaction of partons from different nucleons within the nucleus. Assuming factorization of the diffractive cross section [13], the shadowing correction (per nucleon) to the nuclear structure function from -exchange is written as a convolution of the Pomeron structure function, , with a distribution function (“flux factor”), , describing the number density of exchanged Pomerons:
| (1) |
where is the light-cone momentum fraction carried by the Pomeron ( is the mass of the diffractive hadronic debris), and is the momentum fraction of the Pomeron carried by the struck quark in the Pomeron. The dependence of can be calculated within Regge theory [8, 9, 10, 11, 12, 14] (for a survey of other definitions of the “flux factor” see Ref.[15]). Within experimental errors, the factorization hypothesis, as well as the dependence of [8, 9, 10, 11, 12], are consistent with the results obtained recently by the H1 [16] and ZEUS [17] Collaborations at HERA from observations of large rapidity gap events in diffractive scattering. These data also confirm previous findings by the UA8 Collaboration [18] that the Pomeron structure function contains both a hard and a soft component: . The hard component of is generated from an explicit component of the Pomeron, and has an dependence given by [14, 19], in agreement with the recent diffractive data [16, 17, 18]. The soft part, which is driven at small by the triple-Pomeron interaction [10, 19], has a sea quark-like dependence*** In Ref.[19] the soft component is associated the Fock component of the wave function., with normalization fixed by the triple-Pomeron coupling constant [20].
The dependence of on at large arises from radiative corrections to the parton distributions in the Pomeron [11, 21], which leads to a weak, logarithmic, dependence for the shadowing correction . Alone, the Pomeron contribution to shadowing would give a structure function ratio that would be almost flat for GeV2. The low- extrapolation of the component is parametrized by applying a factor , where GeV2 [22] may be interpreted as the inverse size of partons inside the virtual photon. For the nucleon sea quark densities relevant for we use the recent parametrization from Ref.[22], which includes a low- limit consistent with the real photon data, in which case the total Pomeron contribution as .
To adequately describe shadowing for small requires one to use a higher-twist mechanism, such as vector meson dominance. VMD is empirically based on the observation that some aspects of the interaction of photons with hadronic systems resemble purely hadronic interactions [23, 24]. In terms of QCD this is understood in terms of a coupling of the photon to a correlated pair of low invariant mass, which may be approximated as a virtual vector meson. One can then estimate the amount of shadowing in terms of the multiple scattering of the vector meson using Glauber theory. The corresponding correction (per nucleon) to the nuclear structure function is:
| (2) |
where is the shadowing correction to the vector meson—nucleus cross section, calculated in Ref.[9], is the photon—vector meson coupling strength [23] (see also [25]), and is the vector meson mass. In practice, only the lowest mass vector mesons () are important at low . (Inclusion of higher mass vector mesons, including continuum contributions, leads to so-called generalized vector meson dominance models [26].) Usually one omits non-diagonal vector meson transitions (), as these are not expected to be large. The vector meson propagators in Eq.(2) lead to a strong dependence of , which peaks at GeV2. For and fixed , disappears due to the vanishing of the total . Furthermore, since this is a higher twist effect, shadowing in the VMD model dies off quite rapidly between and 10 GeV2, so that for GeV2 it is almost negligible — leaving only the diffractive term, . (Note that at fixed , for decreasing the ratio approaches the photoproduction limit.)
While the asymptotic behavior of nuclear shadowing seems clear, there is still considerable interest in the transition region where the high- and low- descriptions merge. In practice, this occurs for between about 0.5 and 5 GeV2, which is precisely the region where most of the recent NMC data on , and other nuclei have been taken [1, 2, 3].
For light nuclei, such as , the dominant mechanism for nuclear shadowing involves the double scattering of the projectile from two nucleons. Higher order terms (multiple rescattering) in the Glauber expansion attenuate the incident flux of vector mesons (or of the hadronic state for the diffractive component [11]) as they traverse the nucleus, which will be progressively more important as increases [9]. For the VMD component, the magnitude of the attenuation is determined by the mean free path, , of the vector meson in the nucleus, , where is the total cross section [27]. If the mean free path of the hadronic state is independent of the mass [11], one may take the reabsorption cross section mb, although in the range covered by the NMC data the ratios are not very sensitive to the precise value of . For the single particle density in heavy nuclei () we use the Woods-Saxon (or Fermi) density, while for light nuclei () the harmonic oscillator (shell model) form is more appropriate [28]. Short range correlations are included through a Fermi gas correlation function which puts a “hole” in the two-body density approximately 0.5 fm wide at 1/2 maximum density [9]. The inclusion of correlations has the effect of decreasing slightly the amount of shadowing (i.e. increasing the ratio ) at low .
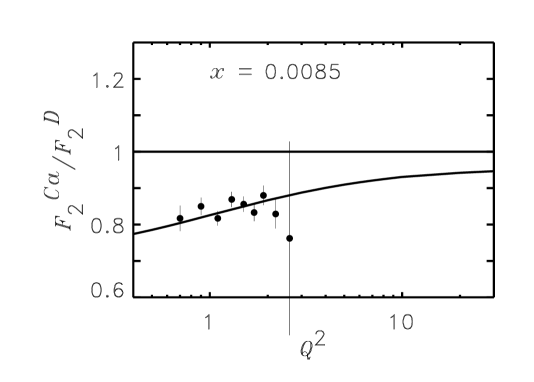
Having outlined the essential features of the model, we now turn to a detailed comparison with the data. In Fig.1 we plot the ratio of the structure functions (normalized to one nucleon) for and as a function of , for various values of ranging from to . The data represent the complete sample taken by the NMC for nuclei. The overall agreement between the model calculation and the data is clearly excellent. In particular, the observed dependence of the ratios is certainly compatible with that indicated by the NMC data. At large ( GeV2), the calculated curves are almost constant with , as would be expected from a partonic (scaling) mechanism [19, 29, 30, 31, 32]. However, in the smallest bins the values reach as low as GeV2. Clearly this region of is inaccessible to any model involving only a partonic mechanism, and it is essential here to invoke a non-scaling mechanism such as the VMD model.
It is common practice in many data analyses to extract slopes in by performing simple straight-line fits to the data — such as . To illustrate a potential difficulty with using such extracted slopes to discriminate between different models of shadowing, we plot in Fig.1 (for ) the slope that one would obtain by making a linear fit to the variation of . Evidently the slope thus obtained is negative, while the calculated curves have a positive slope. Within the present degree of accuracy, the data are equally compatible with a positive or negative slope, and the trend of the data as a function of clearly favors the positive value obtained in our calculation.
In Fig.2 we show the structure function ratio for , for between and 0.07. Again, within the error bars, the calculated and dependence is in excellent agreement with the data. The apparent small decrease in the ratio for the largest points could be due to a small nuclear dependence of the ratio of the longitudinal to transverse virtual photoabsorption cross sections [33], which is assumed to be zero in the data extraction. However, the statistics on the data do not allow a definitive statement about this effect.
In future the NMC will also produce data on the dependence of the to ratio [34]. In Fig.3(a) we show the predictions for the structure function ratio as a function of , for (lowest curve), 0.0175, 0.025, 0.035, 0.045 and 0.055 (highest curve). Because of the expected higher accuracy of these data [34], linear fits to the dependence should result in more reliable extracted slopes. In Fig.3(b) we show the slopes , extracted from the curves in Fig.3(a), as a function of . The solid line is the slope for the VMD and -exchange mechanisms, while the dashed line represents the Pomeron contribution only. We would like to stress that essentially zero slopes would be obtained in models where only a partonic mechanism would be utilized [19, 29, 30, 31]. Observation of non-zero slopes would clearly support the hypothesis that the intermediate- region is dominated by non-scaling, higher-twist effects, having a non-trivial dependence.
Data for other nuclei have also been taken recently by the NMC. The dependence of the structure function ratio of deuterium, , , , , and to carbon has been parametrized as . In Fig.4 we show the slope as a function of . The agreement at the low values is clearly very good. At larger values of () the data go above unity, and tend to lie slightly above the calculated curve. This is a reflection of the fact that the present model has no mechanism for antishadowing built in.
Having obtained excellent fits to the nuclear data, we can be reasonably confident that applying the same model to the deuteron [8, 12, 35, 36] will yield reliable results. Indeed, here one has fewer model parameters to deal with, since all of the shadowing is generated through double scattering alone. As was observed in Refs.[8, 12], the largest uncertainty in the calculation of the shadowing in deuterium is the deuteron wave function. Nevertheless, the presence of shadowing in the deuteron would be confirmed through observation of a deviation from unity in the structure function ratio in the kinematic region where Regge theory is expected to be valid. Although the exact value of below which the proton and (free) neutron structure functions become equivalent is not known, it is expected that at low enough , , in which case . In Fig.5 we show the data at very low taken by the E665 Collaboration [4], as well as the earlier NMC data at larger [37]. The calculated ratio with a small shadowing correction is shown by the solid curve, while the result for the case of no shadowing is indicated by the dashed curve. The data clearly favor the shadowing scenario. As a fraction of , the shadowing correction amounts to about 1.5% at up to about 3% for .
In summary, we have seen that the latest data from the NMC and E665 indicate that nuclear shadowing in the low- and intermediate- regions is controlled by the dynamics of a higher-twist, vector meson dominance mechanism. At larger this component disappears, leaving behind a scaling component which is understood to arise from diffractive scattering from the Pomeron component of the nucleon, and which agrees with the approximate independence of the data at large . Models based solely on partonic mechanisms can therefore provide only limited insight into the physics of nuclear shadowing.
Acknowledgements.
We would like to thank A.Brüll and A.Mücklich for providing the NMC structure function ratios, and P.Spentzouris for sending the E665 data points. We also acknowledge informative discussions with J.Milana, G.Piller, W.Ratzka, T.Sloan and W.Weise.REFERENCES
- [1] NM Collaboration, P.Amaudruz et al., Z.Phys. C 51, 387 (1991).
- [2] NM Collaboration, P.Amaudruz et al., Nucl.Phys. Nucl.Phys. B441, 3 (1995).
- [3] NM Collaboration, M.Arneodo et al., Nuovo Cim. 107A, 2141 (1994).
- [4] E665 Collaboration, M.R.Adams et al., FERMILAB-PUB-95-017-E, 1995, to appear in Phys.Rev.Lett.
- [5] E665 Collaboration, M.R.Adams et al., Phys.Lett. B 309, 477 (1993).
- [6] E665 Collaboration, M.R.Adams et al., Fermilab preprint (April 1995), hep-ex/9505006.
- [7] E665 Collaboration, M.R.Adams et al., Phys.Rev.Lett. 68, 3266 (1992).
- [8] W.Melnitchouk and A.W.Thomas, Phys.Rev. D 47, 3783 (1993).
- [9] W.Melnitchouk and A.W.Thomas, Phys.Lett. B 317, 437 (1993).
- [10] J.Kwiecinski and B.Badelek, Phys.Lett. B 208, 508 (1988).
- [11] J.Kwiecinski, Z.Phys. C 45, 461 (1990).
- [12] B.Badelek and J.Kwiecinski, Nucl.Phys. B370, 278 (1992); Phys.Rev. D 50, 4 (1994).
- [13] G.Ingelman and P.E.Schlein, Phys.Lett. 152 B, 256 (1985).
- [14] A.Donnachie and P.V.Landshoff, Phys.Lett. B 191, 309 (1987).
- [15] K.Prytz, Z.Phys. C 64, 79 (1994).
- [16] H1 Collaboration, T.Ahmed et al., Phys.Lett. B 348, 681 (1995).
- [17] ZEUS Collaboration, M.Derrick et al., DESY preprint 95-093, 1995.
- [18] UA8 Collaboration, A.Brandt et al., Phys.Lett. B 297, 417 (1992).
- [19] N.N.Nikolaev and B.G.Zakharov, Z.Phys. C 49, 607 (1991); C 53, 331 (1992).
- [20] K.Goulianos, Phys.Rep. 101, 169 (1983); Rockefeller U. preprint RU 95/E-06, 1995.
- [21] J.C.Collins, J.Huston, J.Pumplin, H.Weerts and J.J.Whitmore, Phys.Rev. D 51, 3182 (1995).
- [22] A.Donnachie and P.V.Landshoff, Z.Phys. C 61, 139 (1994).
- [23] T.H.Bauer, R.D.Spital, D.R.Yennie and F.M.Pipkin, Rev.Mod.Phys. 50, 261 (1978).
- [24] G.A.Schuler and T.Sjöstrand, Nucl.Phys. B407, 539 (1993); Phys.Rev. D 49, 2257 (1994).
- [25] H.B.O’Connell et al., Phys.Lett. B 336, 1 (1994); H.B.O’Connell et al., hep-ph/9501251, submitted for publication in Trends in Particle and Nuclear Physics, ed. W.-Y. Pauchy Hwang (Plenum Press).
- [26] C.L.Bilchak, D.Schildknecht and J.D.Stroughair, Phys.Lett. B 214, 441 (1988); ibid B 233, 461 (1989); L.L.Frankfurt and M.I.Strikman, Phys.Rep. 160, 235 (1988); Nucl.Phys. B316, 340 (1989); G.Piller and W.Weise, Phys.Rev. C 42, R1834 (1991); G.Piller, W.Ratzka and W.Weise, Z.Phys. A (1995), in print; G.Shaw, Phys.Lett. B 228, 125 (1989); Phys.Rev. D 47, R3676 (1993).
- [27] A.Donnachie and P.V.Landshoff, Phys.Lett. B 296, 227 (1992).
- [28] G.Grammar and J.D.Sullivan, in: Electromagnetic Interactions of Hadrons (Vol.2), eds. A.Donnachie and G.Shaw (Plenum Press, New York, 1978).
- [29] A.H.Mueller and J.Qiu, Nucl.Phys. B268, 427 (1986); J.Qiu, Nucl.Phys. B291, 746 (1987); E.L.Berger and J.Qiu, Phys.Lett. 206 B, 141 (1988); F.E.Close, J.Qiu and R.G.Roberts, Phys.Rev. D 40, 2820 (1989).
- [30] S.J.Brodsky and H.J.Lu, Phys.Rev.Lett. 64, 1342 (1990).
- [31] S.Kumano, Phys.Rev. C 48, 2016 (1993); ibid C 50, 1247 (1994); R.Kobayashi, S.Kumano and M.Miyama, Saga preprint SAGA-HE-78-95, 1995.
- [32] B.Kopeliovich and B.Povh, Heidelberg preprint, MPIH-V12-1995, 1995.
- [33] J.Milana, Phys.Rev. C 49, 2820 (1994).
- [34] A.Mücklich, private communication.
- [35] V.R.Zoller, Z.Phys. C 54, 425 (1992).
- [36] H.Khan and P.Hoodbhoy, Phys.Lett. B 298, 181 (1993).
- [37] NM Collaboration, M.Arneodo et al., Phys.Rev. D 50, 1 (1994).