UCD–95–9
QCD Corrections to Diboson Production111Contribution to the Proceedings of the International Symposium on Vector Boson Self-Interactions, UCLA, Feb. 1–3, 1995.
J. Ohnemus
Department of Physics
University of California
Davis, CA 95616
Abstract
The QCD radiative corrections to hadronic diboson production are reviewed. The radiative corrections for , , , , and are discussed. Similarities and differences in the behavior of the order cross sections for these processes are emphasized.
Introduction
The production of weak boson pairs is an important topic to study at hadron colliders because these processes can be used to test the standard model (SM) as well as probe beyond it [1]. Diboson production is important for the following reasons.
-
•
The , , and processes can be used to test the trilinear and couplings. These couplings are completely fixed by the gauge structure of the SM, thus measurements of these couplings provide stringent tests of the SM. Remarkable progress has recently been made in measuring these couplings at the Fermilab Tevatron collider [2].
-
•
The electroweak symmetry breaking (EWSB) mechanism can be probed by studying weak boson pair production. The EWSB mechanism is unknown, but it is believed that either there exists a scalar particle with mass TeV or else the longitudinal components of the and bosons become strongly interacting for parton center-of-mass energies larger that about 1 TeV [3]. For example, the observation of resonance production of , , or would be a signal for the standard model Higgs boson, whereas enhanced production of longitudinally polarized and pairs would be evidence for a strongly interacting EWSB scenario.
-
•
Diboson production is a potential background to new physics. New heavy particles, such as , , , , , , , and can decay into weak boson pairs.
In order to test and probe the SM with hadronic diboson production, it is necessary to have precise calculations of SM diboson production, which means the cross sections must be calculated to next-to-leading-order (NLO). The NLO cross section is, in general, less sensitive to the choices of the arbitrary factorization and renormalization scales.
The results described here are based on complete calculations of the processes where [4]. The calculations also include the leptonic decays of the and bosons [5, 6]. This is an important feature to include since the and bosons are observed experimentally via their leptonic decay products. It is therefore important to include the experimental cuts on the decay leptons when comparing a theoretical calculation to the experimental data.
The calculations have been done using a combination of analytic and Monte Carlo integration techniques. Among the advantages of this formalism are:
-
•
It is easy to impose cuts in the calculation.
-
•
It is possible to calculate any number of observables simultaneously by simply histogramming the quantity of interest.
-
•
It is possible to calculate not only the NLO inclusive cross section, but also the 0-jet and 1-jet exclusive cross sections.
The and Processes
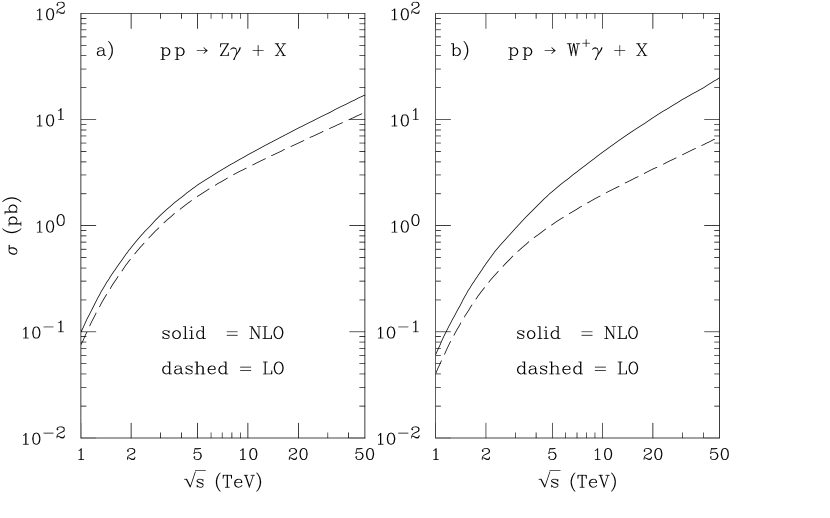
The first processes to be considered are the and processes. The total LO and NLO cross sections for these processes are plotted as functions of the center of mass energy in Fig. 1. The difference between the NLO and LO curves is the correction. In the process, the corrections range from 10% to 30% over the domain of . This is what one naively expects since is of order 0.10. In the process, on the other hand, the corrections range from 20% at small to a surprising 300% at large .
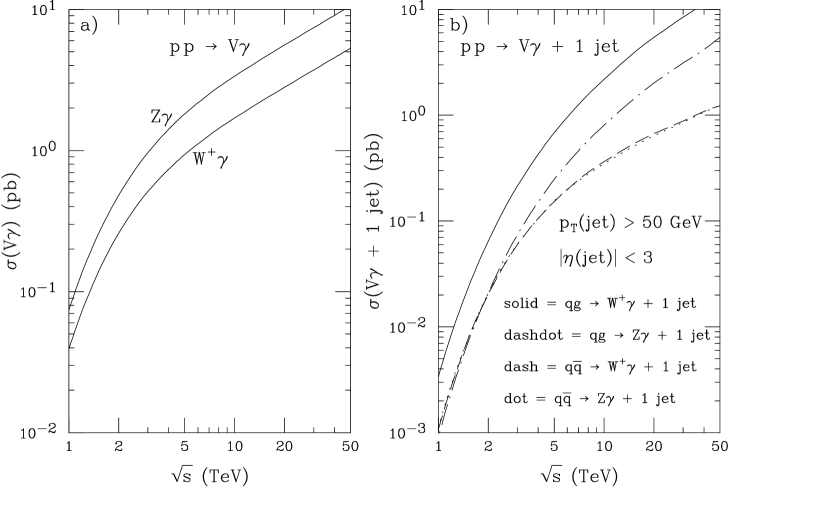
In order to understand the large corrections in the process, it is instructive to compare the behavior of the and processes for and production. Figure 2(a) compares the cross sections. Normally, hadronic production is about twice as large as hadronic production because the -to-quark coupling is about twice as big as the -to-quark coupling. However, for the and processes, exactly the opposite behavior is seen; the cross section is only half as big as the cross section. The cross section is smaller because it is suppressed by a radiation amplitude zero (RAZ) [7]. Delicate cancellations in the amplitude cause it to vanish at where is the parton center-of-mass scattering angle.
The cross sections for and are compared in Fig. 2(b). Here a jet is defined as a final state quark or gluon with transverse momentum GeV and pseudorapidity . The cross sections have been decomposed into contributions from and initial states ( also includes ). The jet cross section is about twice as big as the jet cross section, as naively expected. (The subprocess does not have a RAZ.) The jet and jet cross sections, on the other hand, are nearly equal, indicating that the former is still suppressed relative to the later. (The subprocess has a RAZ in the limit .)
In summary, the cross section is suppressed relative to the cross section by a RAZ, while the cross section is larger than the cross section due to the larger -to-quark coupling. The net result of these two behaviors is that the corrections are much larger for production than for production.
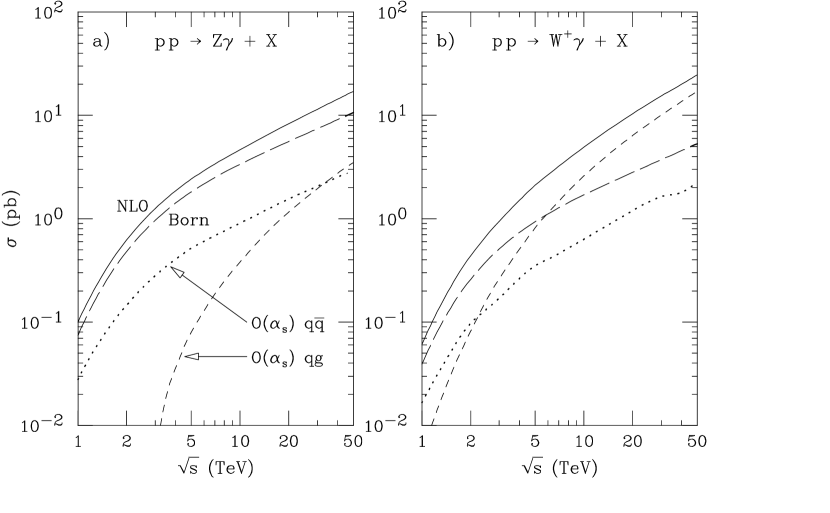
Figure 3 again shows the total and cross sections versus , but now the NLO cross sections have been decomposed into the Born cross sections and corrections from and initial states. This decomposition shows that the corrections tend to be proportional to the Born cross section, whereas the corrections increase rapidly with . The corrections increase with because the gluon density increases with .
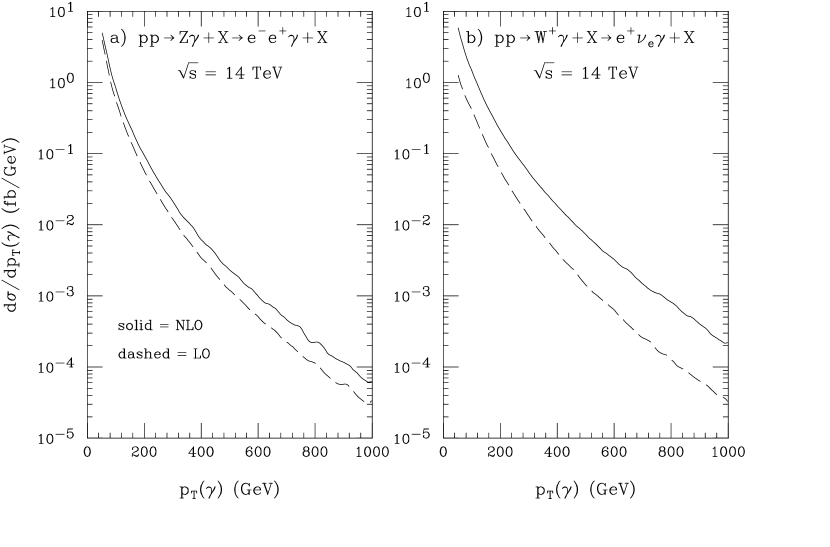
Figure 4 shows the spectra for and production at the Large Hadron Collider (LHC) center of mass energy ( TeV). The figure shows that the NLO corrections increase with . This behavior is common to all the diboson processes; the NLO corrections increase with the of the boson.
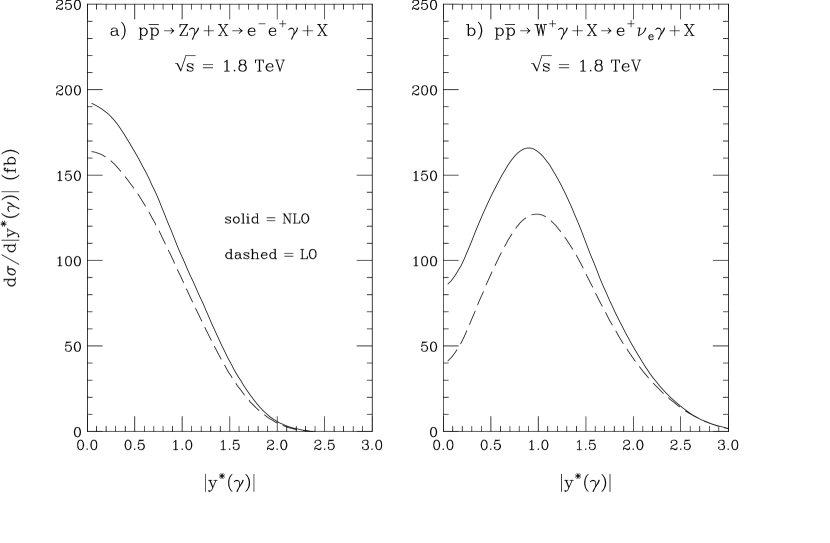
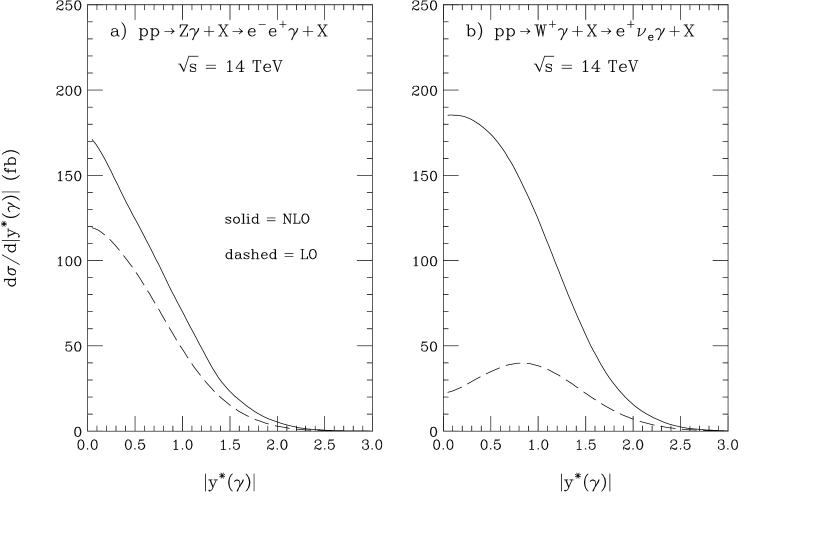
The rapidity distribution of the photon in the diboson rest frame is shown in Fig. 5 for the Tevatron center of mass energy ( TeV). For the process, the distribution exhibits the usual bell-shaped rapidity distribution, however, for the process, the distribution has a pronounced dip in the central rapidity region. This dip is due to the RAZ in the process. At the Tevatron energy, the NLO corrections slightly fill the dip, but do not obscure it. Figure 6 shows the photon rapidity distribution at the LHC energy. The NLO corrections are now very large in the process and they completely fill the dip in the central rapidity region. It may still be possible, however, to observe the dip in the jet exclusive cross section [6].
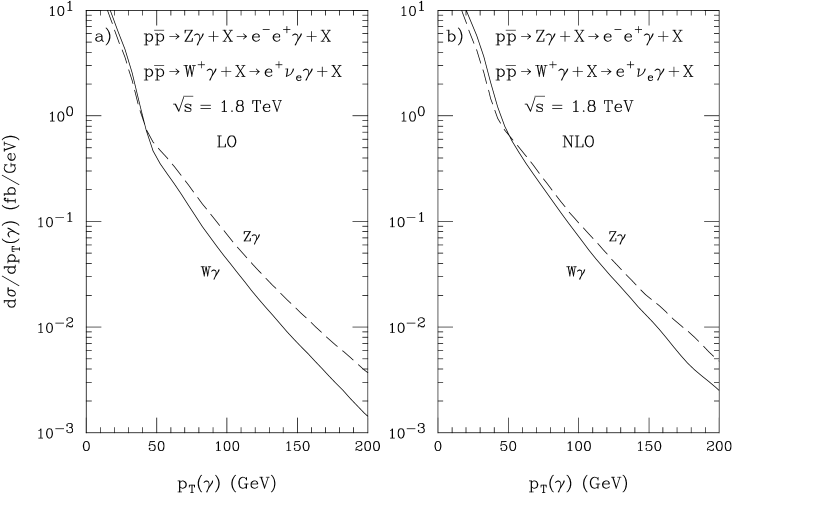
Figure 7 compares the spectra for the and processes at the Tevatron energy. This comparison shows that at high , the distribution falls more rapidly than the distribution. This behavior is also due to the RAZ in the process.
The , , and Processes
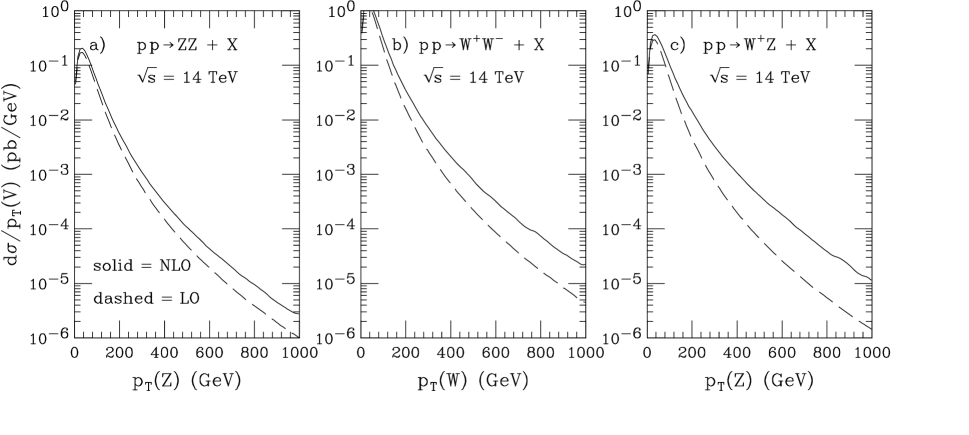
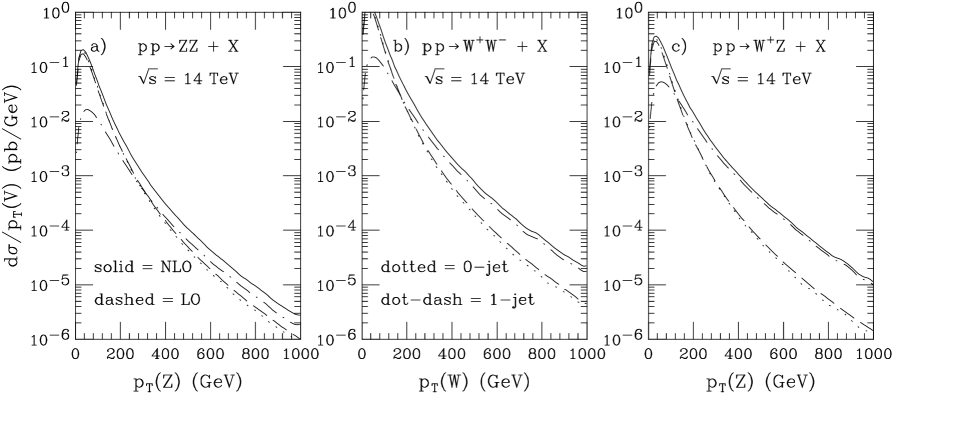
Attention now turns to the , , and processes. The transverse momentum distributions for these processes are shown in Fig. 8. The figure shows that the NLO corrections increase with the of the weak boson and are quite large at high values of . Also note that the NLO corrections increase in the order , , . This behavior will be discussed later.
Figure 9 again shows the spectra of the weak bosons, but now the 0-jet and 1-jet exclusive components of the NLO inclusive cross section are also shown. (The 0-jet and 1-jet exclusive cross sections sum to the NLO inclusive cross section.) This decomposition shows that the bulk of the large corrections at high are due to events containing a hard jet in the final state. The jet definition used here is GeV and .
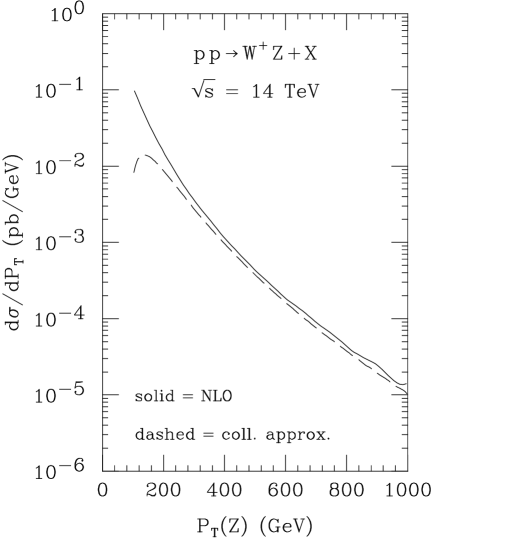
The large enhancements to the cross section at high can be traced to collinear splittings in diagrams such as followed by ; the and the quark are produced with high and the quark subsequently radiates a nearly collinear . In the collinear limit, the subprocess can be approximated by [8]
| (1) |
Figure 10 compares this collinear approximation to the full NLO calculation and shows that the approximation describes well the shape of the distribution at high .
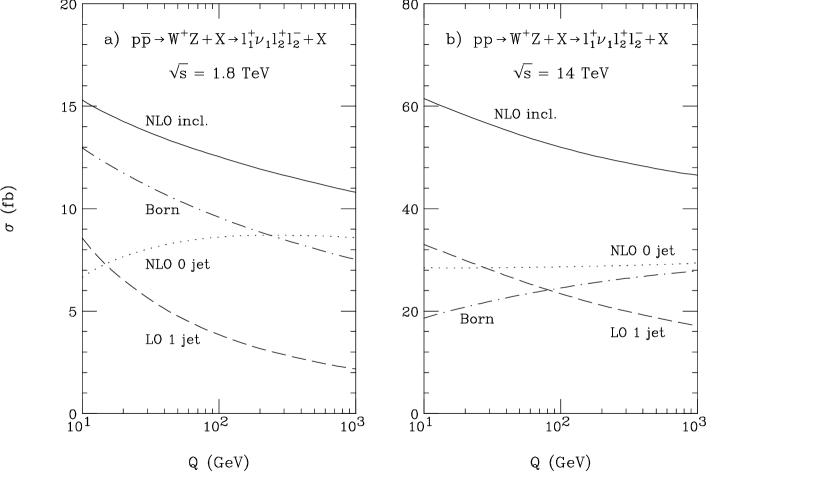
The scale dependance of the total cross section is illustrated in Fig. 11. A common scale has been used for both the renormalization scale and the factorization scale . The Born and NLO inclusive cross sections are shown along with the 0-jet and 1-jet components of the NLO inclusive cross section. The 1-jet cross section is a LO quantity and thus has considerable scale dependance. The 0-jet cross section, on the other hand, is a NLO quantity and exhibits little scale dependance. The decomposition shows that the scale dependance of the NLO inclusive cross section is dominated by the scale dependance of the 1-jet component.
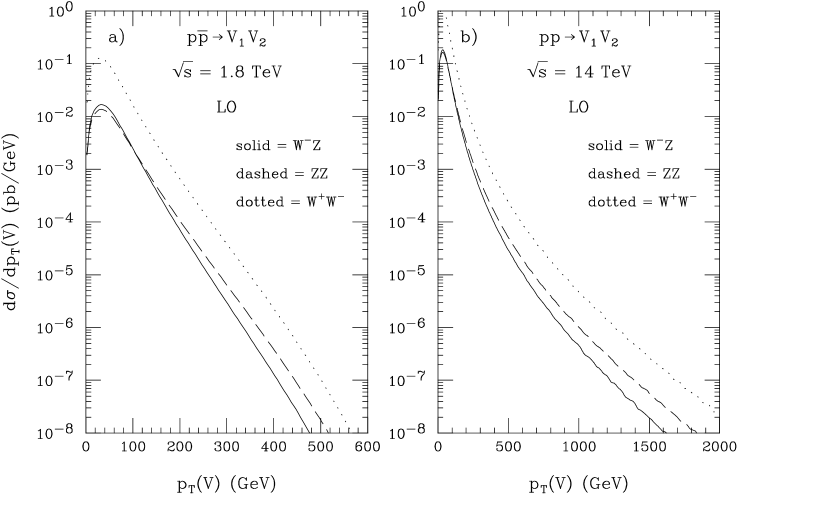
Figure 12 compares the spectra of the weak bosons for the , , and processes. The and distributions have the same shape at high and are parallel to one another, whereas the distribution falls more rapidly. A similar behavior was observed earlier in Fig. 7 where the and processes were compared. In the present case, the spectrum falls faster than the and spectra because of an approximate amplitude zero [9] in the process.
Approximate Amplitude Zero
The subprocess is very similar to the subprocess, in fact, they are described by the same set of Feynman diagrams, with and interchanged. Recall that the RAZ in the process gave rise to a large correction. A difference between the two processes is that whereas the process has an exact amplitude zero at , the process has only an approximate amplitude zero at . Basically, what happens in the case is that the dominant helicity amplitudes have an exact zero, while the other helicity amplitudes remain finite but small. The approximate amplitude zero in the process causes the NLO corrections to be larger than they were in either the or processes. The approximate amplitude zero suppresses the Born cross section and thus makes the NLO corrections appear large. A more in depth discussion of approximate amplitude zeros can be found in the talk by T. Han [10].
Summary
The QCD radiative corrections to weak boson pair production at hadron colliders has been reviewed. The ) cross sections for the diboson combinations , , , , and have been discussed and compared. Some general features of the cross sections are summarized here.
-
•
The NLO corrections increase with the center-of-mass energy. This is due to the opening of the subprocess at in conjunction with the gluon density which increases with the center-of-mass energy.
-
•
The NLO corrections are largest at high . This is due to collinear splittings in the subprocesses which give rise to an enhancement factor .
-
•
The bulk of the large corrections at high come from events which contain a hard jet in the final state.
-
•
distributions are most affected by the NLO corrections. These distributions tend to be enhanced at large values of .
-
•
Invariant mass and angular distributions under go relatively little change in shape at NLO, instead, these distributions tend to be scaled up uniformly.
-
•
The NLO corrections to production are large due to a radiation amplitude zero.
-
•
The NLO corrections to production are large due to an approximate amplitude zero.
-
•
The NLO corrections are modest at the Tevatron center of mass energy but are significant at the LHC energy.
.
References
- [1] R.W. Brown and K.O. Mikaelian, Phys. Rev. D 19, 922 (1979); R.W. Brown, K.O. Mikaelian, and D. Sahdev, ibid. 20, 1164 (1979).
- [2] See talks by H. Aihara, T. Feuss, C. Wendt, H. Johari, L. Zhang, G. Landsberg, B. Wagner, and D. Neuberger in these proceedings.
- [3] D. Dicus and V. Mathur, Phys. Rev. D 7, 3111 (1973); M. Veltman, Acta Phys. Pol. B8, 475 (1977); B.W. Lee, C. Quigg, and H. Thacker, Phys. Rev. D 16, 1519 (1977); J. van der Bij and M. Veltman, Nucl. Phys. B231, 205 (1984); M. S. Chanowitz and M. K. Gaillard, Nucl. Phys. B216, 379 (1985).
- [4] J. Ohnemus and J.F. Owens, Phys. Rev. D 43, 3626 (1991); J. Ohnemus, ibid. 44, 1403 (1991); 44, 3477 (1991); 47, 940 (1993).
- [5] J. Ohnemus, Phys. Rev. D 50, 1931 (1994); ibid. 51, 1068 (1995).
- [6] U. Baur, T. Han, and J. Ohnemus, Phys. Rev. D 48, 5140 (1993).
- [7] K.O. Mikaelian, M.A. Samuel, and D. Sahdev, Phys. Rev. Lett. 43, 746 (1979); R.W. Brown, K.O. Mikaelian, and D. Sahdev Phys. Rev. D 20, 1164 (1979); D. Zhu, Phys. Rev. D 22, 2266 (1980); T.R. Grose and K.O. Mikaelian, Phys. Rev. D 23, 123 (1981); C.J. Goebel, F. Halzen, and J.P. Leveille, Phys. Rev. D 23, 2682 (1981); S.J. Brodsky and R.W. Brown, Phys. Rev. Lett. 49, 966 (1982); M.A. Samuel, Phys. Rev. D 27, 2724 (1983); R.W. Brown, K.L. Kowalski, and S.J. Brodsky, Phys. Rev. D 28, 624 (1983); R.W. Brown and K.L. Kowalski, Phys. Rev. D 29, 2100 (1984).
- [8] S. Frixione, P. Nason, and G. Ridolfi, Nucl. Phys. B 383, 3 (1992).
- [9] U. Baur, T. Han, and J. Ohnemus, Phys. Rev. Lett. 72, 3941 (1994).
- [10] T. Han, in these proceedings.