IEKP–KA/93–8
6th July 1993
Ext. Version of CERN–PPE/93–69
Scaling Violation
in the Fragmentation Functions
in -Annihilation
W. de Boer and T. Kußmaul
Institut für Experimentelle Kernphysik
Universität Karlsruhe, Postfach 6980,
D-76128 Karlsruhe
Abstract
A determination of the hadronic fragmentation functions of the boson is presented from a study of the inclusive hadron production wit the DELPHI detector at LEP.
These fragmentation functions were compared with the ones at lower energies, thus covering data in a large kinematic range: and . A large scaling violation was observed, which was used to extract the strong coupling constant in second order QCD:
The corresponding QCD scale for five quark flavours is: MeV.
(Contribution to the XVI International Symposium on
Lepton-Photon Interactions,
Cornell, 10-15 August, 1993)
1 Introduction
Hadron production in annihilation originates from the production of quark-antiquark pairs, which can radiate gluons, the quanta of the field theory of the strong interactions, Quantum ChromoDynamics (QCD). Gluon radiation depends logarithmically on the centre of mass energy due to the increasing phase space with increasing energy and the energy dependence of the running coupling constant of QCD. These effects lead to variations of the momentum spectra of the produced hadrons as a function of the centre of mass energy, even if the momenta are scaled to that energy. These scaling violations can be used to determine the strong coupling constant .
For example, the scaling violation in deep inelastic lepton–nucleon scattering leads to [1, 2, 3]. This is somewhat lower than, but not in disagreement with, measurements at the mass from shape variables, jet rates and total cross sections as measured at the electron-positron storage ring LEP[4, 5].
Until now has not been determined from scaling violations in annihilation, since this requires precise data at two very different energies to observe a significant scaling violation. Data collected at the PEP and PETRA storage rings were only precise at energies around GeV[6, 7, 8] and the scaling violation was only observed qualitatively[9].
In this paper we present data of the inclusive hadron spectra, as measured with the DELPHI detector[10] at LEP and present the first determination from the scaling violations in the fragmentation function by combining the data at LEP with data from the PEP, PETRA and TRISTAN storage rings. The squared four-momentum transfer from the incoming leptons to outgoing hadrons studied here is two orders of magnitude larger than the ones studied in deep inelastic scattering, thus avoiding regions where non-perturbative effects noticeably influence the results. On the other hand, in annihilation one has to combine data from different experiments at different energies and study the effect of the varying quark flavour composition due to the -resonance. As will be shown, these are not dominant uncertainties (see also Ref. [11]).
2 Determination of the Fragmentation Function
The inclusive production of charged hadrons in the reaction can be described by two kinematic variables, and , where is defined as the square of the four-momentum transferred from the leptons to the hadrons and is the fraction of the beam energy carried by the hadron . In annihilation equals , the total centre of mass energy squared.
The fragmentation function is directly related to the scaled hadron momentum distribution:
| (1) |
where is the total cross section and is the sum of fragmentation functions over all five flavours, each having a weight given by the electroweak theory.
The DELPHI data were collected during 1991 at energies near the peak. Multi-hadronic events were selected according to the criteria given in Ref.[12]. The selection required that there were at least 5 charged particles with momenta above 0.2 GeV/c and a track length in the detector of at least 50 cm, that the total energy of the charged particles exceeded 15 GeV (pion mass assumed), that the forward and backward hemisphere with respect to the beam axis each contained a total energy of charged particles larger than 3 GeV, and that the polar angle of the sphericity axis was between and . In addition the momentum imbalance was restricted by requiring that the absolute sum of the three-momenta of charged particles was less than 20 GeV/c.
After these selection criteria, 186774 events at a mean centre of mass energy of 91.2 GeV were kept. The background due to beam-gas scattering and -interactions was less than 0.1% and events contributed 0.2% to the selected sample.
The scaled inclusive momentum spectrum was obtained by correcting the distribution of all charged particles for initial state radiation, particle decays, detector effects, and selection cuts. In principle is the fraction of the beam energy carried by the hadron , i.e. , but instead of the momentum was used. This was experimentally better measured and provided the same scaling violation information. The corrections were obtained from a detailed Monte Carlo simulation of the detector after generating the hadronic decays with the Monte Carlo program from the Lund group[13]. Higher order initial state bremsstrahlung radiation was implemented by using the DYMU3 program[14]. The corrected data were obtained by multiplying the data in each bin of a histogram by a correction factor defined as
| (2) |
where are the contents of the histogram bin at the generator level witout initial state radiation, and after initial state radiation and detector simulation. All primary particles with a lifetime larger than s were assumed to be stable at the generator level, i.e. they were included in , and all those with a shorter mean life (including ’s and ’s) were allowed to decay as part of the simulation process. Thus the corrected distributions include the contributions of these short-lived particles, as was the practice in experiments at lower energies. Each histogram was normalized to the total number of events. The corrected distribution is simply:
| (3) |
The corrections varied smoothly and were less than 35% for below 0.8 (see Fig. 1a). Only this range was used for the comparison with QCD in the next section. The correction factors deviated from one due to acceptance losses and momentum measurement errors. For larger values the momentum measurement errors dominated and, together with the steeply falling spectrum, caused a smearing towards higher momenta, resulting in a correction factor of 0.4 near =1. The corrected spectrum and thus the fragmentation function was obtained from the total number of events and the corrected event numbers for each value:
| (4) |
The corrected spectrum is displayed in Fig. 1b and tabulated in Table 1 together with the statistical and systematic uncertainties.
The systematic uncertainties were determined by varying the selection criteria and by using different Monte Carlo simulations. The largest uncertainty in the correction factor is connected with the uncertainty in the charged multiplicity: the integral of the distribution is equal to the total charged multiplicity, since each event has entries, so a systematic error in the multiplicity after detector simulation translates into an uncertainty on the normalisation of the distribution. Varying the cuts, especially changing the minimum number of charged particles from 5 to 6 and varying the cut on the sphericity axis between and , changed the correction factors by less than 10% of their deviation from 1, i.e. typically 3% in the intermediate range, but up to 10% for above 0.8 and below 0.04.
In the LUND Monte Carlo program several generators can be used. Partons can be generated either with the “Parton Shower” algorithm or by using the exact QCD matrix element. The difference in correction factor between these two options was less than 1% in the intermediate range. More details can be found in Ref. [15].
The relative systematic uncertainty from the sources mentioned above was parametrised in the following way:
| (5) |
This procedure gives a relative error of at least 3% for the intermediate range and increases the error near the endpoints. It should be noted that the systematic uncertainties are correlated between the bins, since a change in the selection criteria moved the correction factors for each bin all in the same direction. These correlations will be taken into account in the determination of the strong coupling constant.
A significant scaling violation is observed between the DELPHI spectrum at 91 GeV and the data from TASSO[6] at a lower centre of mass energy (see Fig. 1b). Note that the errors are smaller than the symbols for most of the data points on this logarithmic plot. In order to show the scaling violation and the errors more clearly, the ratio of the curves in Fig. 1b is shown in Fig. 2. As can be seen, the scaling violation varies from + 40 % to -30% for varying between 0.01 and 0.7. The deviation of the data from the horizontal line in each bin is, to first order, proportional to the strong coupling constant, so each data point yields an independent measurement of . All values should be consistent, which is a strong constraint and simultaneously a cross check.
In Fig. 3 the DELPHI data are compared with other experiments at lower energies[6, 7, 8, 16] for several intervals. Clearly, at small values the fragmentation function increases about 30%, while at high values it decreases by roughly the same amount. This is exactly what is expected: the higher the energy, the more phase space becomes available for gluon radiation. Since the primary quarks lose more energy due to radiation, this depopulates the high region. The radiated gluons tend to populate the small region, increasing the spectrum there.
The curves are the QCD fits for high and large , as will be described in the next chapter. Clearly all ranges agree well with the QCD fits, even if they are extrapolated to small and small . The fact that all regions can be described by a single value of the QCD scale provides the cross check mentioned above.
3 Comparison with QCD
3.1 Theoretical Framework
The scaling violations in the fragmentation function, defined by Eq. 1, are described by the coupled integro–differential evolution equations[17], which can be written as:
| (6) |
The splitting functions in the 2x2 matrix are the probabilities of finding parton with momentum fraction from its parent parton where refers to a gluon and to a quark. Note that a gluon can split into a quark–antiquark pair of any flavour, hence the summation and the factor two in front of . As mentioned before, represents the sum over the weighted contribution of each flavour (see Eq. 1), each having its own fragmentation function .
The splitting functions can be obtained by integrating the exact QCD matrix element. In order to obtain the probability of finding a hadron with momentum fraction , one has to integrate convoluted with the probability that the parton with energy fraction fragments into a hadron with momentum fraction . The symbol denotes a convolution integral:
| (7) |
Note that is the fractional hadron energy, i.e. , since and Obviously, has to be larger than , hence the lower bound in the integral.
The evolution equations describe the dependence of the fragmentation function. Their solutions have not yet been found in an analytical form. Numerical solutions, which account for second order corrections to the splitting functions or to the anomalous dimensions have been developed in Ref. [18]. Alternatively, one can integrate the exact second order QCD matrix element directly, which has some advantages, as will be discussed later.
In principle the fragmentation of quarks involves an infinite number of soft and collinear gluons. Hence, a cut-off on the isolation of the gluons is used in order to decide whether a gluon should be part of the quark fragmentation or if it should fragment independently. In the latter case it contributes to instead of .
As a cut-off, the minimum invariant mass between quarks and gluons was required to be above 9.1 GeV/c2. This cut presents an arbitrary definition of quarks and gluons, but it has to be made in any analysis of the scaling violations. It was varied in order to study its effect on the determination of , as will be discussed in the section on systematc errors.
Such an invariant mass cut selects a certain part of phase space, which varies with energy, as shown in Fig. 4. Here the energy fractions of both quarks in second order QCD were plotted against each other at centre of mass energies of 35 and 91 GeV. The 2-jet events are located at and the 3- and 4-jet events more towards the centre. One clearly observes the strong increase in phase space for the events away from the 2-jet region. The invariant mass cut
where are the invariant masses between any pair of partons and are the fractional quark energies, eliminates the soft and collinear gluons in the regions for the centre of masss energies of 35 (91) GeV. The difference in phase space between these energies increases the cross section with a given ‘hardness’ of the gluon, i.e. with a given invariant mass cut, by a factor four: the 3-jet rate varies from 20% to 80%, as shown (for a constant value of of 0.121) by the solid line in Fig. 5 .
In addition to the dependence of the phase space, one has to consider the dependence of , which has the opposite effect: it decreases the rate with increasing energy. This decrease, from the running of the coupling constant, can be observed if the phase space for the final state is defined as a constant fraction of the total phase space, for example by a constant -cut instead of a constant invariant mass cut. In this case the only dependence comes from the running of the coupling constant, which decreases the cross section by about 20% if the centre of mass energy is increased from 35 to 91 GeV[5]. This decrease of the 3-jet rate in a constant fraction of phase space is shown (for a fixed value of of 270 MeV and renormalisation scale ) as the dashed line in Fig. 5. Note that the scaling violation from the running of is a small effect compared with the scaling violation from the change in phase space, as is apparent from Fig. 5.
The large phase space dependence can be absorbed in the fragmentation function, which then depends on both and . The redefined cross section has a well determined perturbative expansion in . This would not be the case if the large phase space corrections, proportional to , were considered to be QCD corrections.
The energy dependence of can be expressed in terms of the energy independent QCD scale ; here the upper index indicates the number of flavours and the lower index the renormalisation scheme (following the convention of Ref. [19]):
| (8) |
with
The energy scale of can be related to by
where is the renormalisation scale factor. The choice of is free and QCD predictions would not depend on it if all higher orders were known. In practice, calculations have been performed only up to a fixed order and varying in a wide range indicates the uncertainty due to the higher orders, as will be discussed in the section on systematic errors. Note that different choices of change the value of . In order to keep the physical observables constant, the coefficients of the higher order terms in the expansion of the observable have to be changed correspondingly[5].
The extraction of from the observed scaling violations is straightforward. First, the dependence of the fragmentation function, which cannot be calculated perturbatively, must be parametrised from data at a reference energy. Starting from this parametrisation at the reference energy, the evolution to higher energies is predicted by QCD and compared with the observed fragmentation function at these energies. In the following sections the parametrisation of the dependence and the dependence of the fragmentation functions will be discussed.
3.2 Parametrisation of the Fragmentation Function
The fragmentation functions have been studied in great detail in annihilation. Even such details as the “string effect”, predicted in QCD by the interference effects of multiple gluon emission, have been observed[20] and can be well described by the string fragmentation model[13]. Although any parametrisation of the dependence at a given would suffice, we have chosen the string model for the following reasons:
-
•
The quark and gluon fragmentation functions are described by the string with the same parameters, thus reducing the number of free parameters.
-
•
In this model soft gluons are automatically “absorbed” in the string, i.e. they only produce some transverse momentum to the string, but do not lead to independent jets. In independent fragmentation models the fragmentation of soft gluons is problematic because of phase space restrictions for hadron production.
-
•
Quark mass effects are taken into account in the string model.
Hadrons inside a jet are characterised by the limited transverse momenta with respect to the jet axis independent of the jet energy and the longitudinal momentum spectra. These momentum components can be parametrised by two energy independent functions, a longitudinal and a transverse fragmentation function. Italics have been used here in order to distinguish these parametrisations at a reference energy from the fragmentation function .
The transverse momentum spectrum was parametrised by a Gaussian with a variance of ( MeV/c)2[21]. The longitudinal momentum spectra of light and heavy quarks are parametrised differently since the latter have much harder spectra because of their larger mass. The Lund symmetric function[22] was used for the light quarks:
| (9) |
where is the transverse mass of the hadron, determines the fraction of the primordial parton energy taken by the hadron , with , indicating the parton with energy and longitudinal momentum ; and are two free parameters. The longitudinal spectrum depends mainly on which scales like , where is the total multiplicity, so effectively there is only one free parameter. For the heavy quarks ( and ) the Peterson function[23] was used:
| (10) |
Here the free parameter, , is expected to vary as , so was used. Hence there are only two free parameters to tune the momentum spectrum ( and ). The parameters determining the fraction of strange quarks picked up from the vacuum, the ratio of vector to pseudoscalar mesons, the fraction of baryons, as well as the decay parameters were all left at their default values, since a good description of the dependence was possible with these.
3.3 Determination of the Strong Coupling Constant
The dependence of the fragmentation function can be derived either from the evolution equations or from a direct numerical integration of the exact QCD matrix element. Since the splitting functions have been derived from the integration of the matrix element, both methods are, in principle, equivalent. However, higher order differences might occur. As will be discussed in the section on systematic errors, these differences are small. Therefore, the dependence has been determined from the integration of the exact second order QCD matrix element, using the formulae from reference [24], which have been implemented in the Lund string model[13]. This method has the advantage that the convolution of the splitting and fragmentation functions is done in a consistent manner, i.e. the cuts to separate the nonperturbative region from the perturbative one are the same for the splitting and fragmentation functions. These cuts will be discussed in more detail in the section on systematic errors. Furthermore, the weights in Eq. 1 from the electroweak theory have been incorporated in this model.
The strong coupling constant was extracted in the following way. A simultaneous fit of the QCD scale and the fragmentation parameters and was made by minimising:
| (11) |
where is the normalisation factor for experiment with data in a given bin with an experimental error for that bin and an overall normalisation error . The fit function was the parametrisation from the string model convoluted with the dependence from the integration of the exact QCD matrix element and the dependence of . In order to prevent a bias from b-quark threshold corrections, only data at or above =29 GeV were used . Furthermore, data at high and low values have not been used, since the experimental correction factors are large in these regions. Fitting the data from Delphi simultaneously with all other available data[6, 7, 8, 16, 25] in the range and GeV2 yielded the results given in Table 2.
The fit was repeated for two values of the renormalisation scale. For the result was: MeV. The fit results were obtained for a value of in the Lund symmetric function111Although and are strongly correlated, one could not leave at an arbitrary value and just fit or vice-versa. A good parametrisation was obtained if was chosen in a range around 0.3.. A good agreement was observed for all values with the fragmentation parameters at both 35 and 91 GeV, so the difference between the energies depended on only. The results for are shown as the solid lines in Fig. 1b; the of the fit for was equally good.
3.4 Systematic Uncertainties
The results in the previous section include both systematic and statistical uncertainties, as well as the uncertainties from the correlation between the fragmentation parameters and . In addition there are theoretical uncertainties from the unknown higher order corrections, which are usually estimated by varying the renormalisation scale. To get the complete error estimate, the following have been investigated:
-
•
Experimental uncertainties.
In the definition of , Eq. 11, represents the total error for that data point, obtained by adding in quadrature the statistical and point-to-point systematic uncertainty, but excluding the overall normalisation error, . However, the separation between point-to-point systematic uncertainty and normalisation uncertainty is not straight forward and usually not given in the literature. Furthermore, the published systematic uncertainties are not always comparable in the possible sources which have been included. Therefore the systematic uncertainties were varied considerably in order to check their influence on the fitted value of . The following procedure was adopted: the total error, , was split into a point-to-point error and a normalisation error :(12) was varied from 1% to 3% and subtracted from the total error quoted by the experiments (using Eq. 12). If the remaining point-to-point error fell below a certain minimum value, it was adjusted to this minimum value in order to ensure that the point-to-point error squared would not become negative or too small for experiments in which all possible systematic effects had not been included in the error estimate. This minimum value was varied between 1% and 3%. Of course, the of the fit was changed if the errors were changed, but fortunately varied by only MeV if and were changed in the ranges given above. These small changes in indicate that the scaling violations are determined only by the shape of the distributions, not the absolute normalisation. The values have been summarized in the Tables 1-7 using =2% and = 3%. The total is 73 for 71 data points in the fit region using a renormalisation scale factor of 0.01. For comparison, the values outside the fit range are shown too. The correlations between the parameters depended on the assumed errors, but were never larger than 40% for any pair of parameters. The fit normalisation factors were consistent with one for all experiments, as indicated in the captions of Tables 1 and 3-7.
-
•
Differences between experiments.
In contrast to the deep inelastic lepton scattering experiments, which measure the dependence in a single experiment, we had to combine data from different accelerators, so systematic effects from differences between experiments had to be considered. They were checked by comparing the results of different combinations of experiments. The maximum difference in from the various combinations of the 6 experiments was less than 30 MeV, which is not much larger than the statistical uncertainty (see Fig. 6). The systematic uncertainty from this source was conservatively estimated to be half the maximum difference, i.e. 15 MeV, thus assuming that the whole difference was systematic and not due to statistical fluctuations. The reason for this surprisingly small spread is simple: all experiments used large solenoidal detectors in which the momentum spectrum, especially the shape, was clean and easily measured. As mentioned before, it is the change in the of the spectra which determines the scaling violation, not the absolute normalisation. -
•
x-dependence.
For low values the contributions from multiple soft gluon emission start to dominate. In this region the of the string model parametrisation becomes somewhat worse (see Tables 1 and 3-7). To estimate the uncertainty from the small range, we fit between and and varied between 0.08 and 0.4. Since the experimental correction factor for high momentum particles becomes large for , was kept at 0.8. For =0.08, for increased from 190 to 210 MeV, but for the fit range considered (, no variation in was seen (see Fig. 7). Nevertheless, the uncertainty for the selected range was conservatively estimated to be 10 MeV, which is half the difference between the values obtained for and =0.18. As mentioned in the introduction, each -value provides an independent determination of . The fact that is practically independent of the selected -range indicates that all -values are consistent. -
•
Heavy Quark Fractions.
The fragmentation effects largely cancel in the difference between the spectra at different energies. However, since the primary quark composition changes with energy, the influence of the difference in fragmentation between light and heavy quarks should be considered. Although the primary mesons from heavy quarks have the hardest momentum spectra, the spectra after decays are not much different from the ones for the light quarks and actually somewhat softer. Furthermore, it was not possible to mimic the characteristic change in shape from the QCD scaling violations by the difference in quark compositions, as shown by the dashed-dotted line in Fig. 2.Fitting the spectra at 35 and 91 GeV simultaneously was a good way to determine the fragmentation of both light and heavy quarks, since the different quark compositions at the different energies, combined with the somewhat softer spectrum of the heavy quarks, yielded only a moderate correlation between the fragmentation parameters and (see Table 2). The fitted value of the latter parameter gave an average of the B-hadrons of at the LEP energy, which is in good agreement with the value obtained from lepton spectra in semi-leptonic B decays[26, 27]. Note that the determination of from the inclusive hadron spectra included all decays and was therefore independent of the value determined from the lepton spectra.
As an additional check that the different heavy quark fractions at 35 and 91 GeV do not mask the scaling violation from QCD, the scaling violation was calculated with a constant fraction of heavy quarks ( for b-quarks and for c-quarks, which are the values at =35 GeV). The amount of scaling violation is not changed significantly, as shown in Fig. 2; the small difference was taken into account in the fit and the residual uncertainty in was estimated to be 10 MeV.
-
•
Independent versus String Fragmentation.
In the fit, the string fragmentation model was used to parametrise the dependence. As an alternative, the independent fragmentation option in the Monte Carlo program from the Lund group has been used222The following parameters were used: f=0.01,b=0.283, =500 MeV/c, stopping point of fragmentation 3.1 GeV/c. The gluon was splitted into light quark pairs according to the Altarelli-Parisi splitting function and each quark fragmented then independently. The fitted parameter values were: , , MeV.. In this case all quarks and gluons fragment independently. The whole analysis, including the parametrisation of the dependence, was repeated with this model. The fit quality was similar and the value of was not changed outside the experimental errors, again indicating that fragmentation uncertainties largely cancel in the difference between the spectra at different energies. Half the difference between the different fragmentation models (9 MeV) was taken conservatively as the error for fragmentation. -
•
The renormalisation scale uncertainty.
As mentioned before, the renormalisation scale is a free parameter; would be independent of the choice of this scale if all higher order corrections were known. However, in a fixed order calculation a lower scale implies a larger value of . For the 3-jet cross section the change in the Born cross section can be compensated by a different coefficient in the higher order correction. However, the 4-jet cross section is only known up to the Born term in second order QCD, so a lower scale for the argument of implies a higher 4-jet rate. The of the fit did not change significantly by changing the scale, but varied from 190 to 270 MeV if the scale was changed from to , which corresponded to a change in from 0.115 to 0.121 (see Fig. 7). Thus this error, originating from the unknown higher order corrections, has been found to be dominant, as in all other determinations[5]. The scale dependence was still relatively small, since we studied the difference between the spectra at different energies, so higher order contributions and fragmentation effects partially cancel. Similar observations hold for other “difference” variables, like the Asymmetry in the Energy-Energy Correlations (AEEC) or the difference in jet masses[5].An independent estimate of the higher order contributions can be obtained from the equations (6): in these equations the higher order terms are taken into account by exponentiating the leading logarithms proportional to , which appear as leading terms in a calculation to order . The difference of these terms between and is proportional to . Since in our case the difference in and is only a factor three, the exponentiated form of the leading logarithms will be close to its second order expansion, so the higher order contributions are expected to be small. This can be checked explicitly by integrating these equations in steps. Since at each step a gluon can be emitted, this corresponds to summing up all higher order terms proportional to . The change in scaling violation between 30 and 90 GeV was found to be less than 5% if was varied between 2 and 20, so this change is similar to the uncertainty from the scale dependence. Since this exercise was done only in first order, using the program from reference [28], the larger range from the scale dependence was used as an estimate of the error from the unknown higher order corrections.
-
•
Cut-off dependence.
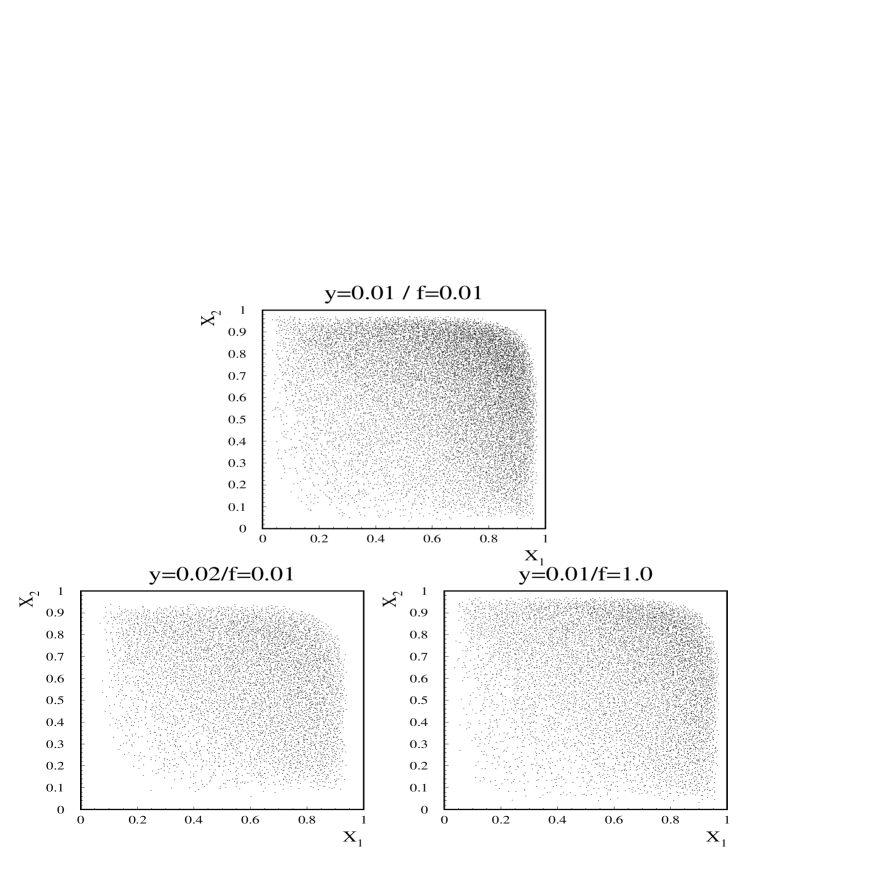
As mentioned before, the fragmentation of quarks involves a large number of soft and collinear gluons. Hence, a cut-off on the isolation of the gluons was used in order to decide whether a gluon should be part of the quark fragmentation or if it should fragment independently. Below this cut the quarks and gluons were considered to fragment into a single jet, i.e. they were considered to belong to the non-perturbative regime in the model and were recombined beforehand.As a cut-off, the minimum invariant mass between quarks and gluons was required to be above 9.1 GeV/c2. The scaling violations were not very sensitive to this cut, since they just required a different parametrisation of the nonperturbative part for a different cut. What mattered was a good parametrisation of the dependence. The cut could not be decreased, since with this cut practically all phase space was already used at the highest energy, as shown in Fig. 4. Decreasing the cut further would cause the 4-jet cross section to become so large and positive, that the 3-jet cross section would become negative in some regions of phase space due to the large and negative virtual corrections in the second order QCD matrix element in that case. Increasing the minimum invariant mass squared by a factor two resulted in an increase of of 60 MeV. Therefore an error of MeV was attributed, although part of this was presumably already absorbed in the scale error: increasing the cut-off or increasing the renormalisation scale increased in both cases, as expected for a decrease of the higher order contributions from multiple gluon radiation in both cases. This can be seen in Fig. 8, which shows the phase space of 4-jet events at an energy of 91 GeV for the default parameters (=0.01 and =0.01) at the top and the changes if is increased to 1 and to 0.02. For these cases the total 4-jet rate decreases from 28% at the default value to and 9%, respectively. Note that the change from the change in the cut is not only at the border, as one might naively expect. This can be understood, if one realizes that the cut converts many 4-jet events into 3-jet events, which can be located anywhere in the allowed phase space. Consequently, the variations of and change the higher order corrections in a vary similar manner and by counting them as independent contributions to the total systematic error is a conservative attitude.
The total errors were obtained by adding in quadrature the errors from the fit MeV), from the -dependence (10 MeV), from heavy quark fractions (10 MeV), from fragmentation (9 MeV), from the comparison between experiments (15 MeV), from the gluon cut-off dependence (30 MeV) and from the scale dependence (40 MeV). A summary of the systematic errors is given in Table 8.
4 Summary
A precise determination of the fragmentation function in the decay of the boson has been presented. A comparison with the fragmentation functions at lower energies shows a strong scaling violation, which leads in second order to a QCD scale between 190 and 270 MeV (see Table 2). Taking the average as the central value and using the total uncertainties as given in Table 8 resulted in MeV, which corresponds to
These results in the time-like region are in good agreement with the results on scaling violation from deep inelastic lepton nucleon scattering (space-like region; [1, 2, 3]) and with other determinations at LEP from jet rates and shape variables ( [4, 5]).
It should be noted that future linear colliders can operate over a large energy range, which allows a study of the scaling violations with a detector. For example, a 500 GeV linear collider can measure a large scaling violation by running for a short time ath the 91 GeV peak. From Fig. 9 it can be seen that the expected scaling violation will be even larger than the one observed between 35 and 91 GeV, thus allowing a precise determination of at high within a single experiment.
Acknowledgments
We are greatly indebted to our technical staff, collaborators and funding agencies for their support in building the DELPHI detector and to the members of the LEP Division for the superb performance of the LEP machine.
Furthermore, we would like to thank G. Altarelli, T. Sjöstrand, and B. Webber for useful discussions and B. Webber for providing us with a program for the numerical integration of the Altarelli-Parisi equations in first order.
References
- [1] M. Virchaux and A. Milsztajn, Phys. Lett. B274 (1992) 221.
- [2] A.D. Martin, W.J. Stirling and R.G. Roberts, Phys. Lett. B266 (1991) 273.
-
[3]
S. Mishra, Talk at the XXVI Int. Conf.
on High Energy Physics, Dallas, Texas, August, 1992;
CCFR Coll., P.Z. Quintas et al., Nevis Preprint 1461, subm. to Phys. Rev. Lett. -
[4]
The LEP Coll. (ALEPH, DELPHI, L3, OPAL), .
Phys. Lett. B276 (1992) 247;
ALEPH Coll., D. Decamp et al., Phys. Lett. B255 (1991) 623; ibid. B257 (1991) 479;
DELPHI Coll., P. Abreu et al., Phys. Lett. B247 (1990) 167; ibid. B252 (1990) 159; Z. Phys. C54 (1992) 55;
L3 Coll., B. Adeva et al., Phys. Lett. B248 (1990) 464; ibid. B271 (1991) 461; ibid. B284 (1992) 471;
OPAL Coll., M.Z. Akrawy et al., Phys. Lett. B235 (1990) 389; ibid. B252 (1990) 159; Z. Phys. C49 (1991) 375; P.D. Acton et al., CERN preprint PPE/91-214 (1991). -
[5]
G. Altarelli, talk at the Workshop “QCD: 20 years later”,
Aachen, Germany, 1992, CERN Preprint CERN-TH-6623-92;
S. Bethke, Talk at the 26th Int. Conf. on High Energy Physics, Univ. of Heidelberg Preprint HD-PY-92-13;
S. Bethke, Nucl. Phys. A546 (1992) 247;
S. Bethke and J.E. Pilcher, Ann. Rev. Nucl. Part. Sci 42 (1992) 251;
W. de Boer, Proc. of the 18th Slac Summer Institute on Particle Physics, July 1990, p. 431;
T. Hansl-Kozanecka, to be published in the Proc. of the 19th Slac Summer Institute on Particle Physics, July, 1991, Curie Univ. of Paris VI, preprint LPNHE-92-03;
T. Hebbeker, QCD studies at LEP, Proc. of Joint Int. Lepton-Photon Symposium & Europhysics Conf. on High Energy Physics, 2 (1992) 73;
T. Hebbeker, Phys. Rep. 217 (1992) 69. - [6] TASSO Collab., W. Braunschweig et al., Z. Phys. C47 (1990) 187.
-
[7]
O. Podobrin, Ph.D. thesis, Univ. of Hamburg, 1992 and
private communication;
CELLO Coll., H.J. Berend et al., to be published. - [8] MARK-II Coll., A. Petersen et al., Phys. Rev. D37 (1988) 1.
- [9] TASSO Collab., R. Brandelik et al., Phys. Lett. 114B (1982) 65.
- [10] DELPHI Collab., P. Aarnio et al., Nucl. Inst. and Meth. A303 (1991) 233.
- [11] W. de Boer and T. Kußmaul, talk at the Workshop “QCD: 20 years later”, Univ. of Karlsruhe Preprint, KA-IEKP/92-11.
- [12] DELPHI Collab., P. Aarnio et al., Phys. Lett. B240 (1990) 271.
-
[13]
T. Sjöstrand, Comp. Phys. Comm. 39 (1986) 347;
T. Sjöstrand and M. Bengtsson, Comp. Phys. Comm. 43 (1987) 367.
We used version JETSET 7.3. - [14] J.E. Campagne, R. Zitoun, Z. Phys.C43(1989) 469.
- [15] H. Fürstenau, Ph. D. Thesis University of Karlsruhe, IEKP-KA/92-16.
- [16] AMY Coll., Y.K. Li et al., Phys. Rev. D41 (1990)2675.
-
[17]
G. Altarelli and G. Parisi, Nucl. Phys. B126 (1977) 298;
V.N. Gribov and L.N. Lipatov, Sov. J. Nucl. Phys. 15 (1972) 78;
G. Altarelli, Phys. Rep. 81 (1982) 1. -
[18]
G. Curci, W. Furmanski, R. Petronzio, Nucl. Phys.
B175 (1980) 27;
W. Furmanski, R. Petronzio, Phys. Lett. B97 (1980) 437; Z. Phys. C11 (1982) 293;
E.G. Floratos, C. Kounnas, R. Lacaze, Nucl.Phys. B192 (1981) 417;
R.T. Herrod and S. Wada, Phys. Lett. B96 (1981) 196; Z. Phys. C9 (1981) 351;
A. Devoto, D.W. Duke, I.F. Owens, R.G. Roberts, Phys. Rev. D27 (1983) 508;
T. Munehisa, M. Okada, K. Kudoh, K. Kitani, Prog. Theor. Phys. 67 (1982) 609. - [19] Review of Particle Properties, Phys. Rev. D45 (1992) III.54.
- [20] The effect has been first observed at PETRA by the JADE Collab., W. Bartel et al., Phys. Lett. B101 (1981) 129; ibid. B134 (1984) 275. Later on it has been confirmed by many other groups, see [5].
- [21] W. de Boer and H. Fürstenau, Proc. of MC91, Workshop on Detector and Event Simulation in High Energy Physics, Amsterdam (1991), p. 616, Eds. K. Bos and B. van Eijk.
- [22] B. Andersson, G. Gustafson, B. Söderberg, Z. Phys. C20 (1983) 317.
- [23] C. Peterson, D. Schlatter, I. Schmitt, P. Zerwas, Phys. Rev. D27 (1984) 105.
-
[24]
R.K. Ellis, D.A. Ross, E.A. Terrano,
Phys. Rev. Lett. 45 (1980) 1225;
Nucl. Phys. B178 (1981) 421. - [25] ALEPH Coll., D. Buskulic et al., Z. Phys. C55 (1992) 209.
- [26] P. Roudeau, Proc. Joint Int. Lepton-Photon Symp. and Europhys. Conf. on High Energy Phys., Vol. 2, p. 303, Geneva, (1991).
- [27] J. Chrin, Z. Phys. C36 (1987) 163.
- [28] B. Webber, J. Phys. G: Nucl. Phys. 17 (1991) 1579. The parameters in this program were fitted to the data used in this analysis.
| x-bin | Data | QCD+SF | |||
| 0.00 – 0.01 | 1.38 | 400.8 | 0.8 | 12.1 | 412.9 |
| 0.01 – 0.02 | 5.60 | 409.3 | 0.7 | 12.3 | 436.2 |
| 0.02 – 0.03 | 5.27 | 264.6 | 0.6 | 7.9 | 281.5 |
| 0.03 – 0.04 | 2.01 | 185.1 | 0.5 | 5.6 | 192.0 |
| 0.04 – 0.05 | 0.39 | 137.4 | 0.4 | 4.1 | 139.3 |
| 0.05 – 0.06 | 0.01 | 105.3 | 0.4 | 3.2 | 104.5 |
| 0.06 – 0.07 | 0.21 | 83.6 | 0.3 | 2.5 | 82.0 |
| 0.07 – 0.08 | 1.00 | 68.4 | 0.3 | 2.1 | 66.0 |
| 0.08 – 0.09 | 3.46 | 56.9 | 0.3 | 1.7 | 53.4 |
| 0.09 – 0.10 | 2.12 | 47.2 | 0.2 | 1.4 | 44.9 |
| 0.10 – 0.12 | 2.68 | 37.1 | 0.2 | 1.1 | 35.1 |
| 0.12 – 0.14 | 1.25 | 27.6 | 0.1 | 0.8 | 26.6 |
| 0.14 – 0.16 | 0.53 | 20.9 | 0.1 | 0.6 | 20.3 |
| 0.16 – 0.18 | 2.02 | 16.6 | 0.1 | 0.5 | 15.8 |
| 0.18 – 0.20 | 0.41 | 12.92 | 0.09 | 0.39 | 12.61 |
| 0.20 – 0.22 | 0.21 | 10.37 | 0.09 | 0.31 | 10.18 |
| 0.22 – 0.24 | 0.46 | 8.36 | 0.08 | 0.25 | 8.15 |
| 0.24 – 0.26 | 0.33 | 6.72 | 0.07 | 0.20 | 6.80 |
| 0.26 – 0.28 | 0.58 | 5.67 | 0.06 | 0.17 | 5.51 |
| 0.28 – 0.30 | 0.11 | 4.61 | 0.06 | 0.14 | 4.64 |
| 0.30 – 0.32 | 0.32 | 3.85 | 0.05 | 0.12 | 3.90 |
| 0.32 – 0.34 | 0.15 | 3.19 | 0.05 | 0.10 | 3.21 |
| 0.34 – 0.36 | 0.15 | 2.70 | 0.04 | 0.08 | 2.66 |
| 0.36 – 0.40 | 3.89 | 2.09 | 0.03 | 0.06 | 2.21 |
| 0.40 – 0.44 | 0.04 | 1.50 | 0.02 | 0.05 | 1.48 |
| 0.44 – 0.48 | 0.19 | 1.08 | 0.02 | 0.03 | 1.09 |
| 0.48 – 0.52 | 0.05 | 0.770 | 0.016 | 0.023 | 0.761 |
| 0.52 – 0.56 | 0.50 | 0.561 | 0.014 | 0.017 | 0.570 |
| 0.56 – 0.60 | 2.31 | 0.396 | 0.011 | 0.012 | 0.376 |
| 0.60 – 0.66 | 0.66 | 0.268 | 0.007 | 0.008 | 0.260 |
| 0.66 – 0.72 | 1.97 | 0.160 | 0.006 | 0.005 | 0.167 |
| 0.72 – 0.78 | 3.53 | 0.096 | 0.004 | 0.003 | 0.088 |
| 0.78 – 0.84 | 15.69 | 0.045 | 0.002 | 0.002 | 0.055 |
| 0.84 – 0.90 | 5.72 | 0.023 | 0.002 | 0.002 | 0.019 |
| 0.90 – 1.00 | 7.58 | 0.0059 | 0.0005 | 0.0005 | 0.0044 |
| MeV | MeV | |
| corr. | ||
| corr. | ||
| corr. |
| x-Bin | Data | QCD+SF | ||
| 0.02 – 0.03 | 1.99 | 169.3 | 2.4 | 173.7 |
| 0.03 – 0.04 | 1.37 | 143.7 | 2.7 | 146.4 |
| 0.04 – 0.05 | 3.74 | 115.5 | 1.6 | 120.3 |
| 0.05 – 0.06 | 3.14 | 93.3 | 1.5 | 96.7 |
| 0.06 – 0.08 | 2.52 | 69.2 | 1.2 | 71.3 |
| 0.08 – 0.10 | 0.00 | 49.7 | 1.1 | 49.0 |
| 0.10 – 0.12 | 0.13 | 36.3 | 0.4 | 36.1 |
| 0.12 – 0.14 | 0.00 | 28.1 | 0.4 | 27.7 |
| 0.14 – 0.16 | 0.29 | 22.4 | 0.4 | 21.7 |
| 0.16 – 0.18 | 0.08 | 18.0 | 0.3 | 17.6 |
| 0.18 – 0.20 | 0.01 | 14.38 | 0.28 | 14.18 |
| 0.20 – 0.25 | 0.06 | 10.24 | 0.16 | 10.16 |
| 0.25 – 0.30 | 0.01 | 6.43 | 0.11 | 6.35 |
| 0.30 – 0.35 | 0.02 | 4.23 | 0.10 | 4.18 |
| 0.35 – 0.40 | 2.18 | 2.72 | 0.09 | 2.79 |
| 0.40 – 0.50 | 0.16 | 1.59 | 0.04 | 1.54 |
| 0.50 – 0.60 | 3.75 | 0.782 | 0.028 | 0.725 |
| 0.60 – 0.70 | 2.12 | 0.341 | 0.023 | 0.304 |
| 0.70 – 0.80 | 5.46 | 0.162 | 0.018 | 0.119 |
| 0.80 – 1.00 | 0.10 | 0.0300 | 0.0120 | 0.0259 |
| x-Bin | Data | QCD+SF | |||
| 0.00 – 0.01 | 0.04 | 62.0 | 2.0 | 69.8 | 76.0 |
| 0.01 – 0.02 | 7.46 | 153.3 | 1.1 | 7.8 | 174.2 |
| 0.02 – 0.03 | 12.80 | 155.8 | 1.1 | 4.9 | 173.7 |
| 0.03 – 0.04 | 4.73 | 136.5 | 1.0 | 4.1 | 146.4 |
| 0.04 – 0.05 | 5.59 | 111.6 | 0.9 | 3.3 | 120.3 |
| 0.05 – 0.06 | 8.54 | 88.3 | 0.8 | 2.7 | 96.7 |
| 0.06 – 0.07 | 12.30 | 71.6 | 0.7 | 2.1 | 79.7 |
| 0.07 – 0.08 | 2.22 | 59.9 | 0.7 | 2.0 | 63.0 |
| 0.08 – 0.09 | 1.32 | 50.9 | 0.6 | 1.7 | 53.0 |
| 0.09 – 0.10 | 0.20 | 44.1 | 0.6 | 1.5 | 45.0 |
| 0.10 – 0.12 | 0.14 | 36.4 | 0.4 | 1.3 | 36.1 |
| 0.12 – 0.14 | 0.05 | 27.7 | 0.3 | 1.1 | 27.7 |
| 0.14 – 0.16 | 0.00 | 21.6 | 0.3 | 0.9 | 21.7 |
| 0.16 – 0.18 | 0.02 | 17.6 | 0.3 | 0.7 | 17.6 |
| 0.18 – 0.20 | 0.04 | 14.21 | 0.24 | 0.62 | 14.18 |
| 0.20 – 0.22 | 0.01 | 11.41 | 0.21 | 0.48 | 11.53 |
| 0.22 – 0.24 | 0.06 | 9.49 | 0.19 | 0.41 | 9.65 |
| 0.24 – 0.26 | 0.68 | 8.06 | 0.18 | 0.33 | 7.83 |
| 0.26 – 0.28 | 0.30 | 6.33 | 0.16 | 0.25 | 6.52 |
| 0.28 – 0.30 | 0.29 | 5.67 | 0.15 | 0.24 | 5.57 |
| 0.30 – 0.32 | 0.51 | 4.84 | 0.14 | 0.20 | 4.71 |
| 0.32 – 0.34 | 0.73 | 4.04 | 0.13 | 0.16 | 3.91 |
| 0.34 – 0.36 | 0.07 | 3.49 | 0.12 | 0.13 | 3.47 |
| 0.36 – 0.40 | 0.20 | 2.65 | 0.07 | 0.09 | 2.62 |
| 0.40 – 0.44 | 0.24 | 1.91 | 0.06 | 0.07 | 1.88 |
| 0.44 – 0.48 | 0.00 | 1.36 | 0.05 | 0.04 | 1.37 |
| 0.48 – 0.52 | 0.65 | 1.01 | 0.04 | 0.03 | 1.05 |
| 0.52 – 0.56 | 0.38 | 0.738 | 0.035 | 0.022 | 0.766 |
| 0.56 – 0.60 | 2.08 | 0.496 | 0.027 | 0.015 | 0.541 |
| 0.60 – 0.66 | 0.56 | 0.331 | 0.018 | 0.010 | 0.348 |
| 0.66 – 0.72 | 0.47 | 0.197 | 0.012 | 0.006 | 0.207 |
| 0.72 – 0.78 | 0.59 | 0.108 | 0.008 | 0.005 | 0.116 |
| 0.78 – 0.84 | 0.50 | 0.047 | 0.004 | 0.003 | 0.051 |
| x-Bin | Data | QCD+SF | ||
| 0.00 – 0.05 | 1.71 | 115.4 | 1.8 | 115.7 |
| 0.05 – 0.10 | 3.26 | 65.1 | 1.2 | 71.6 |
| 0.10 – 0.15 | 6.29 | 31.6 | 0.6 | 30.5 |
| 0.15 – 0.20 | 6.33 | 17.5 | 0.3 | 16.9 |
| 0.20 – 0.25 | 2.60 | 10.40 | 0.21 | 10.33 |
| 0.25 – 0.30 | 0.00 | 6.29 | 0.13 | 6.58 |
| 0.30 – 0.35 | 0.07 | 4.07 | 0.09 | 4.21 |
| 0.35 – 0.40 | 0.05 | 2.76 | 0.07 | 2.90 |
| 0.40 – 0.45 | 2.01 | 1.80 | 0.06 | 1.96 |
| 0.45 – 0.50 | 5.16 | 1.18 | 0.04 | 1.32 |
| 0.50 – 0.55 | 0.37 | 0.810 | 0.039 | 0.868 |
| 0.55 – 0.60 | 1.43 | 0.515 | 0.031 | 0.574 |
| 0.60 – 0.65 | 0.23 | 0.347 | 0.023 | 0.351 |
| 0.65 – 0.70 | 2.45 | 0.227 | 0.020 | 0.269 |
| 0.70 – 0.75 | 0.43 | 0.167 | 0.020 | 0.161 |
| 0.75 – 0.80 | 1.24 | 0.104 | 0.016 | 0.090 |
| 0.80 – 0.85 | 0.11 | 0.062 | 0.013 | 0.069 |
| 0.85 – 0.90 | 2.93 | 0.025 | 0.007 | 0.039 |
| 0.90 – 0.95 | 0.76 | 0.013 | 0.005 | 0.018 |
| 0.95 – 1.00 | 1.60 | 0.012 | 0.006 | 0.005 |
| x-Bin | Data | QCD+SF | ||
| 0.00 – 0.10 | 18.93 | 134.3 | 1.0 | 152.6 |
| 0.10 – 0.20 | 1.06 | 23.5 | 0.4 | 22.9 |
| 0.20 – 0.30 | 0.05 | 7.79 | 0.22 | 7.77 |
| 0.30 – 0.40 | 0.02 | 3.17 | 0.15 | 3.16 |
| 0.40 – 0.50 | 1.35 | 1.23 | 0.09 | 1.34 |
| 0.50 – 0.60 | 2.10 | 0.532 | 0.050 | 0.605 |
| 0.60 – 0.70 | 1.42 | 0.310 | 0.038 | 0.267 |
| 0.70 – 0.80 | 1.40 | 0.124 | 0.022 | 0.099 |
| 0.80 – 0.90 | 6.25 | 0.021 | 0.006 | 0.036 |
| 0.90 – 1.00 | 5.65 | 0.0038 | 0.0018 | 0.0081 |
| x-Bin | Data | QCD+SF | |||
| 0.005 – 0.010 | 25.57 | 514.9 | 2.5 | 11.6 | 429.8 |
| 0.010 – 0.015 | 0.00 | 451.3 | 2.1 | 6.8 | 444.4 |
| 0.015 – 0.020 | 27.51 | 355.9 | 1.8 | 4.2 | 405.3 |
| 0.02 – 0.03 | 9.34 | 262.0 | 1.1 | 2.8 | 281.5 |
| 0.03 – 0.04 | 3.79 | 184.3 | 0.9 | 1.4 | 192.0 |
| 0.04 – 0.05 | 1.37 | 136.7 | 0.8 | 0.9 | 139.3 |
| 0.05 – 0.06 | 1.07 | 103.0 | 0.7 | 0.6 | 104.5 |
| 0.06 – 0.07 | 0.00 | 83.3 | 0.6 | 0.4 | 82.0 |
| 0.07 – 0.08 | 0.10 | 67.7 | 0.6 | 0.6 | 66.0 |
| 0.08 – 0.09 | 1.15 | 56.1 | 0.5 | 0.3 | 53.4 |
| 0.09 – 0.10 | 0.94 | 47.0 | 0.5 | 0.2 | 44.9 |
| 0.10 – 0.12 | 1.55 | 37.0 | 0.3 | 0.2 | 35.1 |
| 0.12 – 0.14 | 1.20 | 27.9 | 0.3 | 0.1 | 26.6 |
| 0.14 – 0.16 | 1.07 | 21.3 | 0.2 | 0.1 | 20.3 |
| 0.16 – 0.18 | 2.23 | 16.8 | 0.2 | 0.1 | 15.8 |
| 0.18 – 0.20 | 4.78 | 13.71 | 0.19 | 0.13 | 12.61 |
| 0.20 – 0.25 | 0.00 | 8.93 | 0.09 | 0.12 | 8.80 |
| 0.25 – 0.30 | 0.06 | 5.43 | 0.07 | 0.08 | 5.38 |
| 0.30 – 0.40 | 0.05 | 2.88 | 0.04 | 0.04 | 2.85 |
| 0.40 – 0.50 | 0.08 | 1.24 | 0.02 | 0.02 | 1.21 |
| 0.50 – 0.60 | 0.04 | 0.534 | 0.016 | 0.012 | 0.522 |
| 0.60 – 0.70 | 0.13 | 0.230 | 0.011 | 0.004 | 0.230 |
| 0.70 – 0.80 | 1.44 | 0.090 | 0.006 | 0.002 | 0.096 |
| Source | Error on |
|---|---|
| Errors from Fit | MeV |
| Combinations of experiments | MeV |
| Heavy Quark Fractions | MeV |
| Fragmentation dependence | MeV |
| dependence | MeV |
| Cut-off dependence | MeV |
| Scale dependence | MeV |
| Total | MeV |