The Qweak Experiment – A Search For New Physics At The TeV Scale By Measurement Of The Proton’s Weak Charge
Abstract
From a distance, the proton’s weak charge is seen through the distorting effects of clouds of virtual particles. The effective weak charge can be calculated by starting with the measured weak coupling at the Z0 pole and “running” the coupling to lower energy or, equivalently, longer distances. Because the “electroweak radiative corrections” or “loop diagrams” which give rise to the running depend not only on known particles, but on particles which have not yet been discovered, a difference between the calculated and measured weak charges may signal new physics. A measurement of to 4% will be sensitive to new physics at the few TeV scale. The experiment is based on the fact that the parity-violating longitudinal analyzing power, , in electron-proton scattering at low momentum transfer and small scattering angle, is proportional to the proton’s weak charge. The experiment plans to measure the predicted of -0.3 ppm with a combined statistical and systematic uncertainty of 2.2%, corresponding to a total uncertainty of 4% in . This requires a statistical precision of , which can be achieved in 2200 hours with an 85% polarized, 180 A electron beam incident on a 0.35 m liquid hydrogen target. A synchronous data acquisition system will integrate the detector current signals over each spin state and extract the helicity correlated, parity violating component.
Keywords:
Electron scattering, Parity violation, Proton, Weak charge, Weak coupling:
11.30.Er, 12.15.-g, 12.38.Qk, 12.60.-I, 25.30.Bf, 14.20.Dh1 Introduction
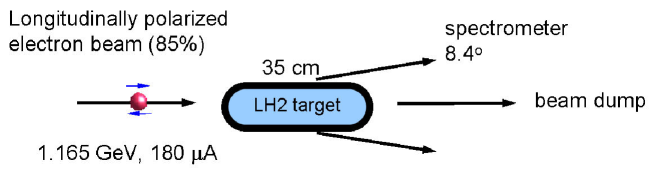
The experiment [1] (Fig. 1) plans to make a precision measurement of parity violation in the elastic scattering of longitudinally polarized electron from protons. A longitudinally polarized electron beam is passed through a 35 cm thick liquid hydrogen target and forward scattered electrons are detected using a magnetic spectrometer and detector system. The experiment measures the fractional difference in cross section for right-handed and left-handed electron helicities. It is expected that ppm, the negative sign indicating that the cross section is slightly higher for the left-handed helicity.
In conventional, parity conserving, electron scattering experiments the effective probe is the photon, which couples to the “normal” electromagnetic charge and current. Many such experiments have been done and the distribution of electric charge and magnetism in the proton is quite well known. In parity violating electron scattering experiments, on the other hand, the effective probe is the Z-boson, which couples to the weak charge. The weak charge of the proton has not been measured yet. To do this is the goal of the experiment.
It is well established that observed charges vary with the distance at which the charge is measured. For example the electric charge on the electron is given by the Particle Data Group as C, where the (14) is the uncertainty in the last two digits – a value of impressive accuracy. The electromagnetic coupling, which is the square of this charge expressed in dimensionless units, is . This is indeed the value measured at a large distance, corresponding to measurements made at very low momentum transfer (low Q). As the momentum transfer is increased, corresponding to probing closer and closer to the bare charge, the observed charge increases [2]. At , corresponding to the mass of the W-boson, . This dependence on distance is referred to as “running”. The physical reason for the running is that the bare charge is seen through the distorting effect of clouds of virtual particles. In the case of QED, fermion pairs “screen” the bare charge and cause it to appear smaller at larger distances. In the case of the strong coupling of the non-abelian QCD, the behavior is the opposite. The strong coupling is observed to be larger at longer distances and very weak close up. The screening behavior in QED and the anti-screening in QCD have been both calculated and confirmed by experiment [2,3]. The situation for the weak charge is not as clear.
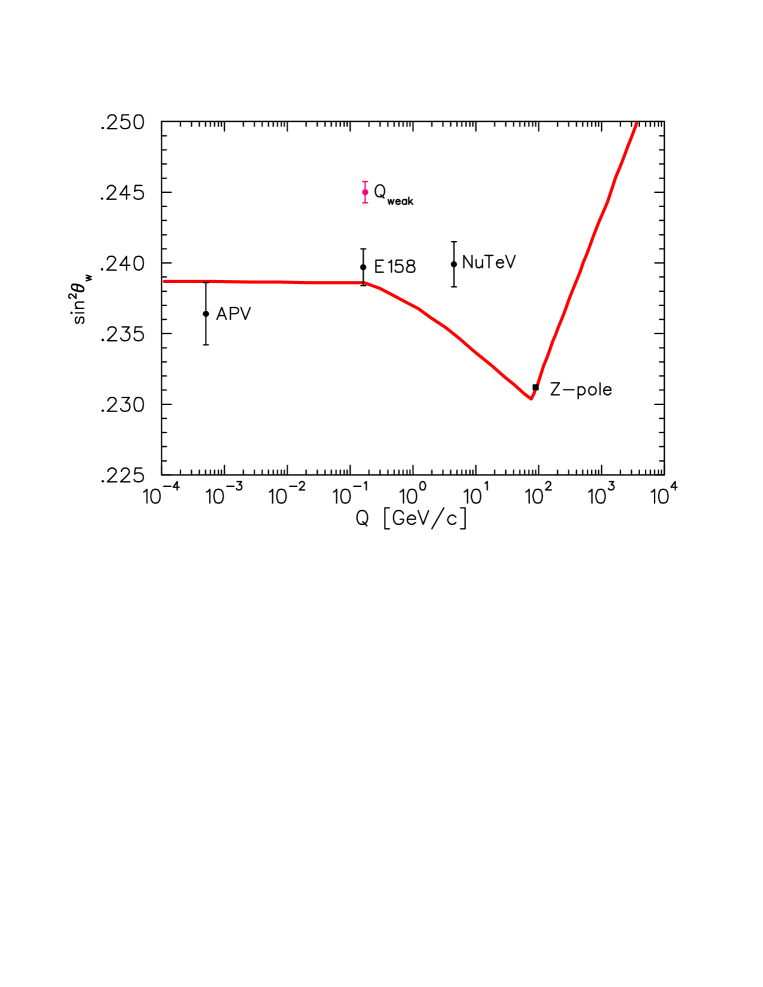
The weak charge of the proton depends on the weak mixing angle, given by , where is the U(1) gauge group coupling and the SU(2) gauge group coupling, or by , with and the masses of the Z and W bosons. The actual numerical value of depends on the renormalization scheme. In terms of the weak mixing angle, the proton’s weak charge is + corrections. The corrections depend on how much has been included in the definition of (i.e. on the renormalization scheme). Figure 2 shows the running of calculated in the (“MS bar”) renormalization scheme [4]. Note that large values of correspond to small values of . Also shown on the figure are some existing measurements [5] and the uncertainty of the proposed measurement.
Because the radiative corrections, or loop diagrams, which give rise to the running, depend not only on known particles, but on particles which have not yet been discovered, a departure from the theoretical predictions could indicate new physics. Our proposed measurement of to 4% corresponds to 0.3% in and would be sensitive to new physics on the few TeV scale. On the other hand, agreement with the calculations would put strong constraints on Standard Model extensions.
2 The Experiment
2.1 Principle
At forward angles and low Q2, the parity violating analyzing power is [6]
where is the Fermi coupling and the fine structure constant. Putting in the numbers and expressing the analyzing power in parts per million (ppm) and the momentum transfer, Q, in GeV/c, gives
The first term, proportional to Q2, is for a point-like proton. The second term, proportional to Q4, is a correction involving hadronic form factors. Ideally we would like to run at low enough Q2 that the proton would look like a point and hadronic corrections would be negligible. Unfortunately, lower Q2 also reduces our signal, so some compromise is needed. We will use Q2 = 0.03 (GeV/c)2 and a scattering angle of 8 degrees. Based on standard model calculations and global fits to existing hadronic data [7], we expect
The second term will be constrained by results from JLab (Gzero, HAPPEX), Mainz (PV-A4), and MIT-Bates (SAMPLE), so by measuring , we can extract the weak charge, .
2.2 Equipment
Figure 3 shows the main parts of the Qweak experiment. The 1.165 GeV electron beam, longitudinally polarized to more than 85%, enters from the left and passes through a 35 cm long liquid hydrogen target. Electrons scattered at 8 degrees pass through a series of collimators and an 8-sector toroidal magnetic spectrometer to the main detectors. These are eight bars of synthetic quartz each fitted at both ends with photomultipliers. Quartz was chosen because it is radiation hard (we expect ¿300 krad) and is insensitive to gamma, neutron and pion backgrounds. The bars should operate essentially at counting statistics. The main detector region will be enclosed in a shielding house. This has been removed in the figure to show the detectors. The Luminosity monitors are located at very small forward angles where the analyzing power is almost zero. They will monitor variations in beam current and also look for effects of target boiling.
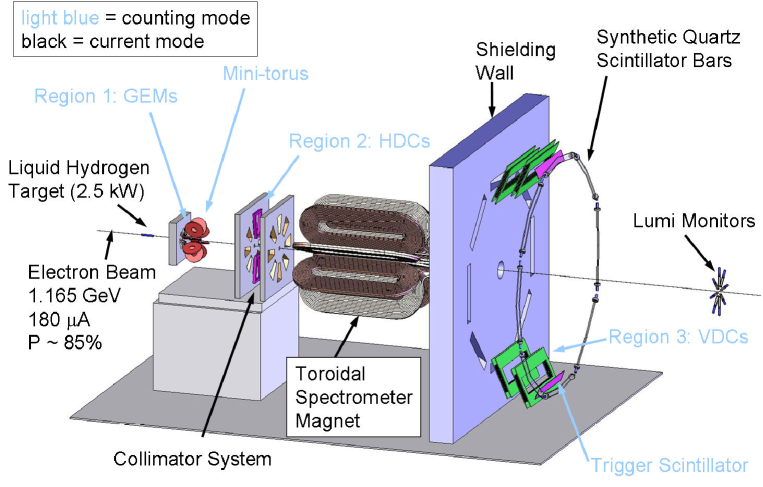
The spectrometer is arranged such that inelastic electrons are deflected out away from the main detectors and positive pions are defected inward. The collimator is designed so that neutral particles hit the shield house inside the detector window.
The liquid hydrogen target will be the highest power cryotarget ever. It will be 35 cm long with a beam heat load of 2200 watts and a total heat load of 2500 watts. To achieve the cooling, plans are to use a 500 W auxiliary heat exchanger using the end station refrigerator and a 2000 W heat exchanger using the JLab central helium liquefier extra capacity.
Also shown in Fig. 3 in the locations marked Region 1, Region 2 and Region 3, are position sensitive detectors for dedicated low current (10 nA) counting-mode calibration runs which will be occasionally made to determine the absolute and to study the backgrounds. Since the calibration is a secondary measurement, only two chambers are used at each location. The pairs can be rotated to measure all eight octants in 4 runs. When not in use, the chambers will be retracted.
The main technical issues to be addressed can be seen from the expression for :
| (1) |
2.2.1 Statistics: N+ and N-
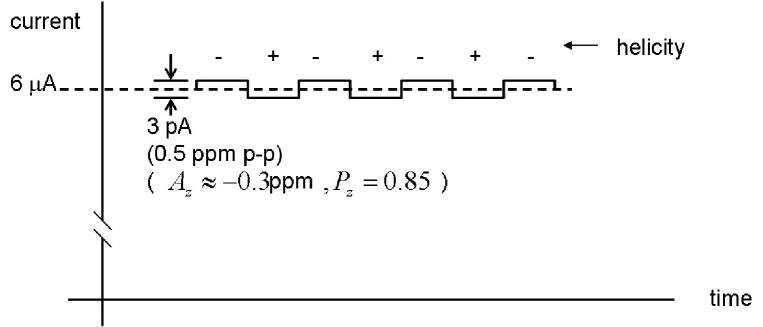
Our goal is to measure with a combined statistical and systematic uncertainty of 2%, corresponding to % on , or % on . We are planning for statistics. To achieve this in our expected 2200 hours of running demands a count rate of 6.4 GHz, too high for conventional particle counting techniques. For this reason the main data taking for the experiment will be done in current mode, using eight detectors running at 800 MHz each. The detectors are 200 cm x 18 cm x 1.25 cm synthetic quartz bars, each with two gain 1000 photomultipliers (PMTs), one at each end of the bar. Simulations and preliminary tests indicate a signal of approximately 6 A from each PMT. Superimposed on this will be a very small parity violating signal synchronized with the spin state. The small size of this signal is illustrated in Fig. 4. This signal will be integrated over each spin state by precision digital integrators being designed and built at TRIUMF. A synchronous data acquisition system will then extract only the helicity-correlated part.
2.2.2 Beam Polarization:
We expect a longitudinal beam polarization of ¿85%. As seen from equation (1), any uncertainty in the beam polarization, , will appear directly as the same fractional uncertainty in . In order to determine the beam polarization with an absolute uncertainty of less that 1%, Jefferson Lab is installing a new Hall-C Compton polarimeter. This polarimeter will be able to run continuously during data taking, unlike the existing M ller polarimeter, for which dedicated runs must be made. The Compton polarimeter should have no difficulty achieving a statistical precision of better than 1%, but it will have to be cross-calibrated against the M ller to get the absolute accuracy.
2.2.3 Absolute
Since our desired appears multiplied by the square of the momentum transfer, any error in is a corresponding error in our extracted . For this reason the experiment is being built with the capability to run in particle-counting, full-tracking mode. By reducing the beam current to 10 nA and performing dedicated runs in counting mode with full tracking, we will be able to make an absolute determination of to 0.5%. We will also require a detailed field map of the spectrometer magnet. Dedicated runs including time-of-flight will be used to estimate our background fraction.
2.2.4 Hadronic Correction:
The term will be estimated from a combination of theory and existing experiments. A considerable body of data already exists on the hadronic form factors, and by the time Qweak is running, more results will be available from the JLab G zero experiment. Our current estimates are that hadronic structure uncertainties will contribute 1.9% uncertainty to our value.
2.2.5 Helicity Correlated Beam Properties
Our signal is a change in the detector current on helicity flip. If the only thing that changed on helicity flip were the helicity, then the change in detector current would be the true parity violating signal. Unfortunately, the detector signal also depends on beam parameters other than helicity. For example, it obviously depends directly on beam current; it will also depend to a lesser degree on parameters such as beam position, beam size, and beam energy. Changes in such beam properties, when coherent with spin flip, can imitate parity violation and introduce a systematic error in our measurement. The approach to minimizing such systematic errors is threefold. First, the experiment is designed in such a way as to minimize the sensitivity to helicity correlated beam properties. Second, machine conditions are carefully optimized to minimize unwanted changes on helicity flip. In some cases active feedback may be useful. Third, the actual helicity correlated beam properties are measured during running, the sesitivities to these properties are measured, and corrections are made for the resultant systematic error. Of course, each systematic error correction carries with it an uncertainty which must be taken into account when quoting the final result. We have carried out Monte Carlo simulations to estimate our sensitivities to coherent modulations and have set acceptable limits on the beam parameters. Table 1 shows the results of GEANT simulations.
| Source | Error goes as | DC Conditions | Helicity Correlated |
|---|---|---|---|
| Poition Modulation | mm | = 20 nm | |
| mm | |||
| % | |||
| Size Modulations | m | m | |
| Direction Modulation | rad | rad | |
| Energy Modulation | GeV | eV |
The conditions shown are those required to keep each false Az contribution to ¡ . Notice that conditions can be traded off. For example if the beam can be held closer to the neutral axis, then more beam motion can be tolerated. The sensitivity to position modulation also depends on the symmetry of the apparatus. As noted in column three, this simulation assumed that the detector bars are positioned radially to better than 19 mm and that the magnetic field is known to 1.6 %. We do not anticipate any serious problem meeting the beam quality specifications as the G zero experiment has already achieved a similar quality of beam in Hall-C [8].
2.2.6 Error Budget
| Source | ||
|---|---|---|
| Statistical (2200 hours) | 1.8% | 2.9% |
| Systematic: | ||
| Hadronic Structure Uncertainties | – | 1.9% |
| Beam Polarization | 1.0% | 1.6% |
| Absolute determination | 0.5% | 1.1% |
| Backgrounds | 0.5% | 0.8% |
| Helicity correlated beam properties | 0.5% | 0.8% |
| Total: | 2.2% | 4.1% |
The expected contributions of various sources of uncertainty are summarized in Table 2. The errors shown will lead to a 0.3% determination of . Actually, the raw uncertainty in is closer to 0.2%, but an additional uncertainty associated with QCD corrections applied to the extraction of raises the uncertainty to 0.3%.
2.3 Status of the Experiment
The Qweak collaboration was formed in May 2000. The JLab proposal was approved with an “A” rating in January 2002 and the Technical Design Review was completed in January 2003. In 2003 and 2004 funding was approved by DOE, NSF and NSERC. In January 2005 a further JLab “Jeopardy” proposal was approved, again with “A” rating. Here is a summary of the state of the major sub-systems:
-
•
All the magnet parts are at MIT and have been assembled and surveyed. We expect to power up the magnet in the summer of 2007 and perform a magnetic field map. Once this is complete the magnet can be delivered to Jefferson Lab. The magnet should ship to JLab in the summer of 2008.
-
•
The first prototype digital integrator for the main current-mode running has been tested at TRIUMF and shipped to JLab for further testing. Following tests in 2007, more digital integrators and low noise preamplifiers will be built at TRIUMF and delivered to JLab.
-
•
All the quartz bars needed for the 8 main detectors are now at JLab and are undergoing quality control testing. Work is also proceeding at JLab on design and testing of the low-gain photomultiplier and base package.
-
•
Design is proceeding well on the liquid hydrogen target. Work now is concentrating of heat exchanger design.
-
•
Prototypes of most of the tracking chambers have been built and are being tested.
-
•
A luminosity monitor (lumi) will be tested at JLab in 2007.
-
•
JLab engineers have produced a full 3D CAD model of the experiment. This will be vital to verify the interfaces between different parts of the experiment and the fitting of the experiment in Hall-C.
Installation of the experiment in Hall-C is scheduled to begin in March, 2009.
References
- (1) The Qweak Collaboration: R. Carlini et al., Jefferson Lab Proposal E05-008 (2005).
- (2) for example: I. Levine et al., Phys. Rev. Lett. 78, 424, (1997).
- (3) see Particle Data Group review: J. Phys. G 33, 116, (2006).
- (4) J. Erler and M.J. Ramsey-Musolf, Phys Rev. D 72, 073003 (2005).
-
(5)
Atomic Cesium: S.C. Bennett and C.E. Wieman, Phys. Rev. Lett.
82, 2484, (1999); C.S. Wood et al., Science 275, 1759 (1997).
SLAC E158: P.L. Anthony et al., Phys. Rev. Lett. 95, 081601 (2005).
NuTeV: G.P. Zeller et al., Phys. Rev. Lett. 88, 091802 (2002). - (6) M.J. Musolf et al., Physics Reports 239, 1 (1994).
- (7) R.D. Young, Jefferson Lab., private communication, (2006).
- (8) K. Nakahara, Eur. Phys. J. A 24, 119 (2005).